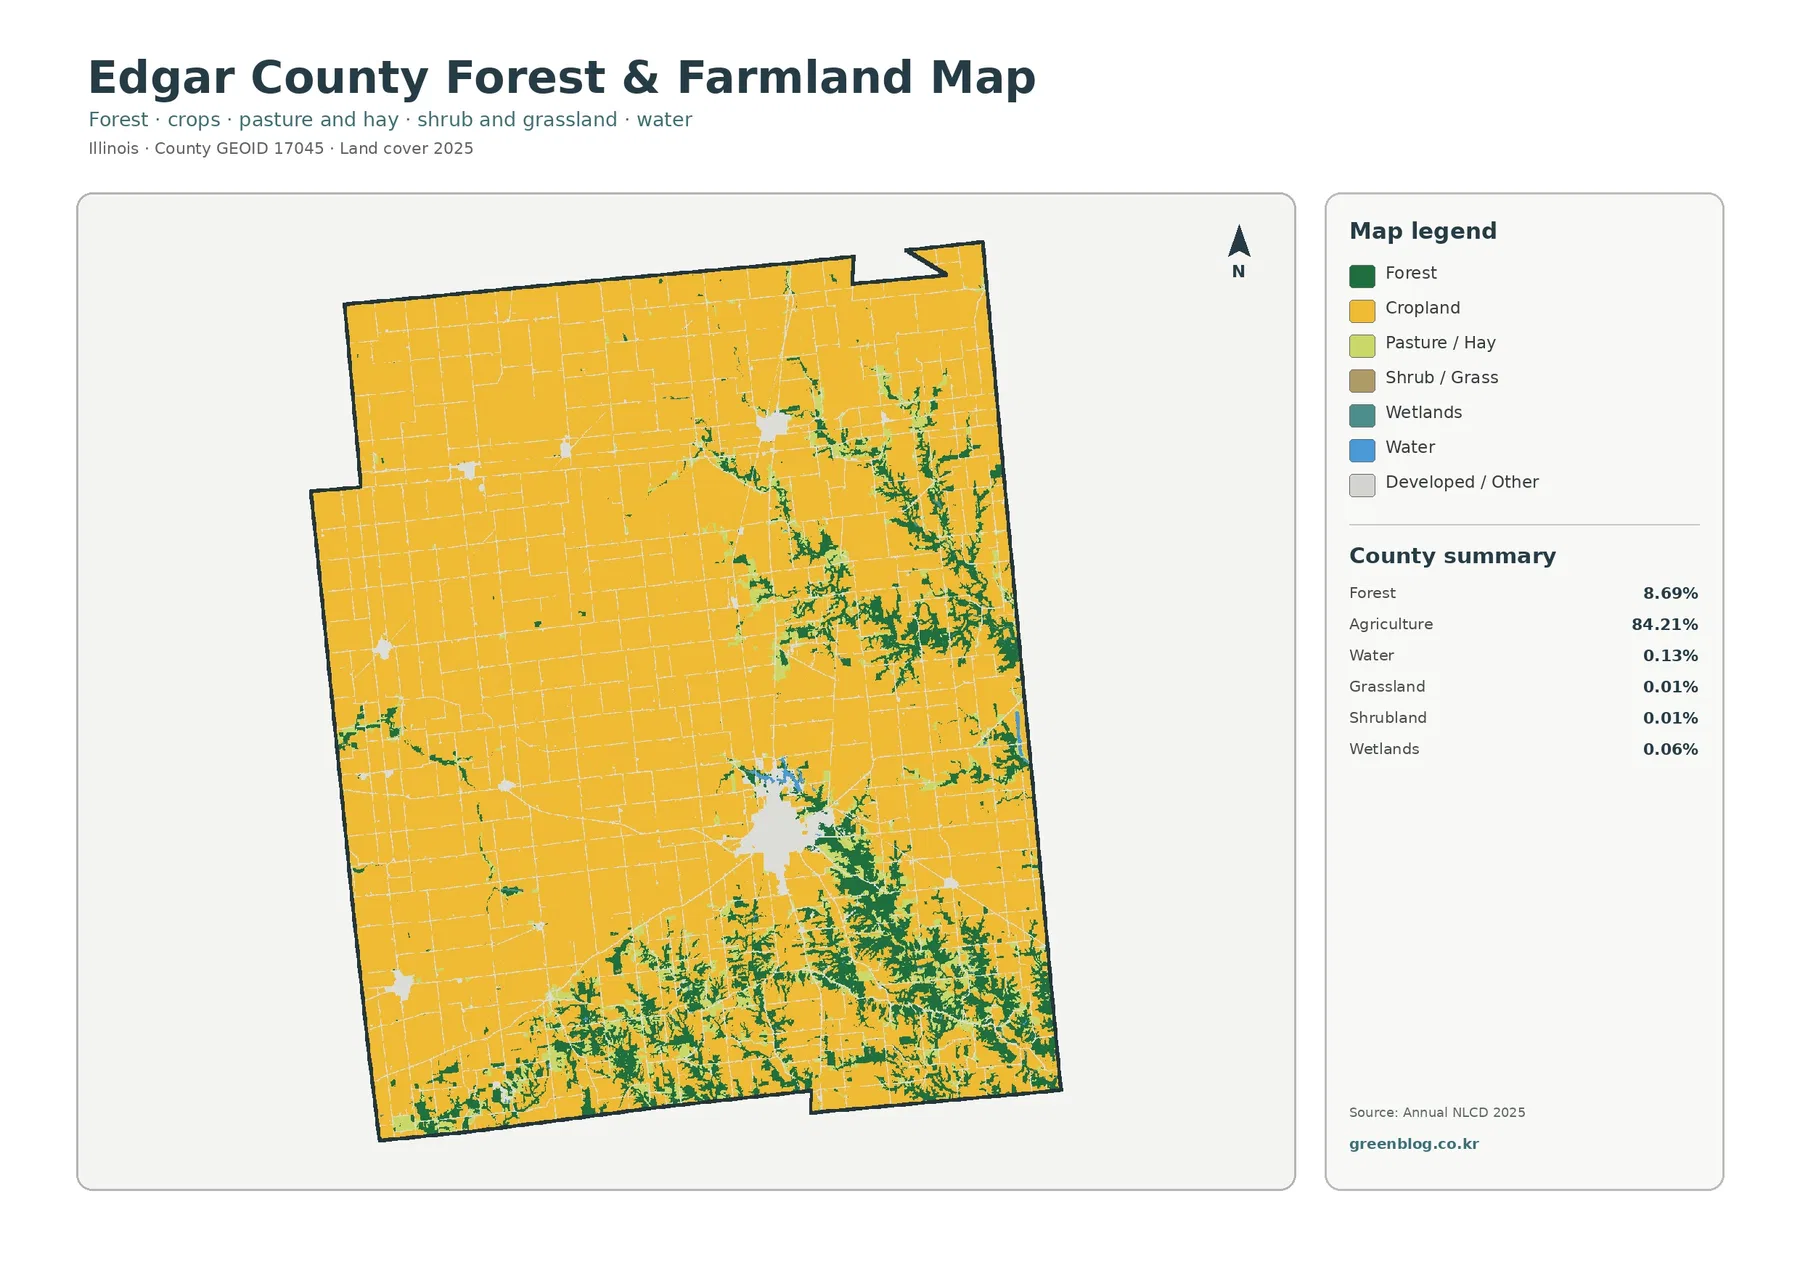
Edgar County is overwhelmingly agricultural in the 2025 land-cover summary, but the map is not visually uniform. Agriculture covers 84.21% of the county, while forest accounts for 8.69% and developed land 6.89%. Broad farm blocks dominate the west and much of the interior, while branching forest belts become much more noticeable toward the eastern and southern parts of the county.
This page brings together four views of the same county: general land cover, forest and farmland, fractional impervious surface, and mapped class differences from 1985 to 2025. The WebP versions can be read on the page, and the four original JPG maps are bundled in one ZIP download. Land cover describes what satellite-based classification detects on the ground surface; it does not establish zoning, parcel ownership, legal land use, or development rights.
Table of Contents
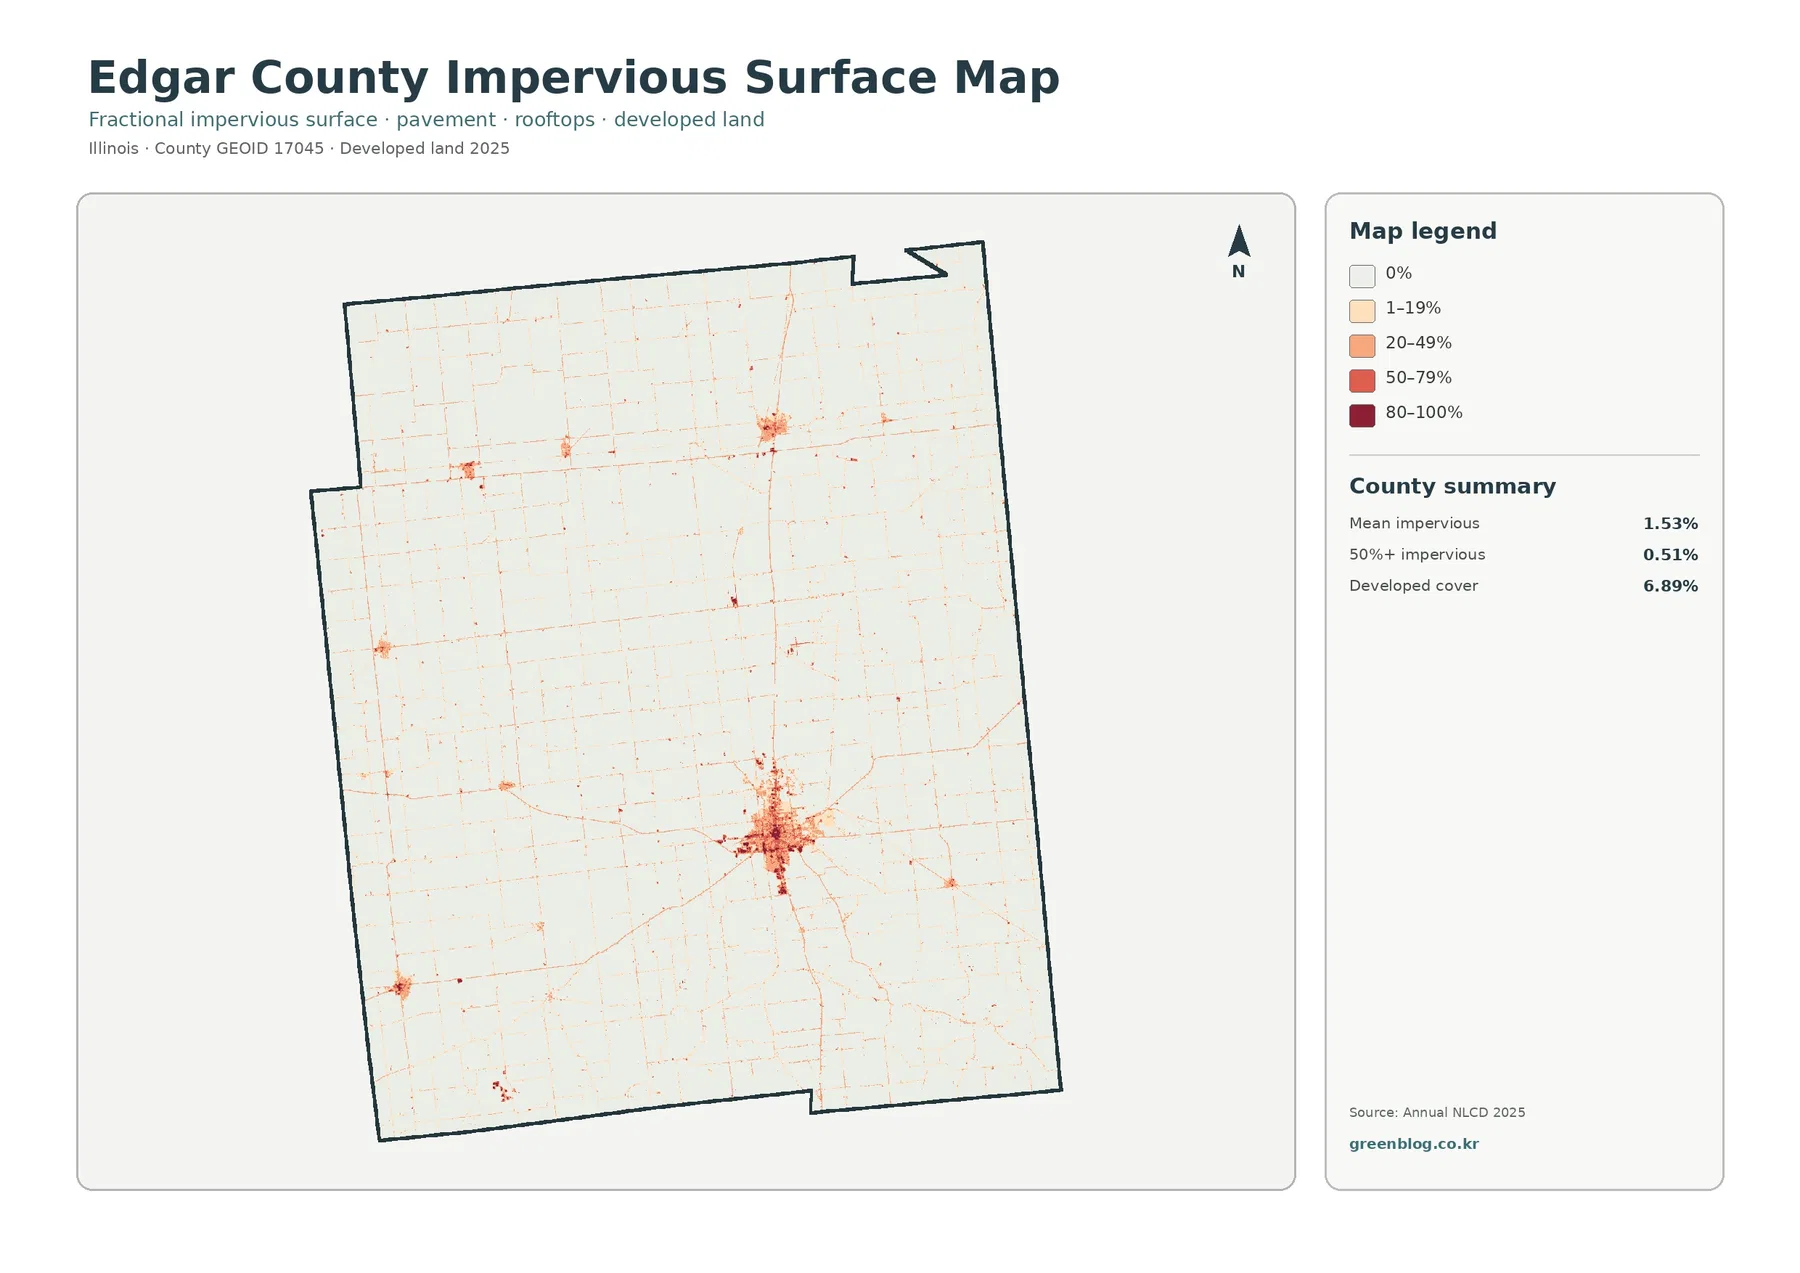
The 2025 map is mostly farm cover, but the eastern half has a different texture
The county summary begins with agriculture at 84.21%. Forest is the next largest natural class at 8.69%, followed by developed land at 6.89%. Water occupies 0.13% and wetlands 0.06%. Those small water and wetland shares are difficult to appreciate from percentages alone because they occur in narrow or scattered places rather than as a large lake or wetland block.
Most of the western side appears as a nearly continuous agricultural background interrupted by thin developed lines and small settlement clusters. Farther east, green forest cover becomes much more frequent and forms irregular branches through the farm matrix. The southern edge also contains a heavier concentration of forest than the broad northwestern farm area, so the county reads as more than a simple field grid.
Edgar County’s 2022 multi-jurisdictional hazard mitigation plan provides useful background for the mapped agricultural dominance. Citing the 2017 Census of Agriculture, the plan says farming practices occupied about 79.7% of county land at that time. That figure should not be substituted for the 2025 land-cover value of 84.21% because the two sources use different dates and definitions. Together they simply confirm that agriculture is a central part of the county landscape.
Impervious cover separates hard surfaces from the broader developed class
Developed land and impervious surface answer different questions. The developed class can include low-intensity places where buildings, roads, lawns, and trees are mixed together. Impervious surface focuses on hard areas such as rooftops, pavement, and parking surfaces that allow little direct infiltration into the soil.
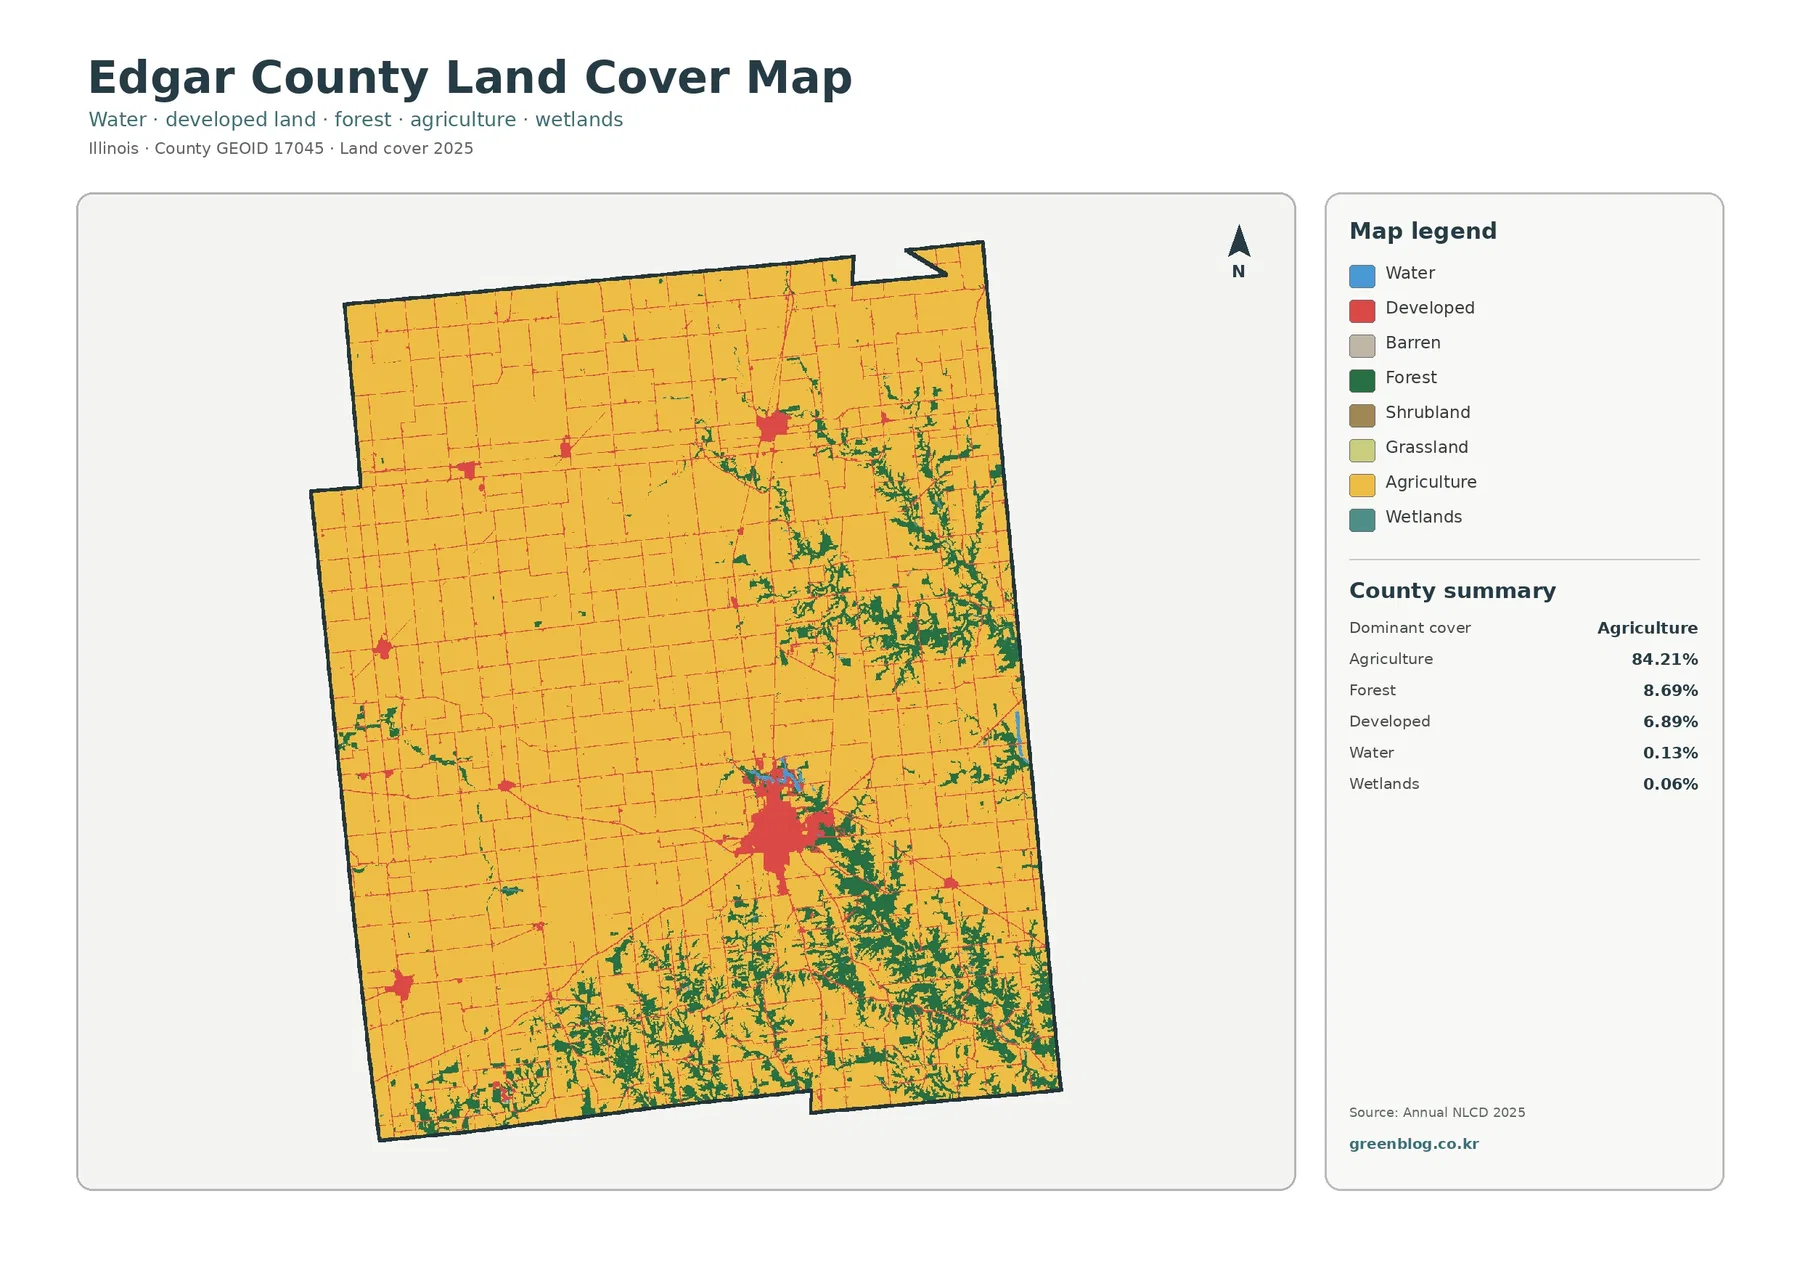
Edgar County has a mean impervious value of 1.53%, and only 0.51% of the county is mapped at 50% impervious or greater. Those values are much smaller than the 6.89% developed-cover share. The contrast is important: a place can be classified as developed without being covered mostly by pavement or rooftops.
The strongest impervious cluster appears in the same broad south-central area that stands out as developed on the general land-cover map. Smaller high-value spots occur farther north and west, while thin low-value lines cross the agricultural background. Across most farm country the map remains very light, showing that hard surfaces are concentrated rather than spread evenly across the county.
The forest-and-farmland view makes the branching green network easier to follow
The forest-and-farmland map removes much of the visual competition from developed and other classes. Cropland becomes the broad yellow field background, while forest is emphasized in green. This simplified view makes the east-west contrast clearer: large agricultural areas dominate the west, while forest forms more frequent branches and patches in the east and along parts of the south.
The branching form of the forest is worth noticing. Instead of one large forest block, many green areas are long, irregular, and connected to smaller side branches. That shape is useful when comparing habitat continuity or natural cover within a heavily farmed landscape. The map alone, however, does not identify each branch as a particular stream corridor, preserve, or ownership unit.
Class differences from 1985 to 2025 are limited in area but widely scattered
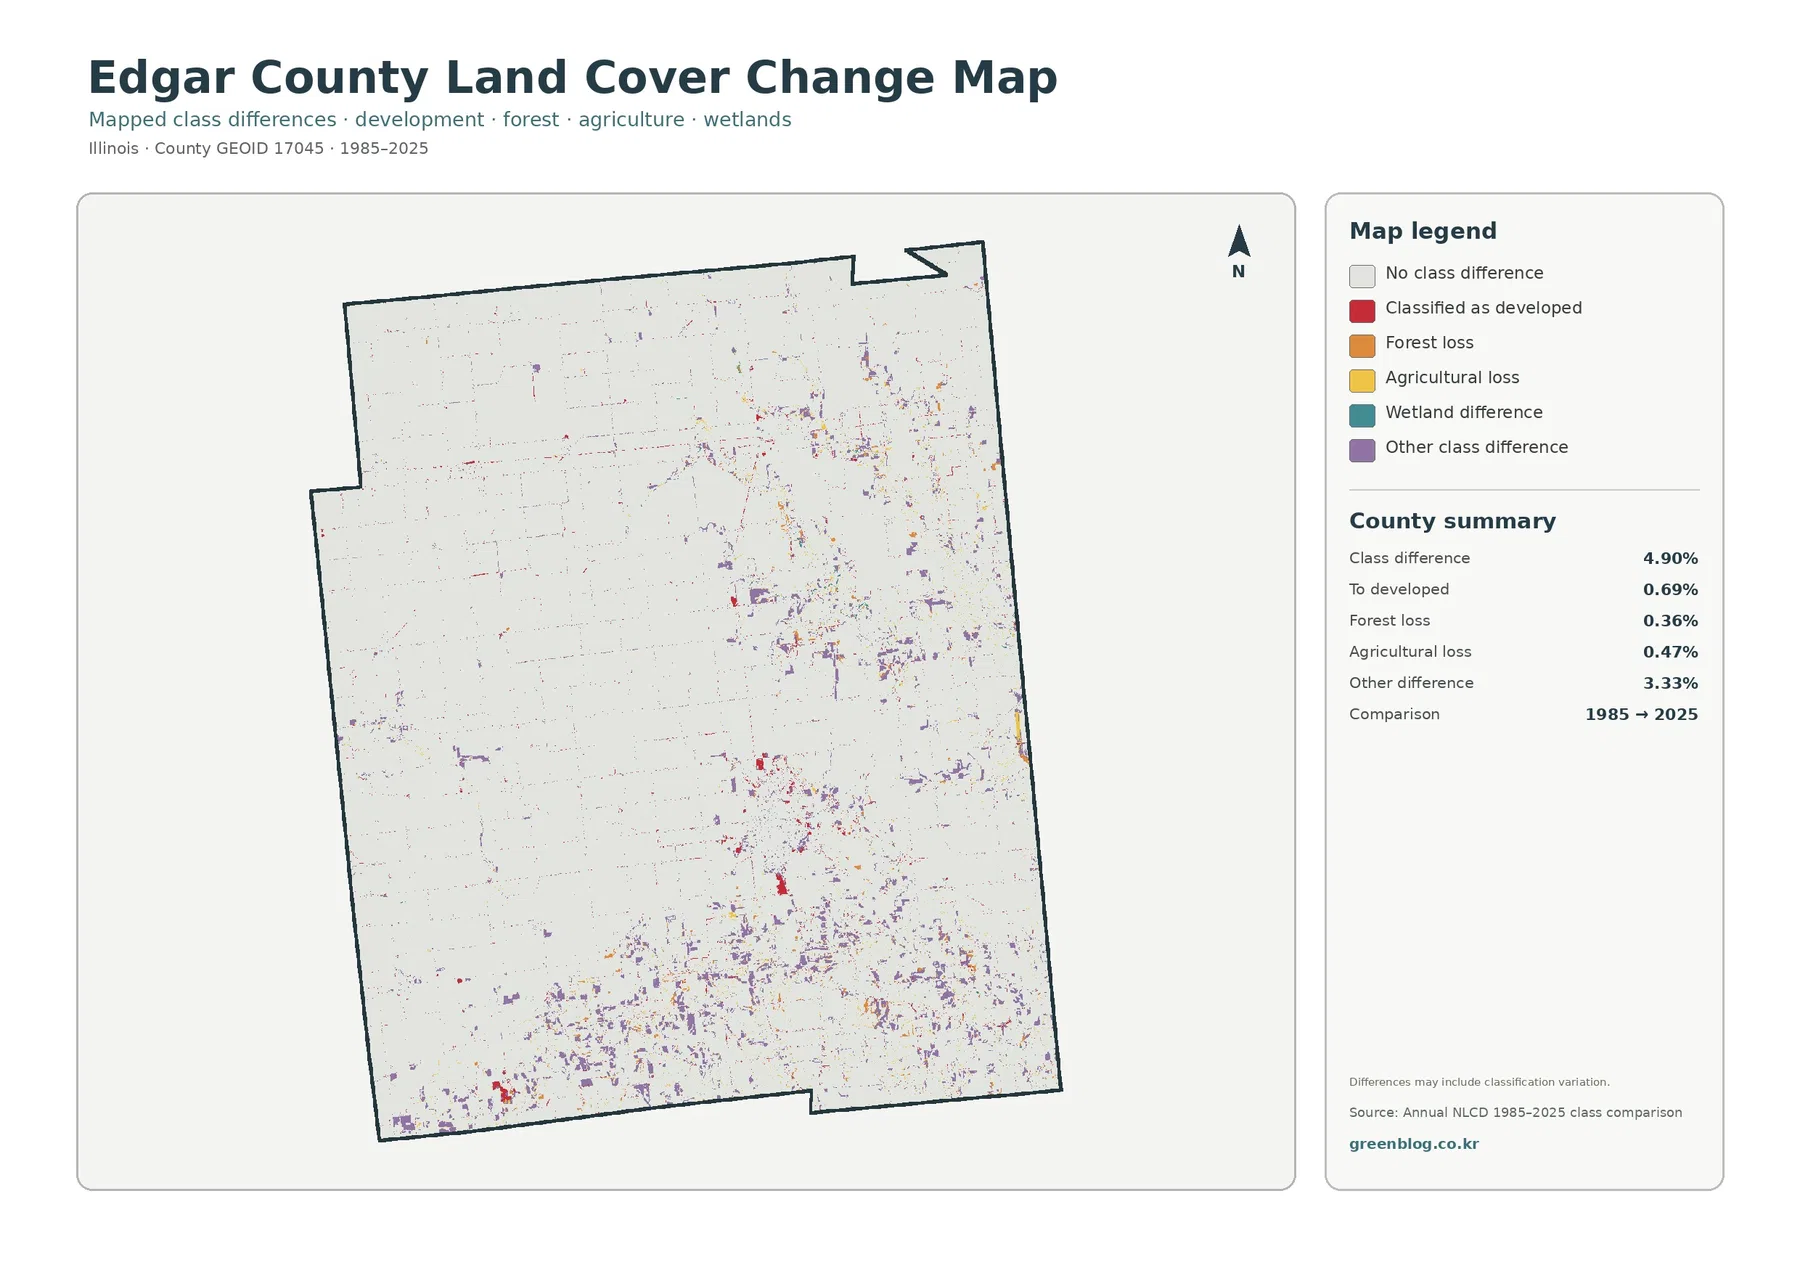
The change map compares the class assigned in 1985 with the class assigned in 2025. Overall class difference is 4.90% of the county. Areas classified as developed account for 0.69%, mapped forest loss 0.36%, agricultural loss 0.47%, and other class difference 3.33% in the summary.
The 4.90% figure is not a direct measure of total physical land-use conversion. The map itself notes that differences can include classification variation. Satellite imagery from different years can be affected by seasonal conditions, sensor differences, and classification methods, while mixed 30-meter cells near field, forest, and settlement edges can switch categories without a simple one-to-one land-use event.
Each map works best for a different kind of comparison
For a county overview, start with the general 2025 map. It communicates the 84.21% agricultural share immediately and still leaves enough detail to see the eastern and southern forest belts and the main developed cluster. This is usually the most useful image for a report cover, regional profile, or classroom introduction.
The original JPG maps in this package are 2480 by 1754 pixels and include the county outline, legend, and summary panel. Keeping the legend visible is important when the map is placed in a presentation or printed document. Very small reproductions can hide narrow forest strips and small change pixels, so a larger display is preferable when those details matter.
A 30-meter raster is useful at county scale, not as a parcel survey
Annual NLCD is a Landsat-based raster product with 30-meter cells. A raster divides the ground into a regular grid and assigns a representative value to each cell. Small roads, narrow streams, tree rows, lawns, buildings, and field edges can therefore be mixed inside one cell rather than drawn as precise vector boundaries.
Legal land use also requires separate records. A cell classified as agriculture does not mean that the parcel is zoned only for farming, and developed cover does not establish a right to build. Parcel ownership, assessment, zoning, permits, and exact boundaries must be checked with the appropriate Edgar County or municipal records.
Frequently Asked Questions
Does 84.21% agriculture mean exactly 84.21% of Edgar County is active farmland?
No. The 84.21% figure is the share classified as agricultural land cover in the 2025 Annual NLCD map. The county hazard plan cites a different 2017 farming-use estimate of about 79.7%. The dates, definitions, and methods differ, so the numbers should not be treated as the same measurement.
Where is forest most visible in the county maps?
The supplied maps show forest most clearly as branching belts and patches in the eastern and southern parts of Edgar County. The west and northwest are more continuously agricultural. The map does not provide forest ownership, preserve boundaries, or tree-species information.
Should every 1985–2025 change pixel be treated as a confirmed land conversion?
No. The map reports 4.90% overall class difference and notes that classification variation can be included. A cluster is a useful place to investigate with historical imagery or a time series, but one changed pixel does not by itself confirm a specific development, clearing, or agricultural event.
Map File Information
The ZIP contains the four original JPG maps for Edgar County: 2025 land cover, forest and farmland, impervious surface/developed land, and the 1985–2025 land-cover class comparison.
- Included Versions: land cover, forest and farmland, impervious/developed land, and 1985–2025 land-cover change
- File Type: ZIP containing four 2480×1754 JPG files
- Intended Use: presentations, classroom work, printed references, agriculture–forest comparison, built-surface comparison, and change screening
Related Maps
- Adams County Illinois Land Cover Map
- Alexander County Illinois Land Cover Map
- Bond County Illinois Land Cover Map
Sources and references
- MRLC Annual NLCD Data – official access to Annual NLCD land-cover datasets.
- USGS Annual NLCD Land Cover Classification – class definitions and interpretation guidance for Annual NLCD.
- U.S. Census Bureau TIGER/Line Shapefiles – official geographic boundary data used for county identification.
- Edgar County official About page – county cities, villages, highways, and local background.
- Edgar County Highway Department – county size and roadway-management information.
- Edgar County Multi-Jurisdictional All Hazards Mitigation Plan – county background including agriculture and development context.
Green Map creates custom-edited map images using open geographic data sources such as geoBoundaries, Natural Earth, OpenStreetMap, and government open data.
These maps are edited visual materials, not raw data files, and are provided for education, documents, presentations, and graphic reference.