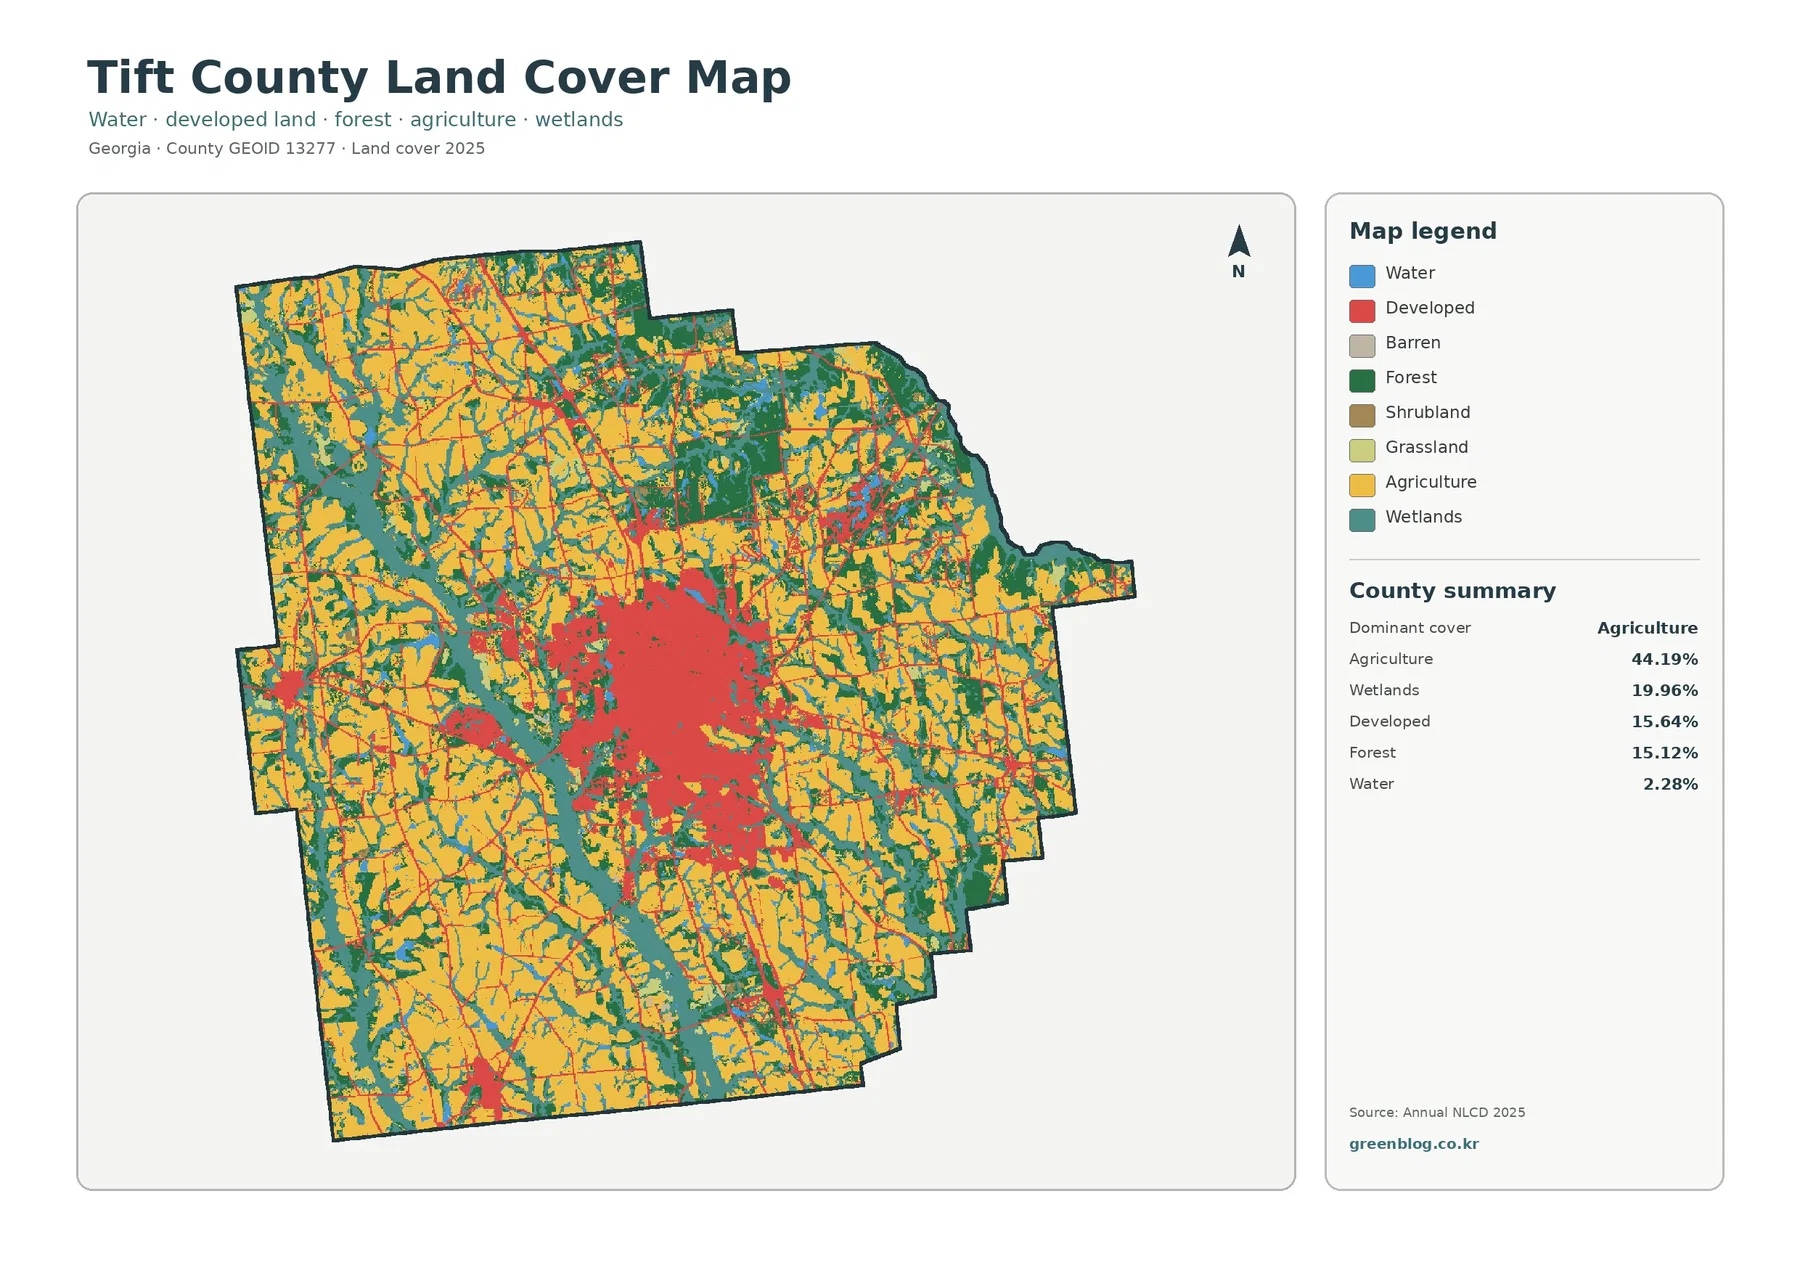
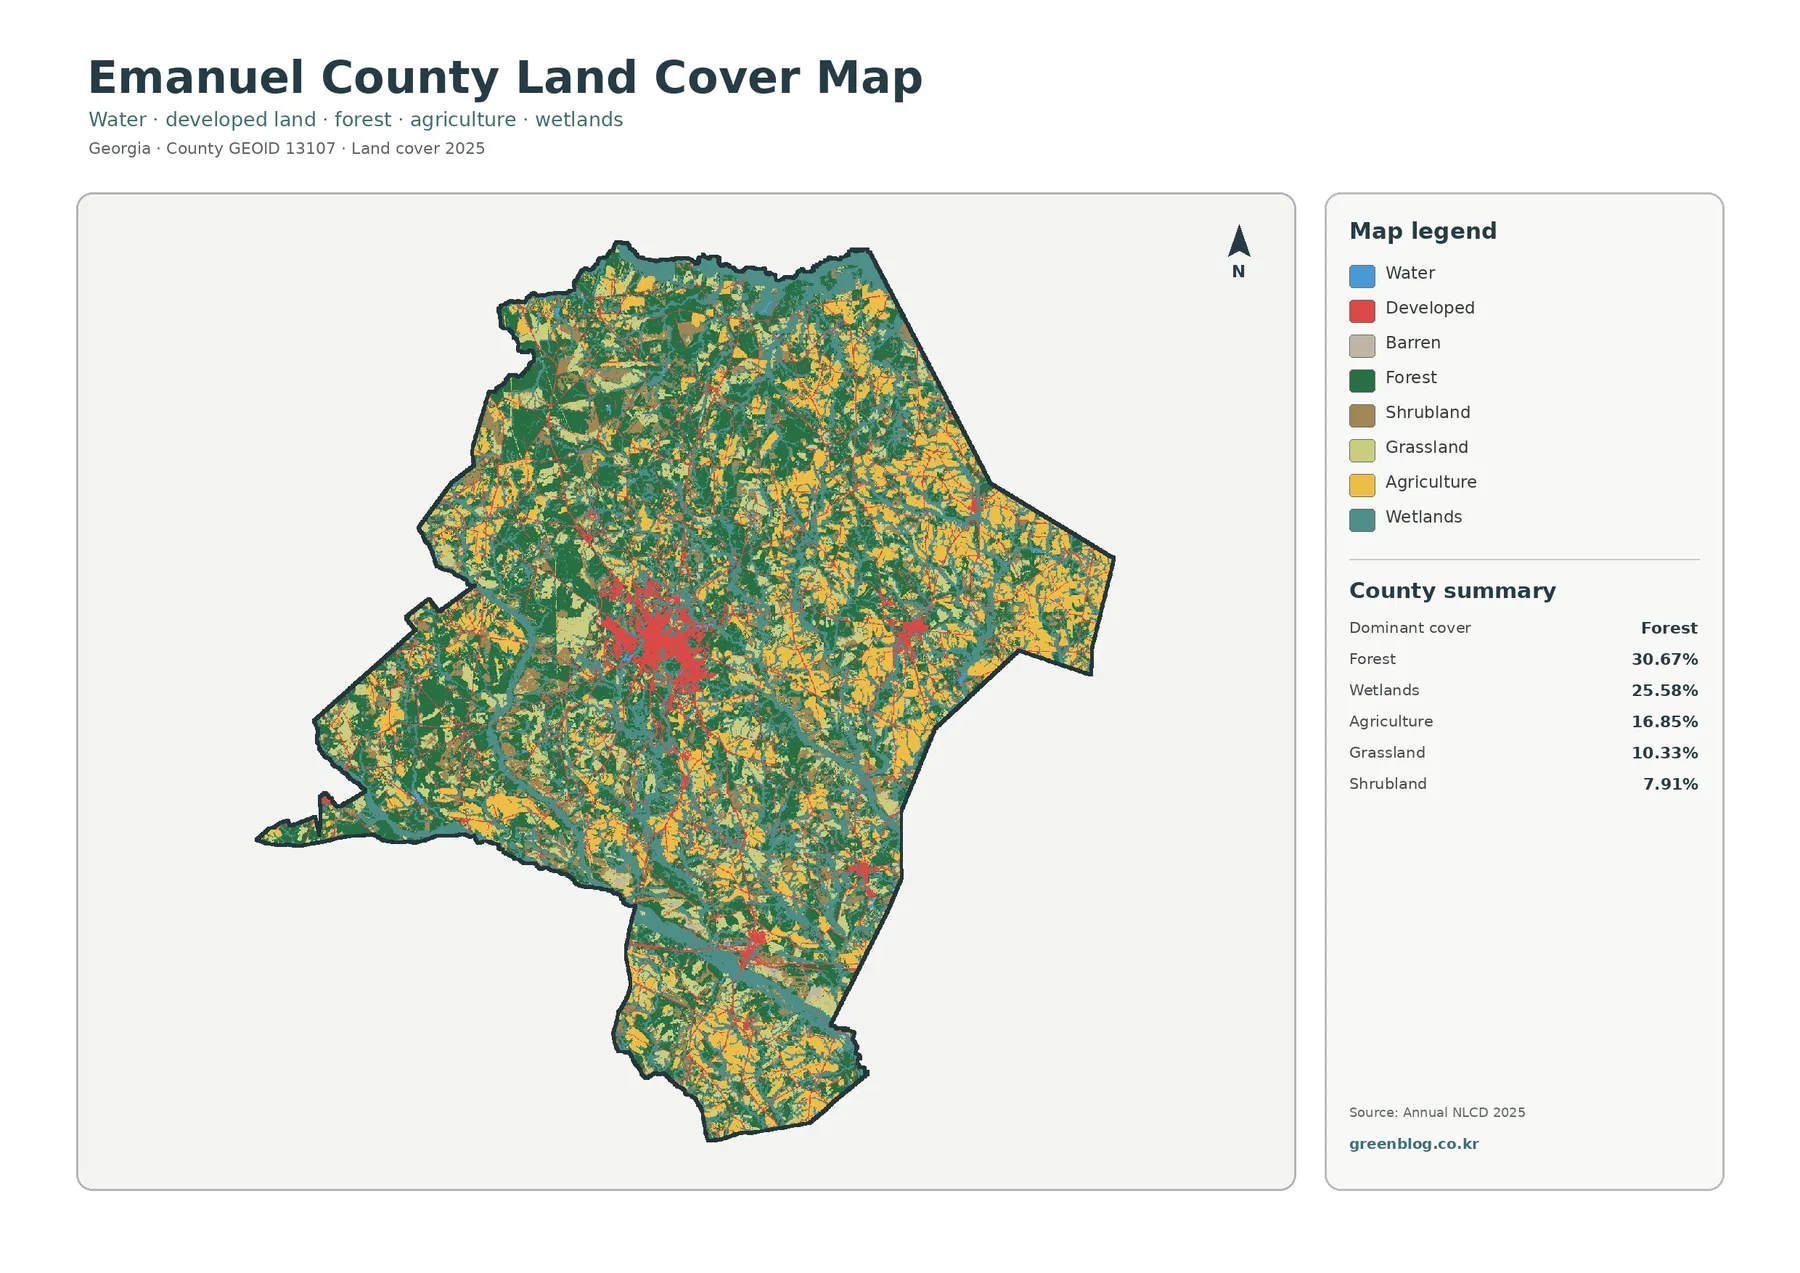
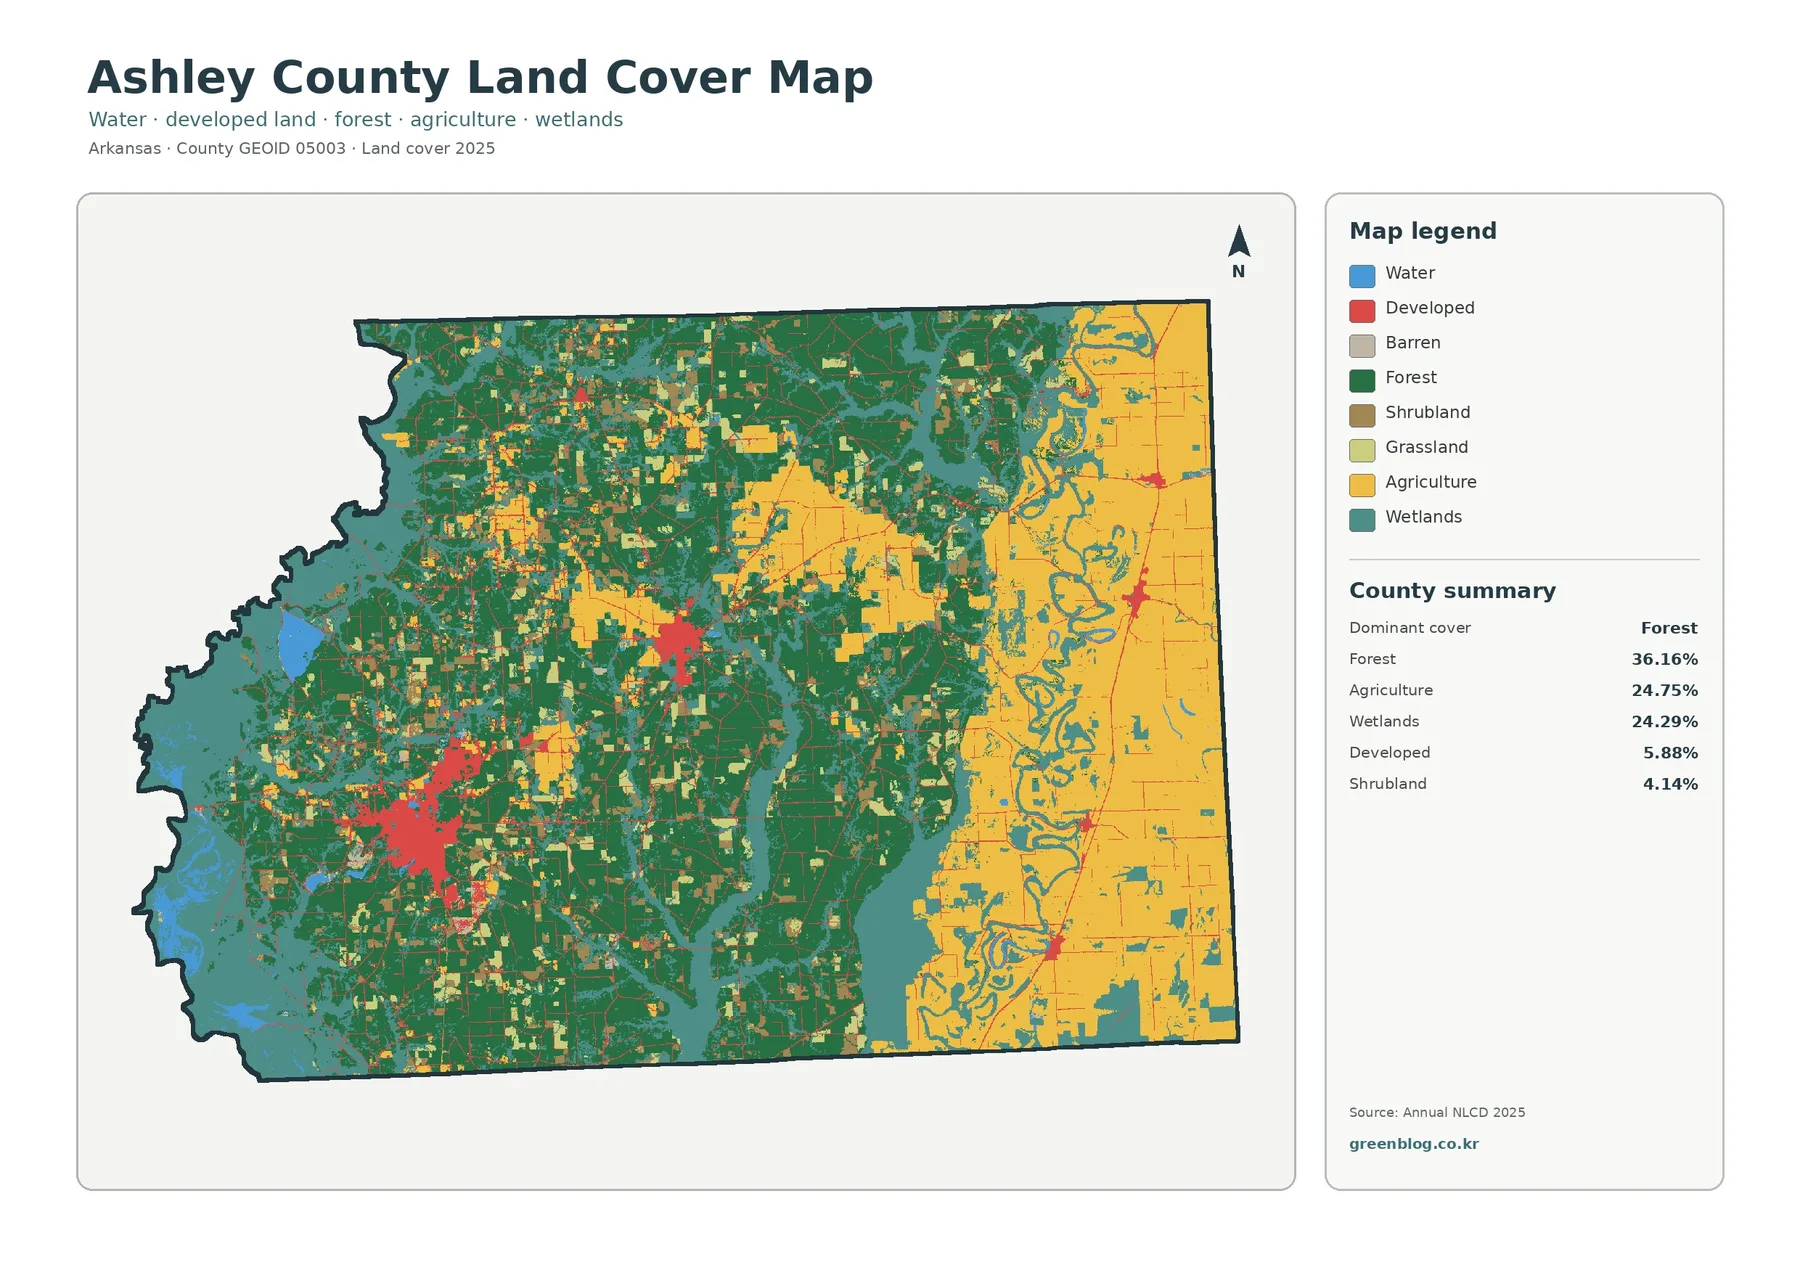
Douglas County, Illinois is overwhelmingly agricultural in the 2025 land-cover map, but the county is not a featureless block of cropland. Agriculture accounts for 88.03% of the mapped area, while compact developed clusters and thin, winding strips of forest and wetlands interrupt the farm grid. This page brings together four views: general land cover, forest and farmland, impervious surface, and mapped class differences between 1985 and 2025.
The WebP maps can be viewed in the article, and the four original JPG maps are available together in one ZIP download. The set is useful when you want to compare broad land-cover composition, isolate natural cover within an agricultural landscape, see where paved and built surfaces are concentrated, or examine where the two comparison years received different map classes. Land cover describes the physical surface seen in the dataset; it is not the same thing as zoning, ownership, parcel boundaries, or legal land use.
Table of Contents
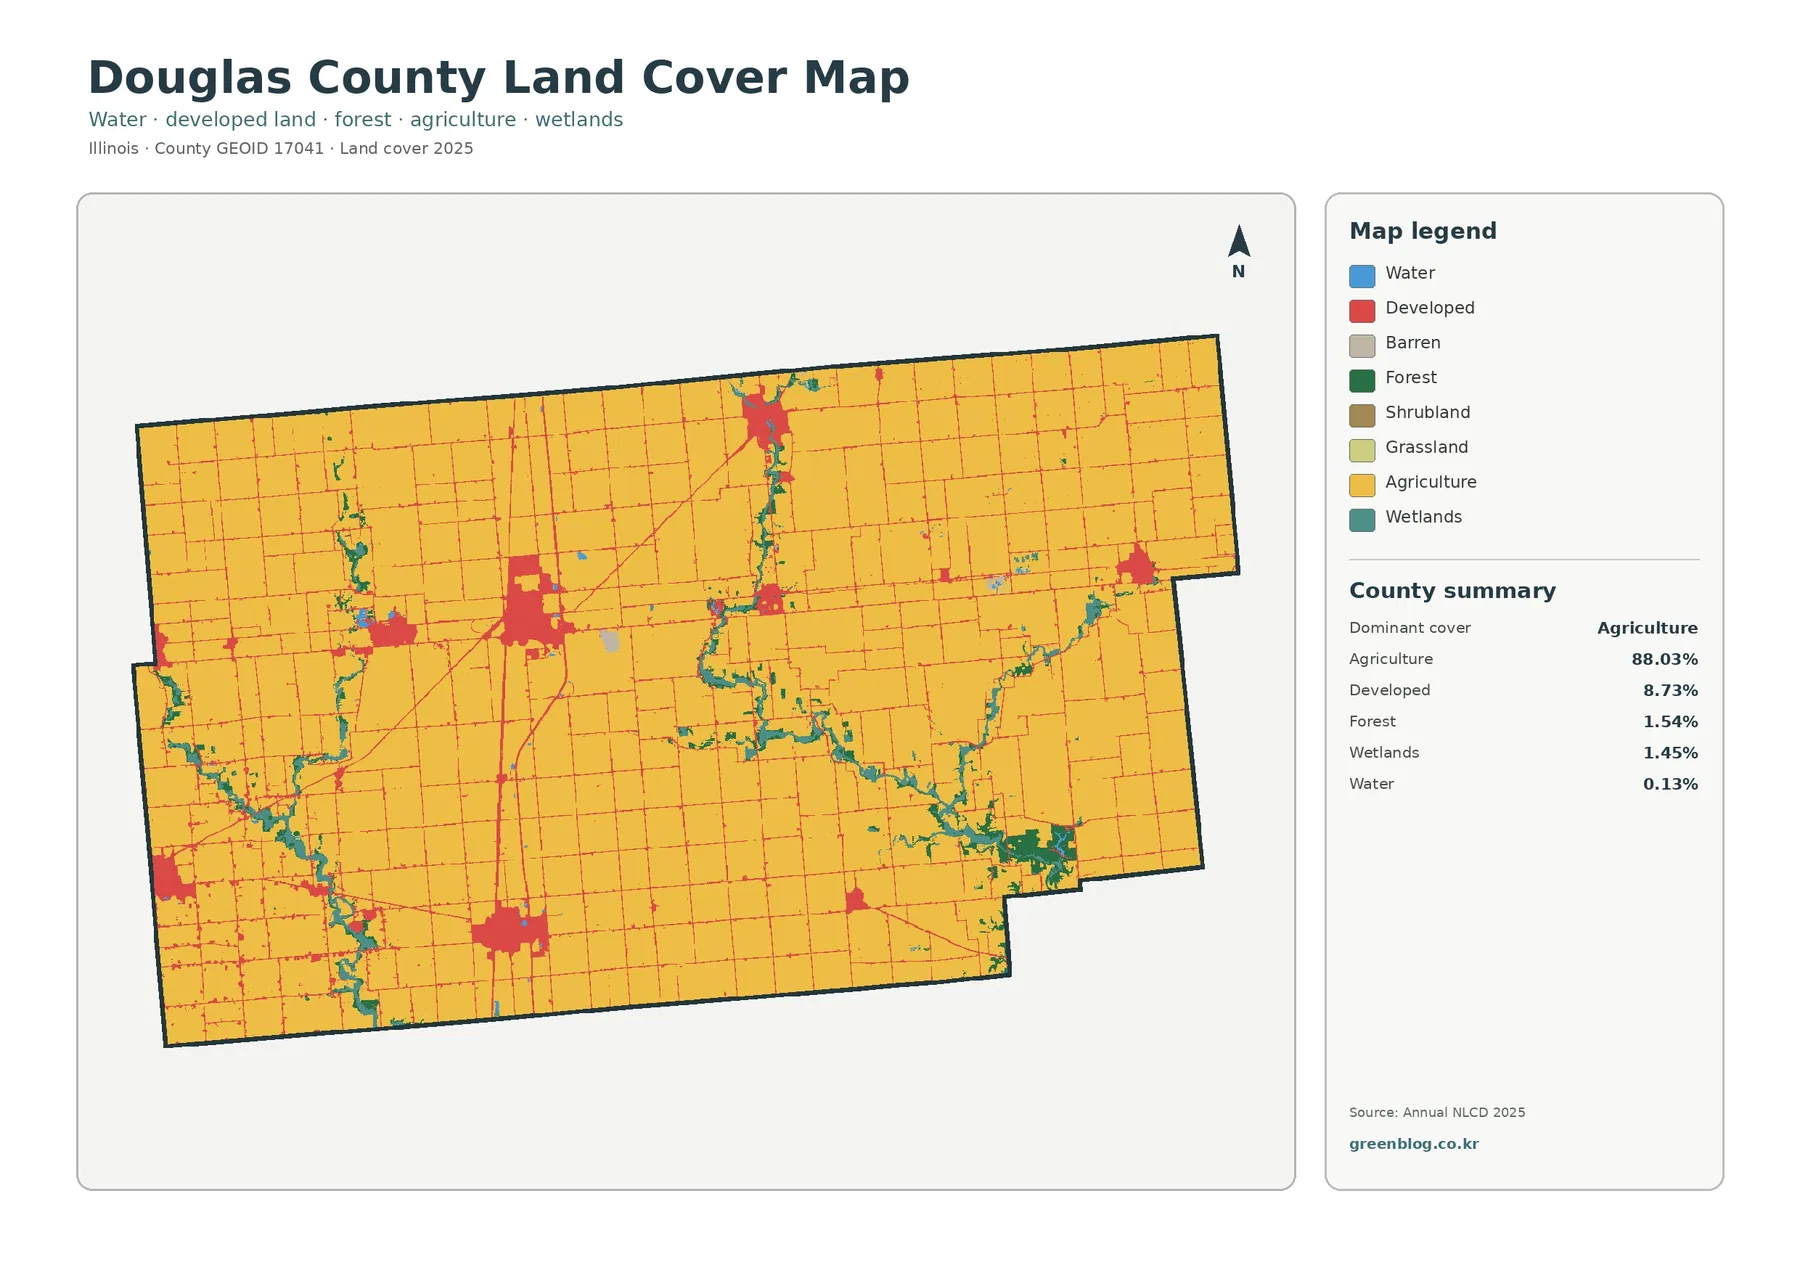
Agriculture fills 88.03% of the mapped county
The general land-cover view is dominated by the agriculture class. The 2025 summary lists 88.03% agriculture, 8.73% developed cover, 1.54% forest, 1.45% wetlands, and 0.13% water. Because cropland covers such a large share, the other classes stand out as small interruptions rather than broad competing landscapes. Forest and wetlands each occupy less than two percent of the county, yet their shapes are easy to trace because they contrast strongly with the large agricultural background.
Development is distributed in several separate clusters instead of forming one continuous urban mass. Larger red patches appear at multiple points across the county, with smaller built areas and road-like lines extending through the surrounding farmland. The result is a pattern of compact settlements embedded in a nearly continuous farm matrix. This is an important distinction: 8.73% developed cover is meaningful, but it does not erase the agricultural character of the county at map scale.
Douglas County’s official Highway page identifies Tuscola as the county seat and reports a land area of 413 square miles. That county page also lists state, county, township, and municipal highway mileage separately, providing useful local context for the dense rural road network that can be seen as fine linear features on the maps. The land-cover image itself does not label individual roads or every town, so the safest approach is to use the county GIS when a precise place name or parcel location is needed.
Natural cover follows narrow, irregular strips through the farm grid
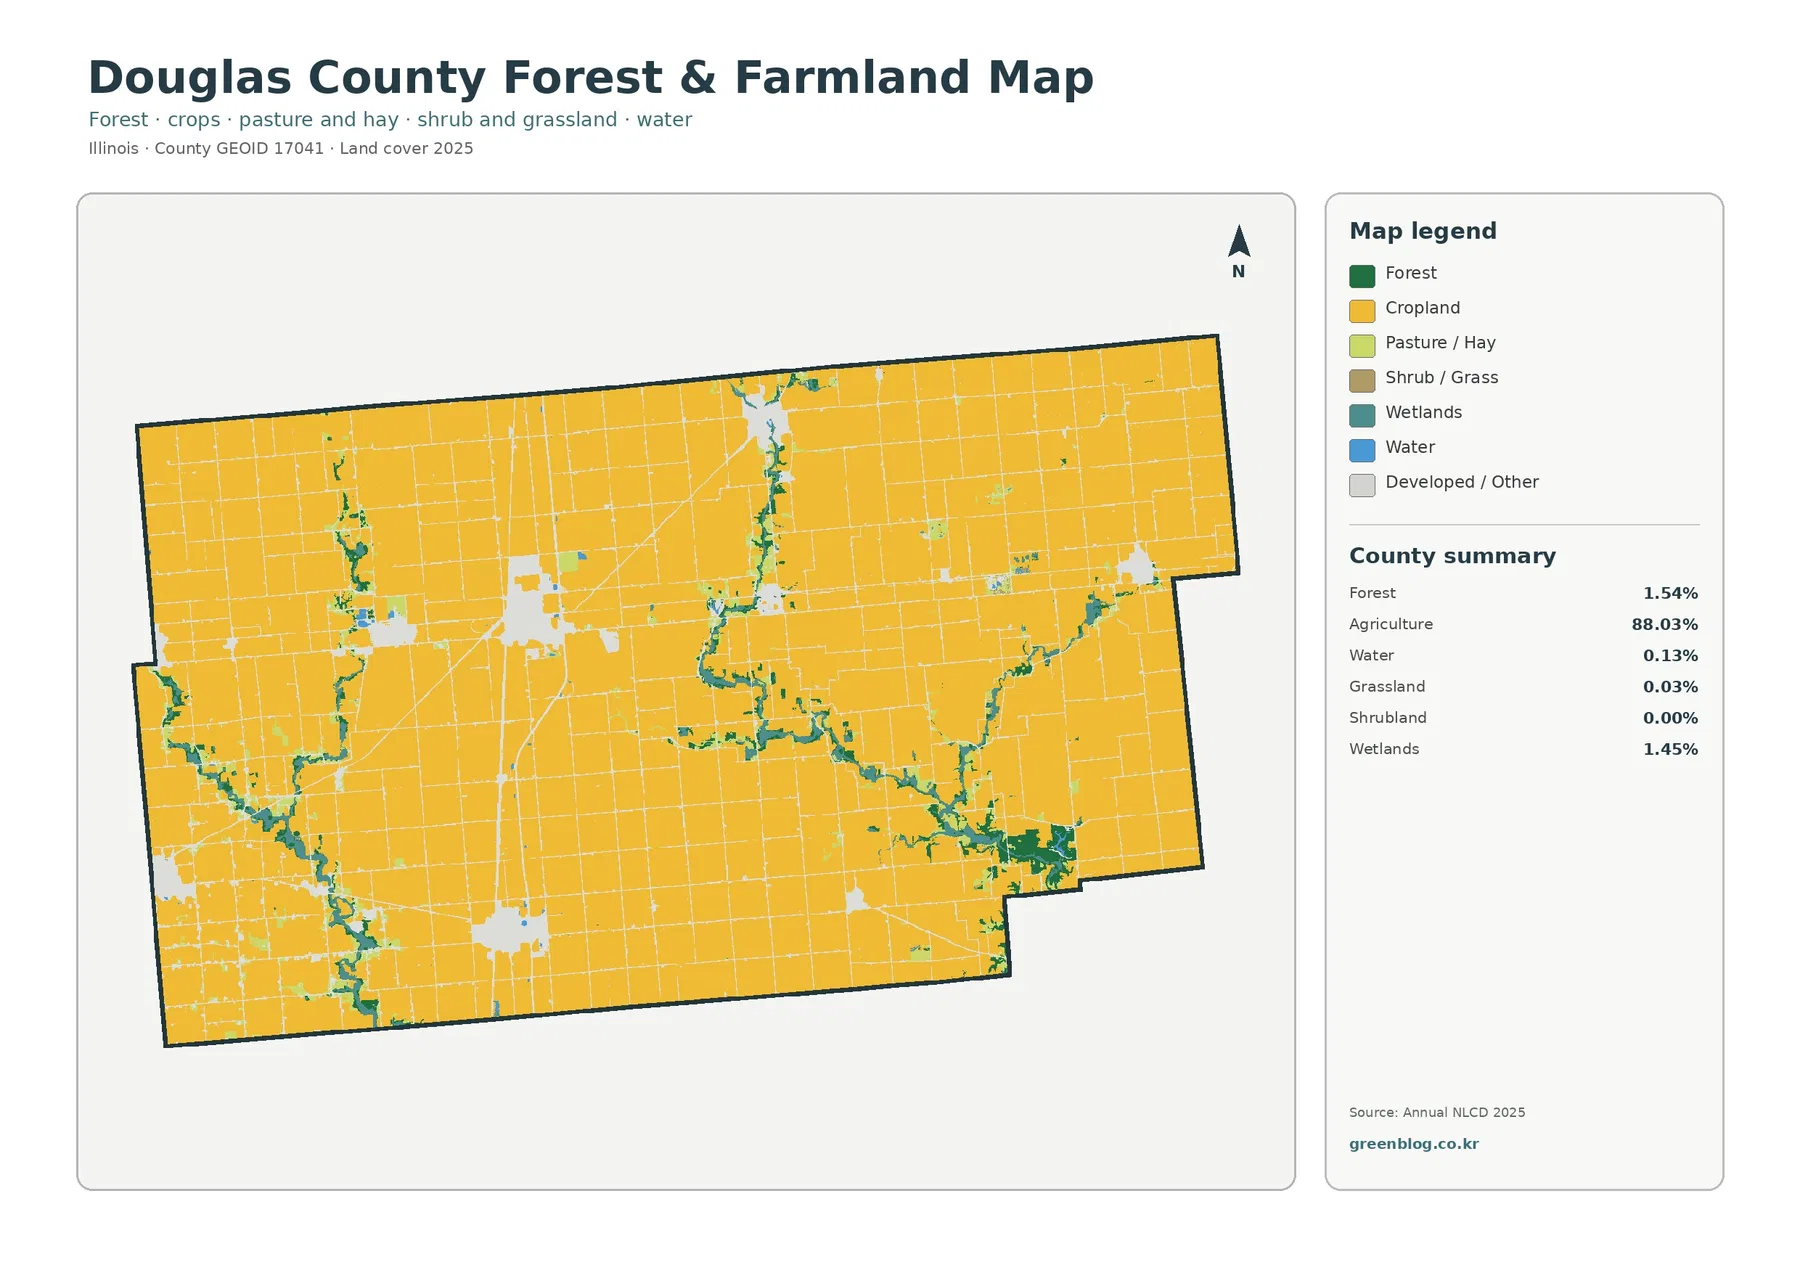
The forest-and-farmland version simplifies the developed and other classes so the contrast between agriculture and natural cover becomes easier to follow. Its summary repeats the 88.03% agricultural share and shows 1.54% forest, 1.45% wetlands, 0.13% water, and 0.03% grassland. Shrubland rounds to 0.00% in the county summary. Those numbers make clear that Douglas County is not a forest-dominated or grassland-dominated county; the more useful question is where the relatively small natural areas occur.
Forest and wetlands rarely form large blocks. Instead, they appear as branching and curving bands, especially toward the west and southwest and along a broad set of narrow paths through the central and southeastern parts of the county. Their geometry is very different from the straight-edged agricultural grid. The pattern is consistent with vegetation and wet areas associated with drainage corridors, but the map does not provide stream names, so it should not be used to assign every green or teal strip to a specific creek.
These narrow features matter even though their percentages are small. They show where the agricultural surface is interrupted by non-crop cover and help a reader compare the continuity of farmland with the continuity of natural areas. In some places forest and wetlands sit close together; elsewhere one class is more prominent. This view documents their mapped relationship, but it does not by itself establish habitat quality, water quality, ownership, or a protected status.
For classroom work, this view is especially useful because it reduces the visual weight of developed land and makes the remaining forest and wetland strips easier to discuss. A student can begin with the 88.03% agricultural background, then follow the irregular green and teal features across the county. That exercise demonstrates why a small percentage can still be geographically important when it is arranged in connected or semi-connected bands rather than isolated dots.
The developed class is broader than the most impervious surfaces
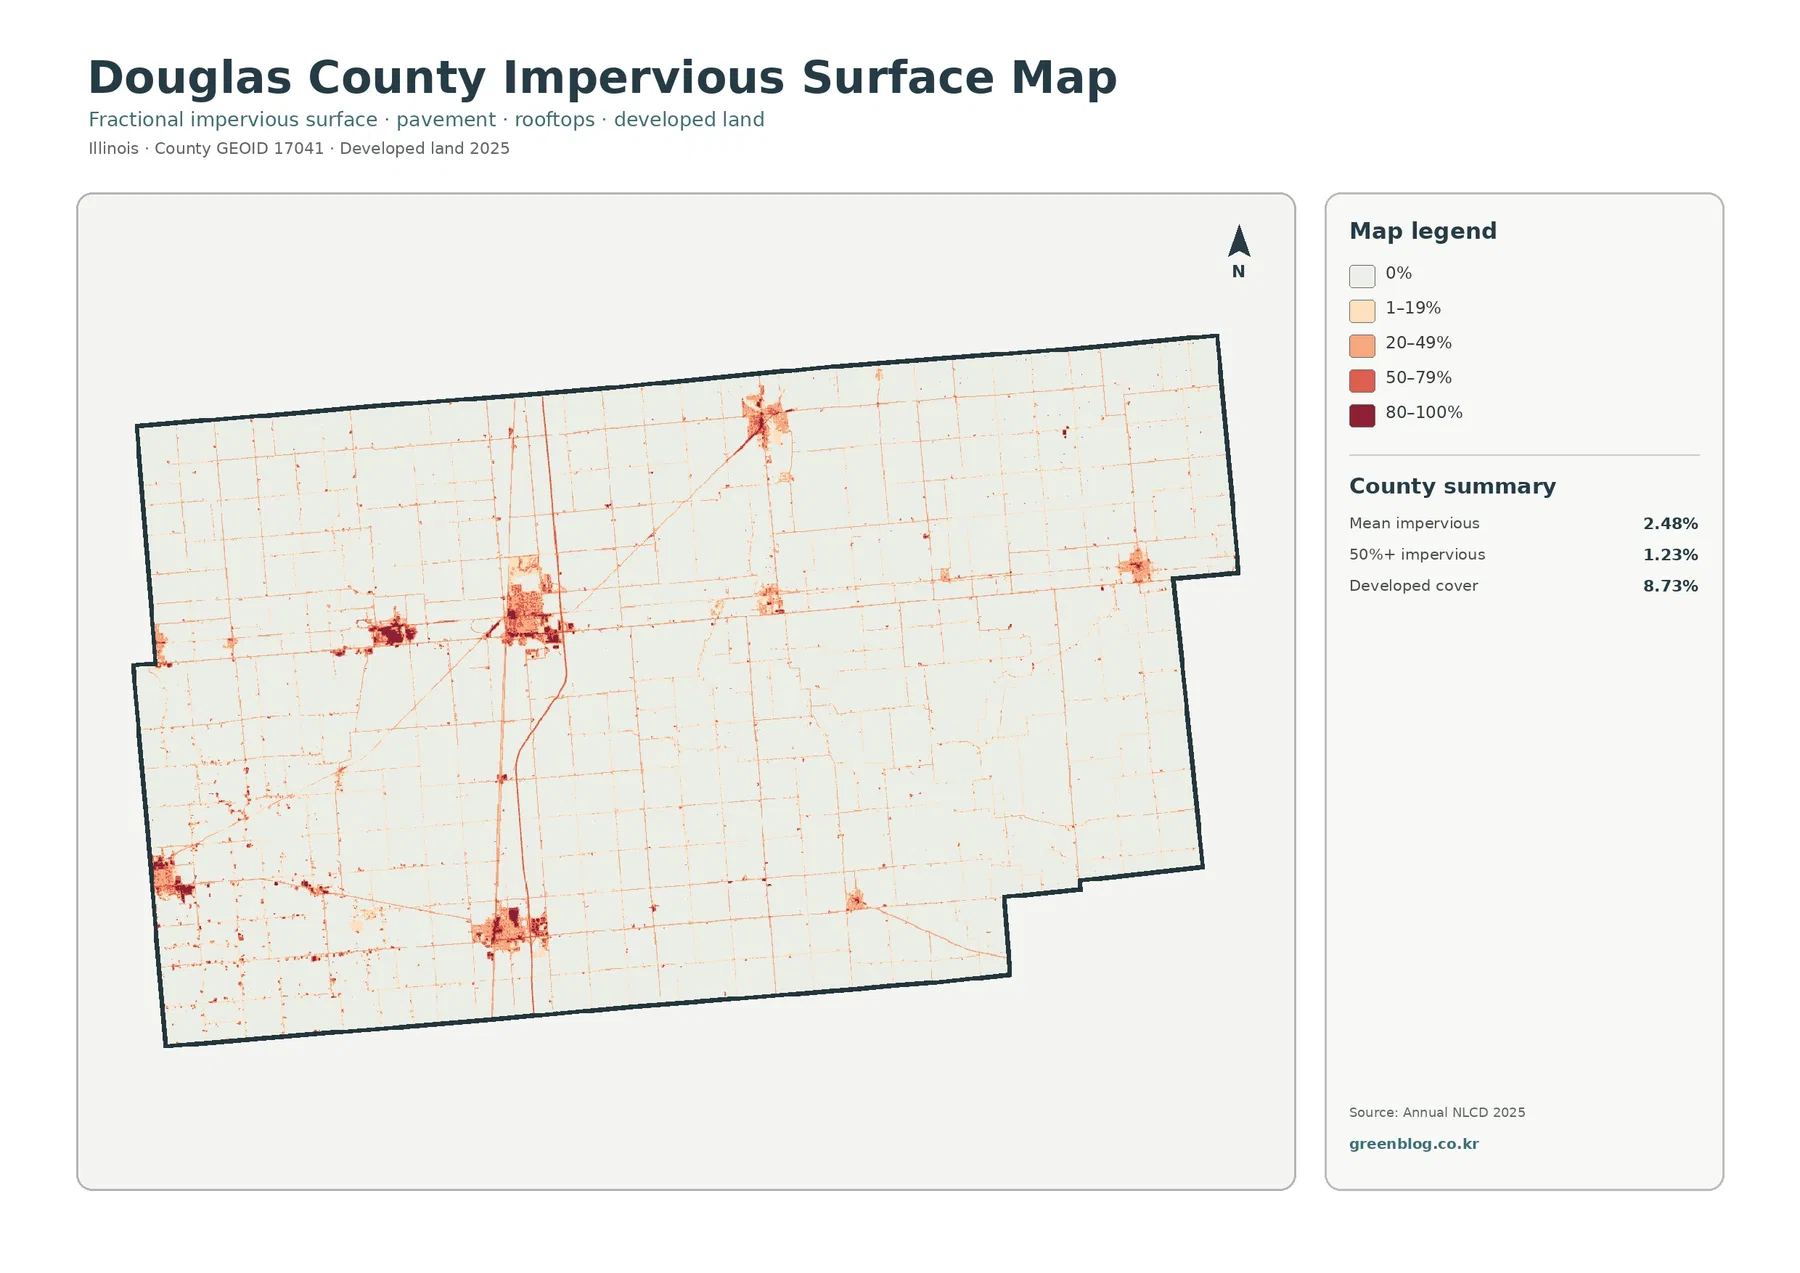
Impervious surface means pavement, rooftops, parking areas, and other surfaces that do not readily absorb water. Across the county, mean impervious cover is 2.48%, and only 1.23% of the area is summarized as having at least 50% impervious cover. Those figures are much smaller than the 8.73% developed land-cover share. The difference is expected because developed classes can contain lawns, trees, bare ground, and other permeable surfaces in addition to pavement and buildings.
The impervious map separates compact built centers from the agricultural road grid more clearly than the general land-cover map. Darker tones are concentrated in several settlement-sized patches, while thin pale-to-moderate lines spread across the countryside. This contrast is useful for seeing how a county can have a low average impervious percentage while still containing locally intense built surfaces. The agricultural acreage dominates the countywide average, but it does not eliminate high values inside developed centers.
Roads are also easier to notice here. They form a regular network of narrow lines through areas that otherwise have little impervious cover. In larger developed clusters, the road lines merge with broader paved and built surfaces, producing denser patches. As a result, this view gives a better sense of surface intensity than a simple developed-versus-undeveloped classification.
This view can support a discussion of runoff or the physical difference between town centers and agricultural surroundings, but it should not be treated as a flood-risk map. Impervious cover is only one factor affecting runoff. Soil, slope, drainage infrastructure, channel capacity, rainfall, and local topography also matter. Site-level questions are better answered with the county GIS and current aerial imagery alongside, rather than with this generalized county map alone.
The 1985–2025 comparison is mostly stable with scattered class differences
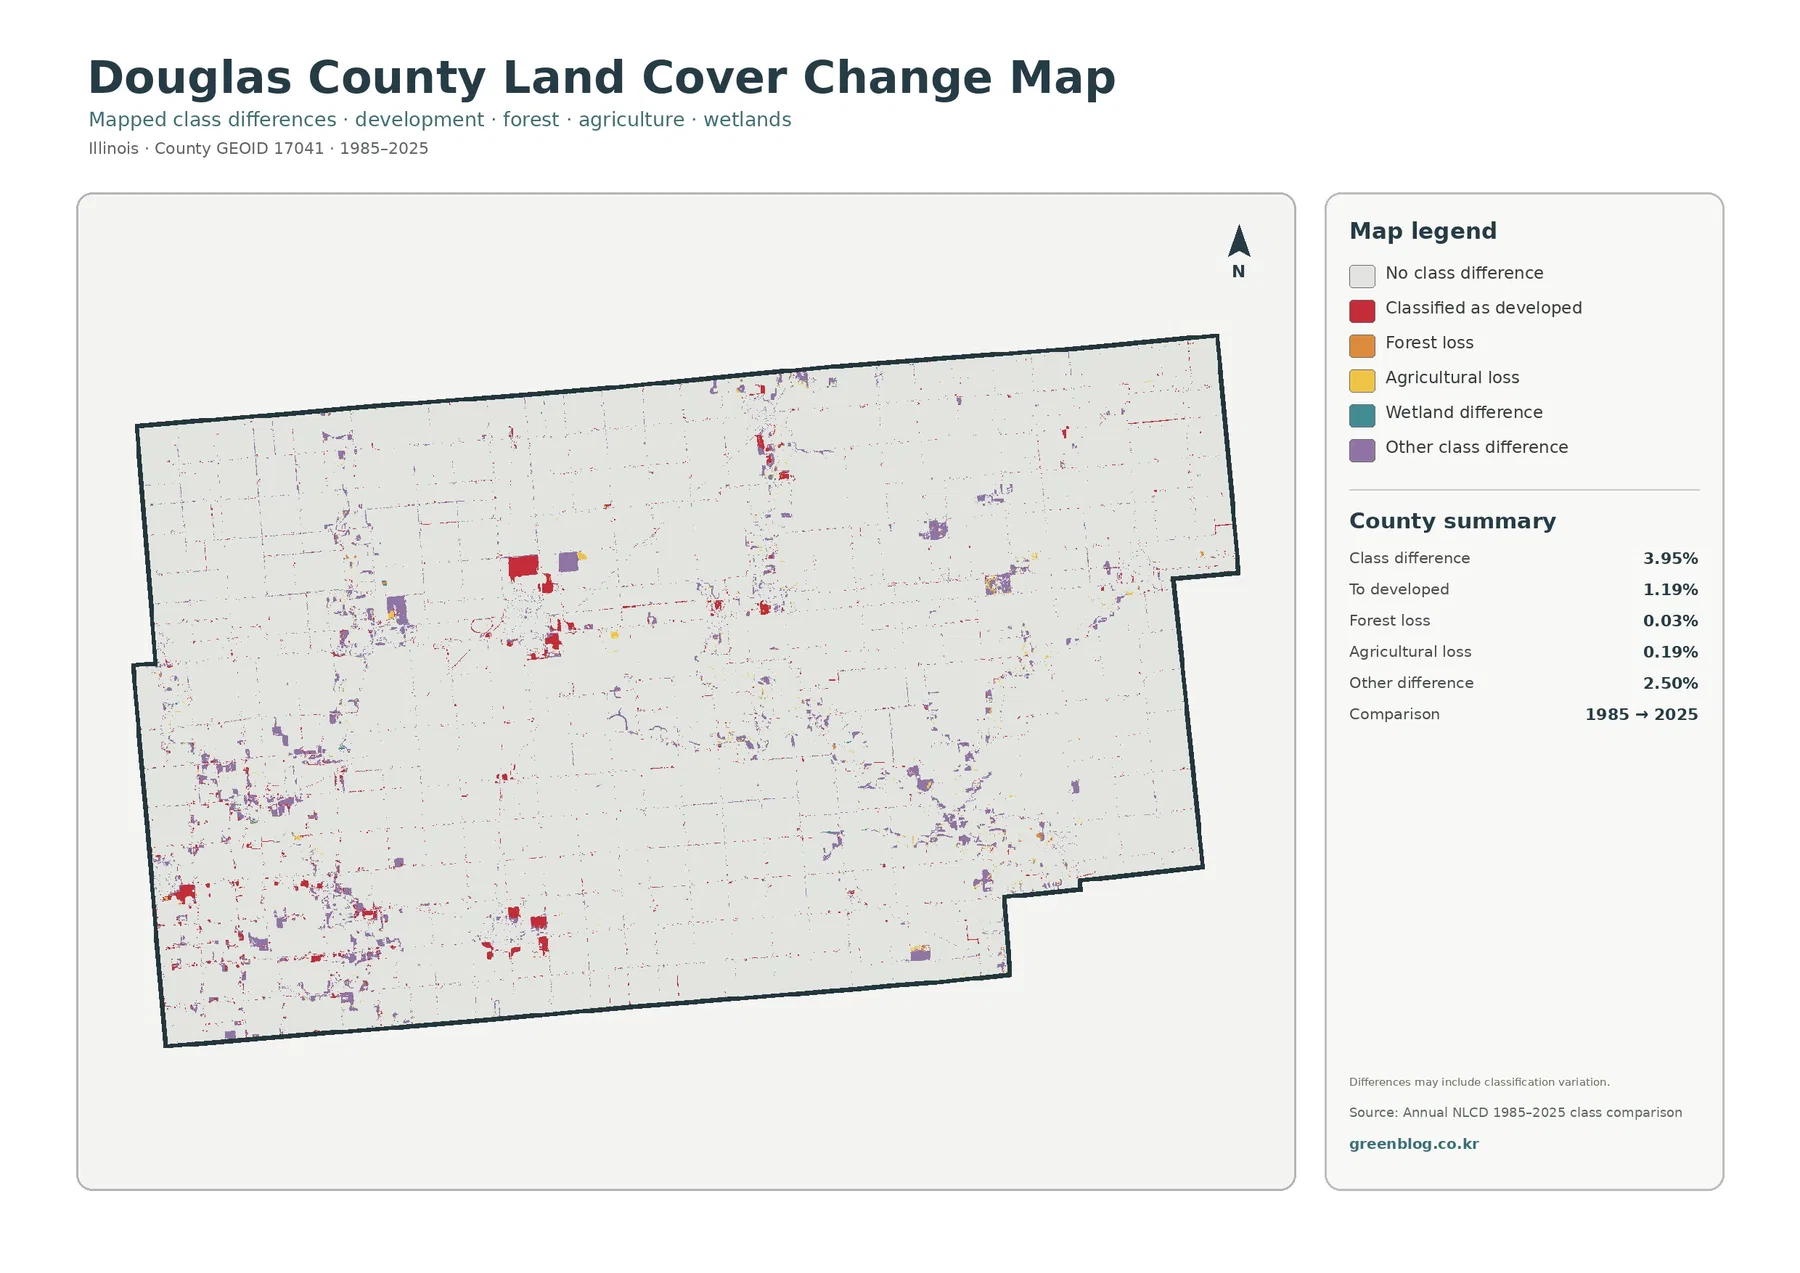
The change map compares the mapped class at each location in 1985 with the class shown for 2025. A total of 3.95% of the county is summarized as having a class difference. The breakdown includes 1.19% classified as a change to developed cover, 0.19% agricultural loss, 0.03% forest loss, and 2.50% in other class differences. Most of the county remains in the no-class-difference background.
Colored change patches are generally small and dispersed. Red areas associated with a change to developed cover appear around several places that also have stronger impervious signatures in the current map, but there is no single giant expansion patch. The visual impression is one of a largely persistent agricultural landscape with localized changes around developed areas and other scattered locations.
The 3.95% figure needs careful wording. A note on the change map warns that differences may include classification variation, so a colored pixel should not automatically be described as confirmed construction, clearing, wetland loss, or another specific event. The 2.50% other-difference category is especially important because it accounts for more than half of the total mapped difference. Large connected patches are usually more informative for broad comparison than isolated specks.
Similar caution is needed for the 0.19% agricultural-loss and 0.03% forest-loss summaries. These are differences between two mapped classifications, not a parcel history and not a year-by-year record of every transition. A location may have changed more than once during the forty-year interval. If a project requires the sequence of events rather than the endpoints, annual imagery or additional dated land-cover products should be consulted.
Use Tuscola and the county GIS as reference points, not as substitutes for land cover
The official Douglas County website places the county courthouse in Tuscola, and the Highway page also identifies Tuscola as the county seat. That information is useful when a reader wants to align this unlabeled land-cover image with a standard road or administrative map. The county also provides a GIS Mapping page, which is a better source for addresses, parcels, and precise local features than the generalized land-cover raster.
The two products answer different questions. The land-cover set is designed to show where agricultural, developed, forest, wetland, and water surfaces occur across the county. A parcel or zoning map is designed to show legal or administrative boundaries. Even when the outlines appear to line up visually, the land-cover classification should never be treated as evidence that a parcel is zoned for agriculture, permitted for development, or owned by a particular party.
This distinction is particularly important with the 88.03% agriculture figure. That percentage is not a measurement of legally designated farmland, not a count of farms, and not a statement about future development rights. Instead, it represents the portion of the 2025 Annual NLCD classification summarized as agricultural land cover. Legal and property questions belong in the county’s official records and GIS resources.
Choose the map according to the question you are asking
Start with the general land-cover map when the goal is to describe Douglas County in one image. It provides the clearest overview of the 88.03% agricultural background, the 8.73% developed share, and the smaller forest and wetland features. This general view is also the easiest version for introducing the county before moving to a more specialized map.
The forest-and-farmland map is better when you want to separate agricultural cover from natural strips without the developed class competing for attention. The impervious-surface map serves a different purpose: it distinguishes broad developed cover from the specific places where pavement and rooftops are concentrated. These two maps may cover the same geography, but they make different aspects of that geography easier to see.
Use the 1985–2025 map when the question is about differences between the two dates. It should normally be viewed beside the current land-cover map. A red change patch becomes more informative once you check whether the 2025 surface at that location is part of a larger developed cluster, while a purple other-difference patch should be interpreted more cautiously because the category can include classification variation.
Practical ways to use the four JPG maps
In a presentation, begin with the general map, move to the forest-and-farmland view, then show impervious surface, and finish with the time comparison. That order moves from broad composition to natural-cover detail, then to built-surface intensity, and finally to mapped differences. It helps keep current land cover separate from historical comparison instead of mixing the two ideas in one slide.
For comparison with another Illinois county, use the same measurements on both pages. A consistent county-to-county comparison can start with four Douglas County values: 88.03% agriculture, 8.73% developed cover, 2.48% mean impervious surface, and 3.95% mapped class difference from 1985 to 2025. Percentages are only part of the comparison, however. The shape of natural cover and whether development is concentrated in one place or scattered among several centers can be equally informative.
For printing, keep the legend and county boundary visible. The thin forest and wetland strips can disappear if the general map is reduced too far, and the rural road network on the impervious map may become hard to distinguish at small size. A larger print preserves the difference between narrow linear features and compact developed areas, which is one of the most useful aspects of this Douglas County set.
Remember the limits of a 30-meter raster classification
Annual NLCD is a raster land-cover dataset, meaning the landscape is divided into grid cells and each cell receives a classification. The commonly used cell size is 30 meters. A narrow ditch, small building, tree line, or parcel boundary may therefore be generalized, omitted, or combined with surrounding cover. A cell can also contain more than one real-world surface even though the map assigns a single class.
This limitation matters in Douglas County because many of the forest and wetland features are narrow. Their mapped width should not be treated as a surveyed boundary. Roads and the edges of developed clusters should be treated with the same care. These maps work best for countywide patterns, broad comparison, teaching, and presentation rather than measuring an individual property.
The 2025 map also represents a particular observation and classification period. Development or restoration that occurred later will not appear in it. Likewise, the 1985–2025 comparison does not describe every intermediate year. Current projects and site-specific decisions should use recent aerial imagery, field observations, and official Douglas County records alongside the land-cover maps.
Frequently Asked Questions
Does 88.03% agricultural cover mean that 88.03% of Douglas County is legally farmland?
No. The figure is the share classified as agricultural land cover in the 2025 Annual NLCD map. It does not define farm ownership, parcel boundaries, zoning, or development rights. Official Douglas County GIS and property or planning records should be used for legal or parcel-specific questions.
Why is developed cover 8.73% while mean impervious surface is only 2.48%?
Developed land-cover classes can include lawns, trees, bare ground, and other permeable surfaces around roads and buildings. Impervious surface measures the share covered by pavement, rooftops, and similar hard surfaces, so the countywide mean can be much lower than the developed-class share.
Is the entire 3.95% mapped difference from 1985 to 2025 confirmed real-world land change?
No. It is the share where the two mapped classifications differ. The summary includes 1.19% change to developed cover, 0.19% agricultural loss, 0.03% forest loss, and 2.50% other class differences. The map also warns that classification variation can contribute to the result.
Sources and reference material
- MRLC Annual NLCD Data – official access point for Annual NLCD land-cover products.
- USGS Annual NLCD Land Cover Classification – definitions for agricultural, developed, forest, wetland, and other map classes.
- Official county Highway page – official local information on the county seat, land area, and road mileage.
- Official county GIS Mapping page – county GIS access for more specific local and parcel-oriented reference.
- U.S. Census Bureau TIGER/Line Shapefiles – official source for county boundary data.
Map File Information
Download the map files associated with this page for reference, printing, and compatible visual projects.
- Included Files: Use only the versions confirmed in the article and supplied images
- File Type: Use the confirmed download contents
- Intended Use: Printing, education, presentations, and map-based projects
Related Maps
Green Map creates custom-edited map images using open geographic data sources such as geoBoundaries, Natural Earth, OpenStreetMap, and government open data.
These maps are edited visual materials, not raw data files, and are provided for education, documents, presentations, and graphic reference.