De Witt County, Illinois is overwhelmingly agricultural on the 2025 land-cover map, but the county is not visually uniform. Cropland and other agricultural cover account for 83.72% of the mapped area, while the branching shape of Clinton Lake and the wooded land around its shoreline create the clearest break in the farm-dominated pattern. Four views on this page separate general land cover, forest and farmland, impervious surfaces, and mapped class differences between 1985 and 2025.
The four original JPG maps are available together in one ZIP farther down the page. They can be used to compare the broad agricultural landscape with the developed centers of Clinton and Farmer City, isolate the wooded corridors around the lake and drainage lines, or locate areas where the two mapped years do not carry the same land-cover class. Land cover describes what is physically covering the ground; it is not a zoning, ownership, or parcel-use map.
Table of Contents
A farm-dominated county with one large water-and-forest complex
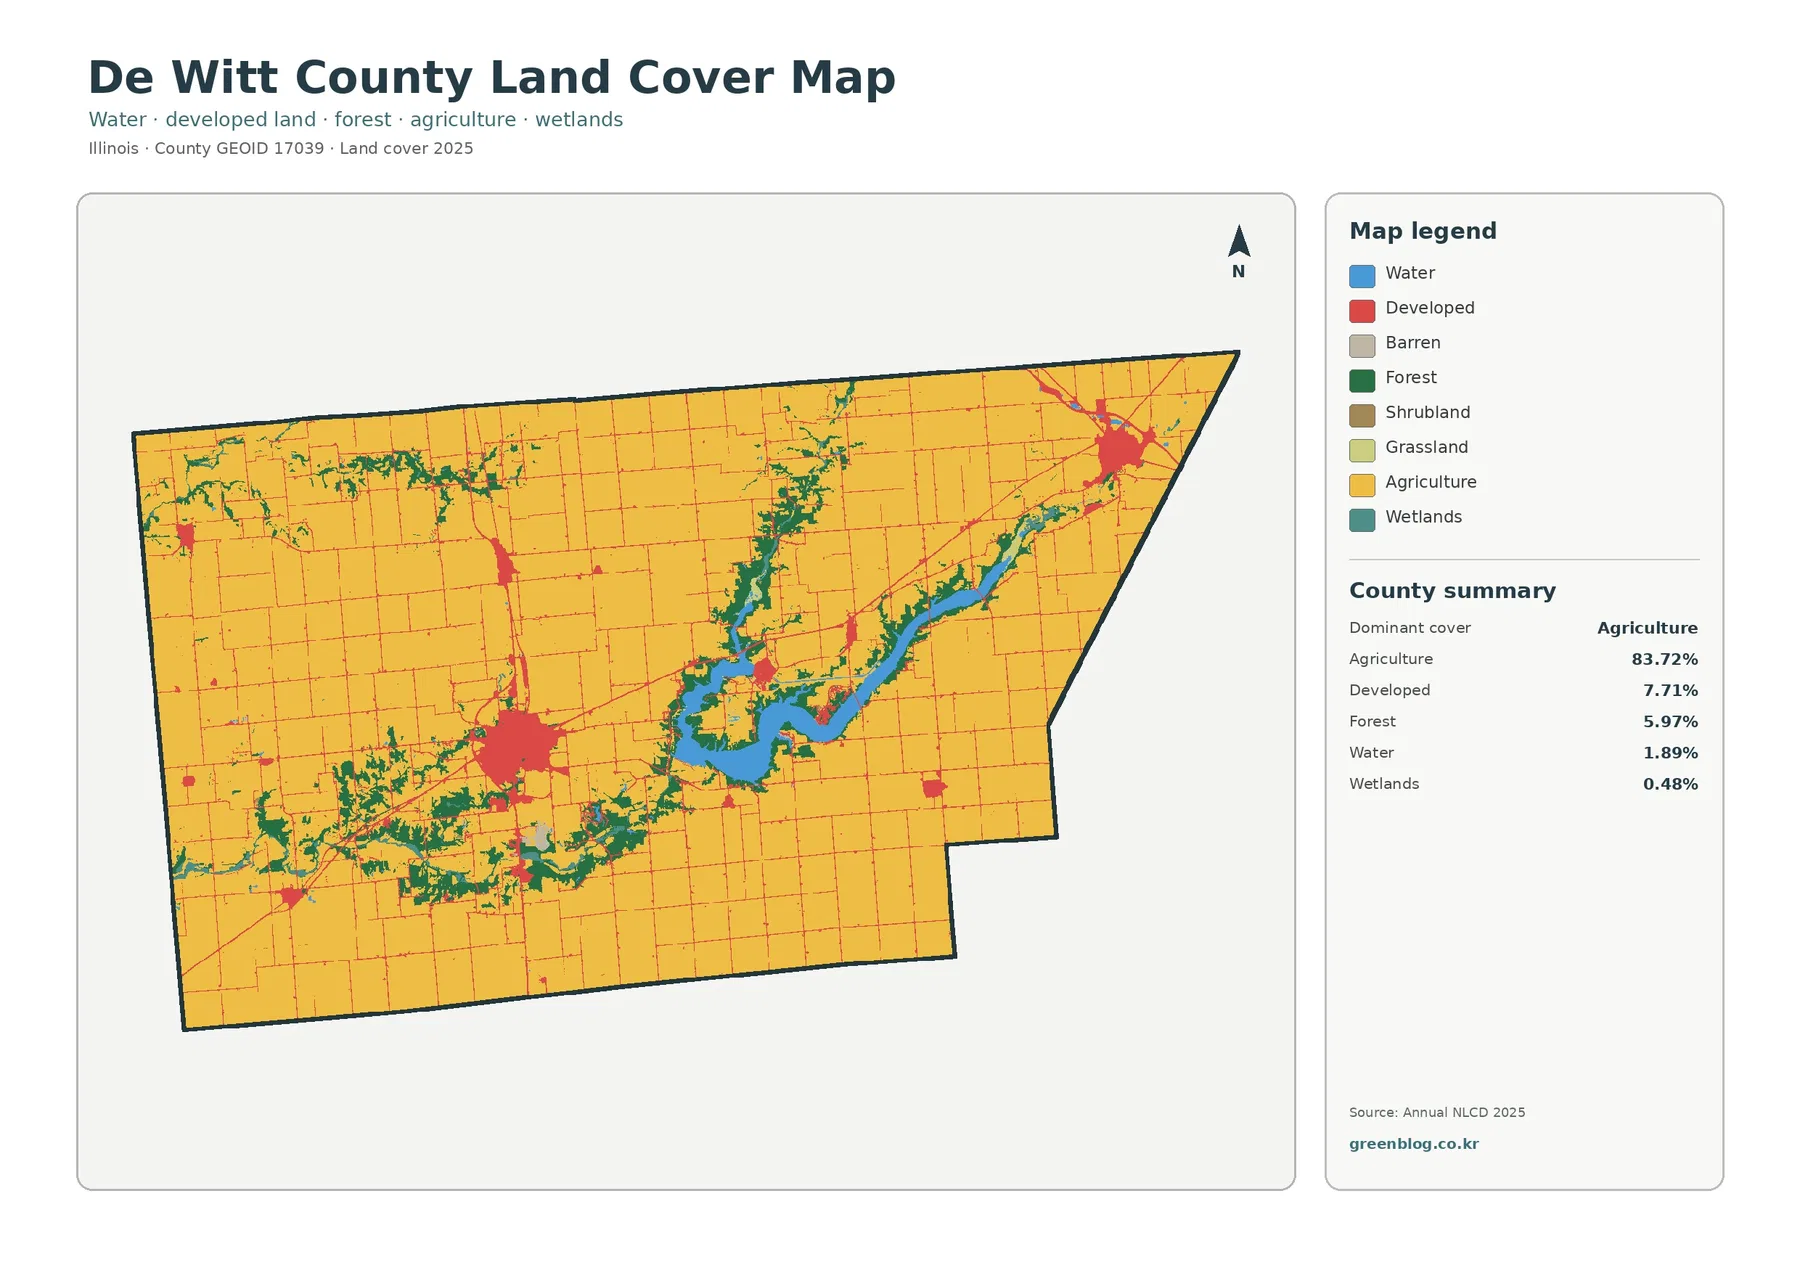
The county summary makes the overall pattern unusually clear. Agriculture represents 83.72% of the 2025 classification, followed by developed land at 7.71%, forest at 5.97%, water at 1.89%, and wetlands at 0.48%. Because the agricultural share is so large, the other classes stand out as distinct shapes rather than forming a complicated patchwork across the entire county. The result is a map where towns, wooded drainages, and the lake can be picked out quickly against a broad farm background.
Clinton Lake is the most prominent nonagricultural feature. Its long arms occupy the central-eastern part of the county, and forest often follows the irregular shoreline. Several wooded stretches extend beyond the immediate water edge into nearby drainage corridors. These green areas contrast with the straighter field boundaries that dominate much of the surrounding land, making the lake area useful as an orientation point even before individual towns are considered.
The Illinois Department of Natural Resources describes Clinton Lake as a roughly 4,900-acre lake within a 9,300-acre state recreation area. The agency also notes that much of the recreation land includes wooded shoreline and open land around the water. That local context matches the visible map pattern: the lake is not an isolated water polygon but part of a larger cluster where water, forest, wetland, agriculture, and limited developed surfaces meet within a relatively small portion of De Witt County.
Developed land forms compact centers rather than a continuous urban area
Developed cover is concentrated in a few recognizable nodes. The largest west-central cluster corresponds to Clinton, the county seat, where the red developed classes spread beyond a tight core and connect to several road corridors. A second strong cluster appears in the northeast around Farmer City. Smaller developed patches are scattered between these centers and near other settlements, but most are surrounded almost immediately by agricultural cover.
The contrast between Clinton and the lake is especially useful for reading the county. Clinton appears as a compact developed mass west of Clinton Lake, while the shoreline to the east is dominated by water and forest with much less continuous hard-surface development. Farmer City has a different setting: its developed footprint sits near the northeast edge of the county and is enclosed by a regular farm grid rather than by the broad water-and-forest pattern seen near the lake.
Thin lines of developed cover extend away from the main towns along the road network. On a county-scale land-cover map, these linear marks are useful for seeing where built surfaces are present, but they should not be read as exact road widths. Raster classification groups the ground into cells, so a narrow road may be blended with adjacent crops, grass, trees, or buildings. The mapped pattern is best used to compare concentration and direction rather than to measure individual streets.
Forest is limited in area but follows the lake and branching drainage lines
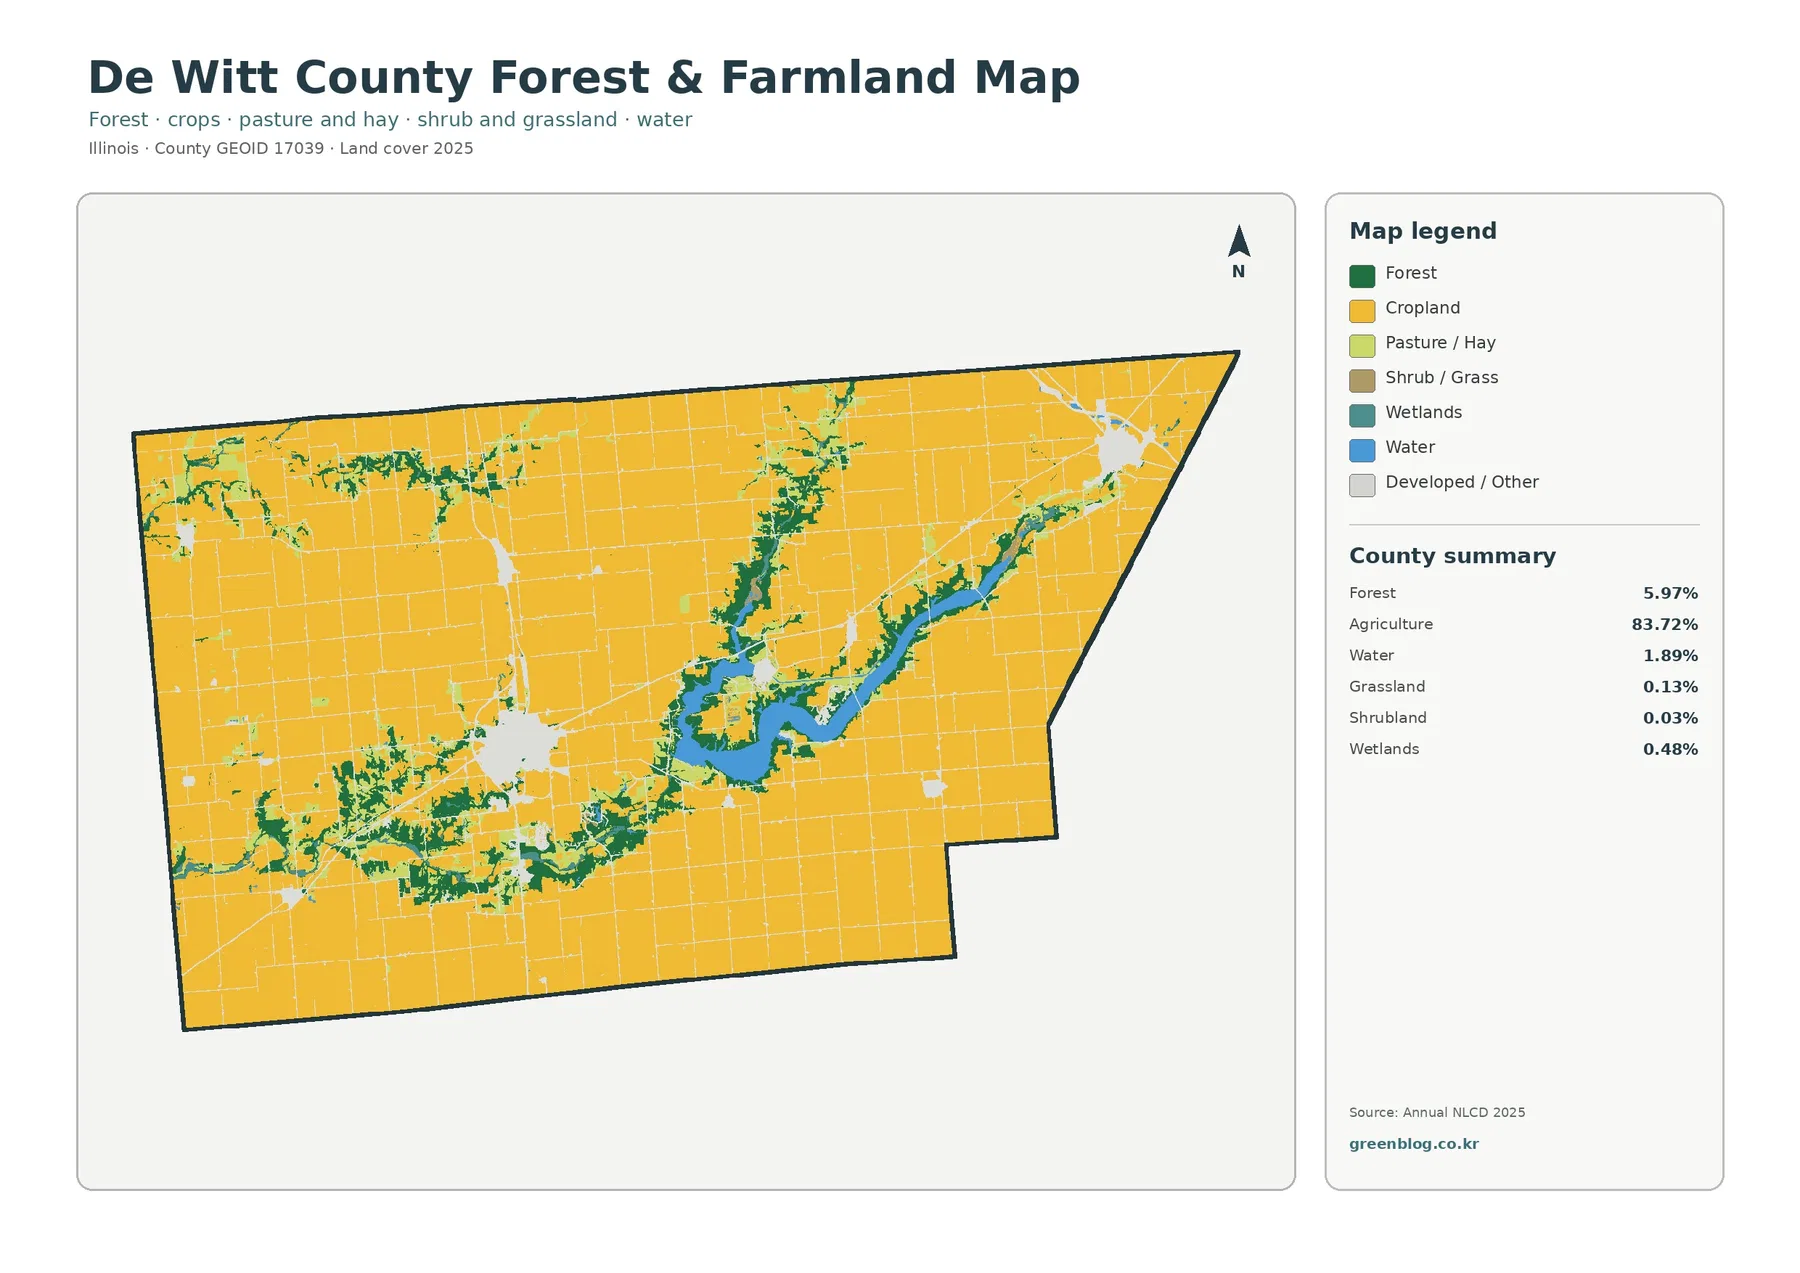
The forest-and-farmland view removes much of the visual competition from developed classes and makes the county’s green corridors easier to follow. Agriculture still covers 83.72%, while forest accounts for 5.97%. Most of that forest does not form a single large block. Instead, it gathers around Clinton Lake and traces irregular, branching lines through the western and southern portions of the county.
Agricultural fields dominate the broad spaces between those wooded lines. Their distribution appears as large connected areas because cropland reaches nearly every county edge and surrounds most settlement clusters. The sharper contrast on this map is particularly helpful around the lake, where forest touches long sections of shoreline and separates the water from nearby farm fields. In the southwest, wooded strips also create curved shapes that differ clearly from the rectangular field pattern.
The legend also includes pasture or hay, shrub and grass cover, wetlands, water, and developed or other land. Grassland is only 0.13% in the county summary and shrubland is 0.03%, so neither should be treated as a major countywide landscape type. Wetlands are also limited at 0.48%, but their locations can still matter where they occur next to the lake or along low drainage areas. The dominant comparison remains agriculture versus forest and water.
Impervious surfaces reveal where the county’s built footprint is strongest
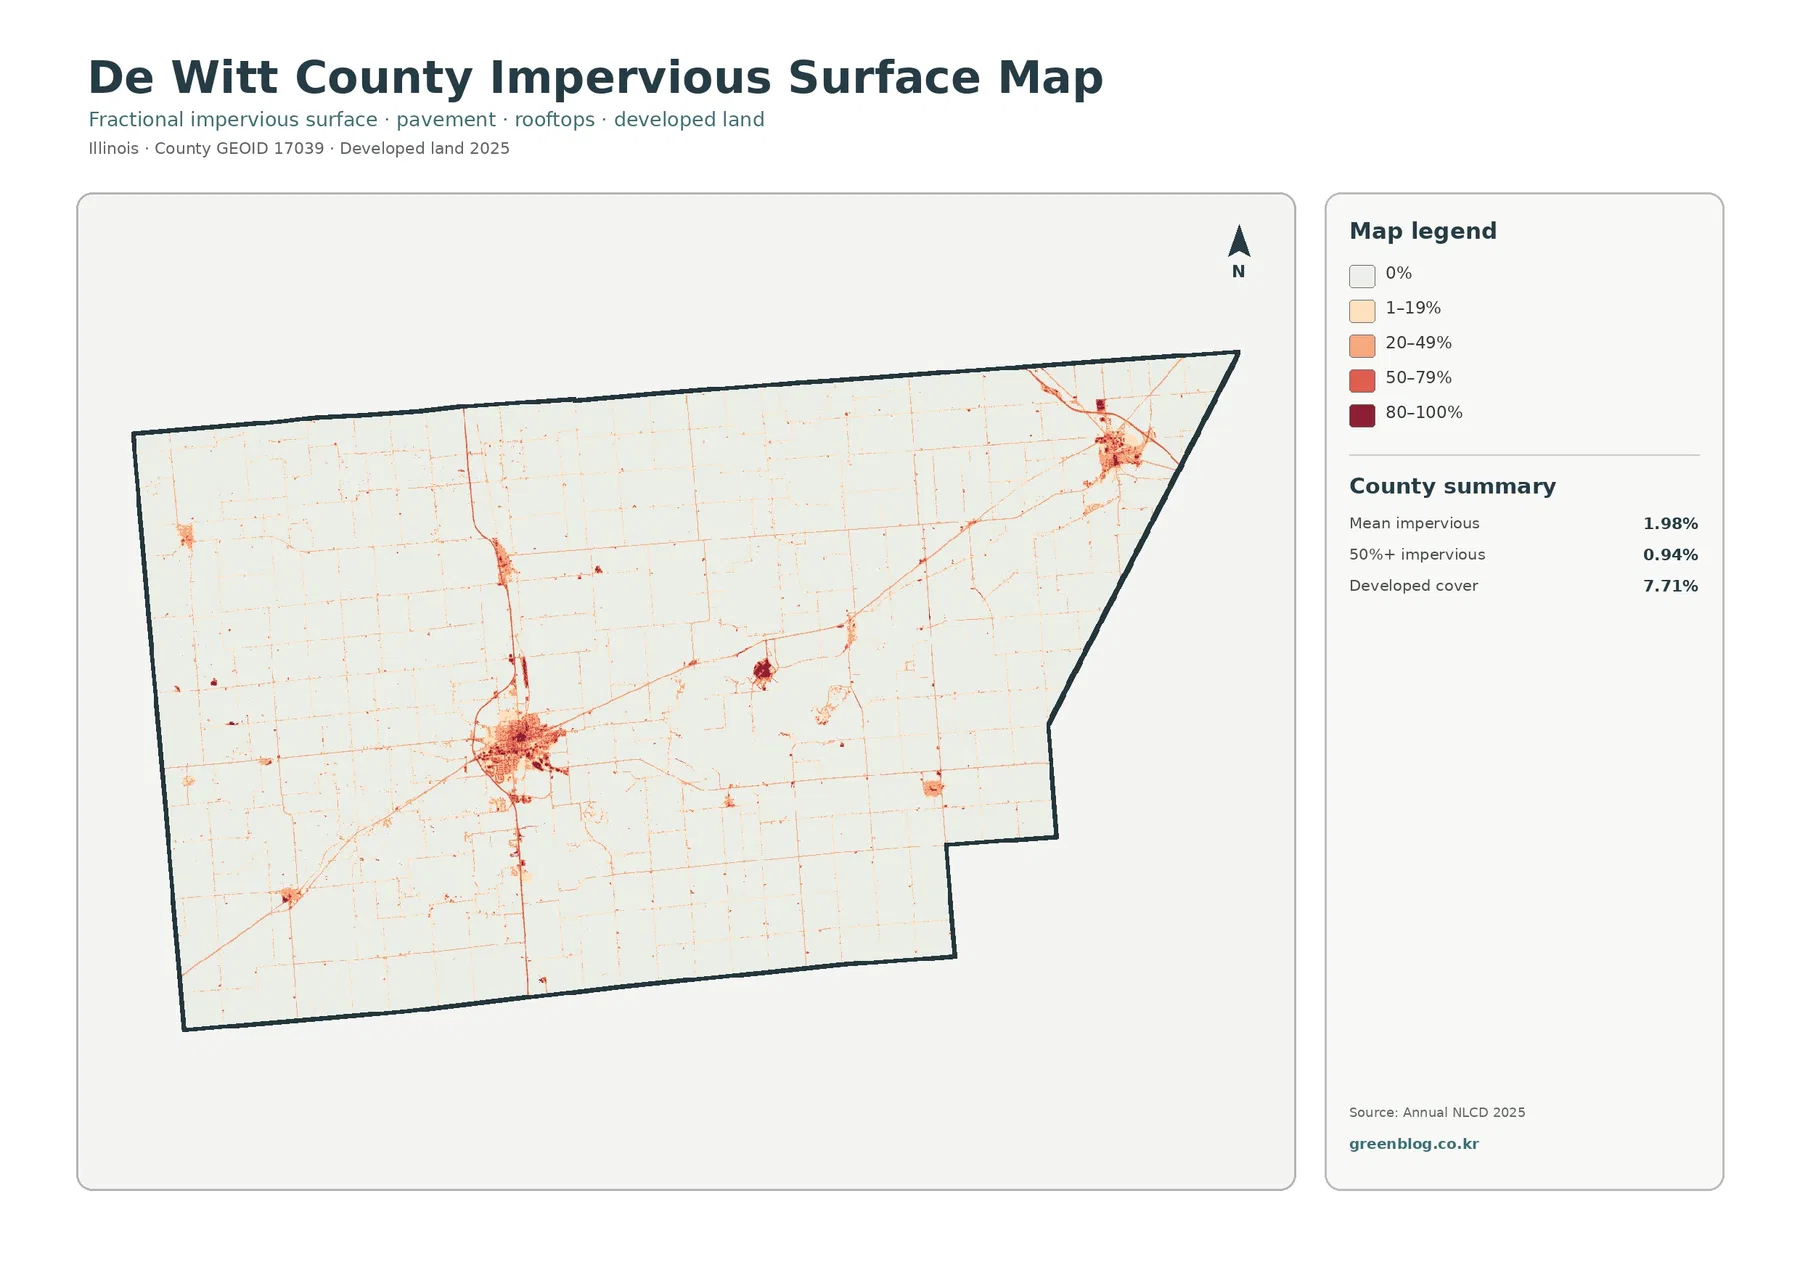
An impervious surface is a hard surface such as pavement or a rooftop where water does not readily soak into the soil. De Witt County has a mean impervious value of 1.98%, and only 0.94% of the mapped county is in cells with 50% or greater impervious cover. Those low countywide figures fit the agricultural setting, but the impervious map still shows a strong local contrast between town centers and the surrounding countryside.
Clinton contains the largest concentration of medium and high impervious values. The darkest areas sit within the town’s central built-up footprint, then fade outward into lower-value roads and scattered development. Farmer City forms another compact concentration in the northeast. Between them, the rural road grid appears mainly as thin, pale lines, which helps separate transportation surfaces from the much larger continuous urban footprints found in more densely developed counties.
Clinton Lake provides an instructive comparison. The general land-cover map gives the lake and its wooded shore substantial visual weight, yet the impervious map leaves most of the same area very light. Roads, recreation facilities, and small built sites are present, but they do not create a large high-impervious block. Looking at these two maps together prevents a common mistake: a visually busy recreation area is not necessarily equivalent to a densely paved urban area.
The 1985–2025 comparison is mostly stable, with scattered class differences
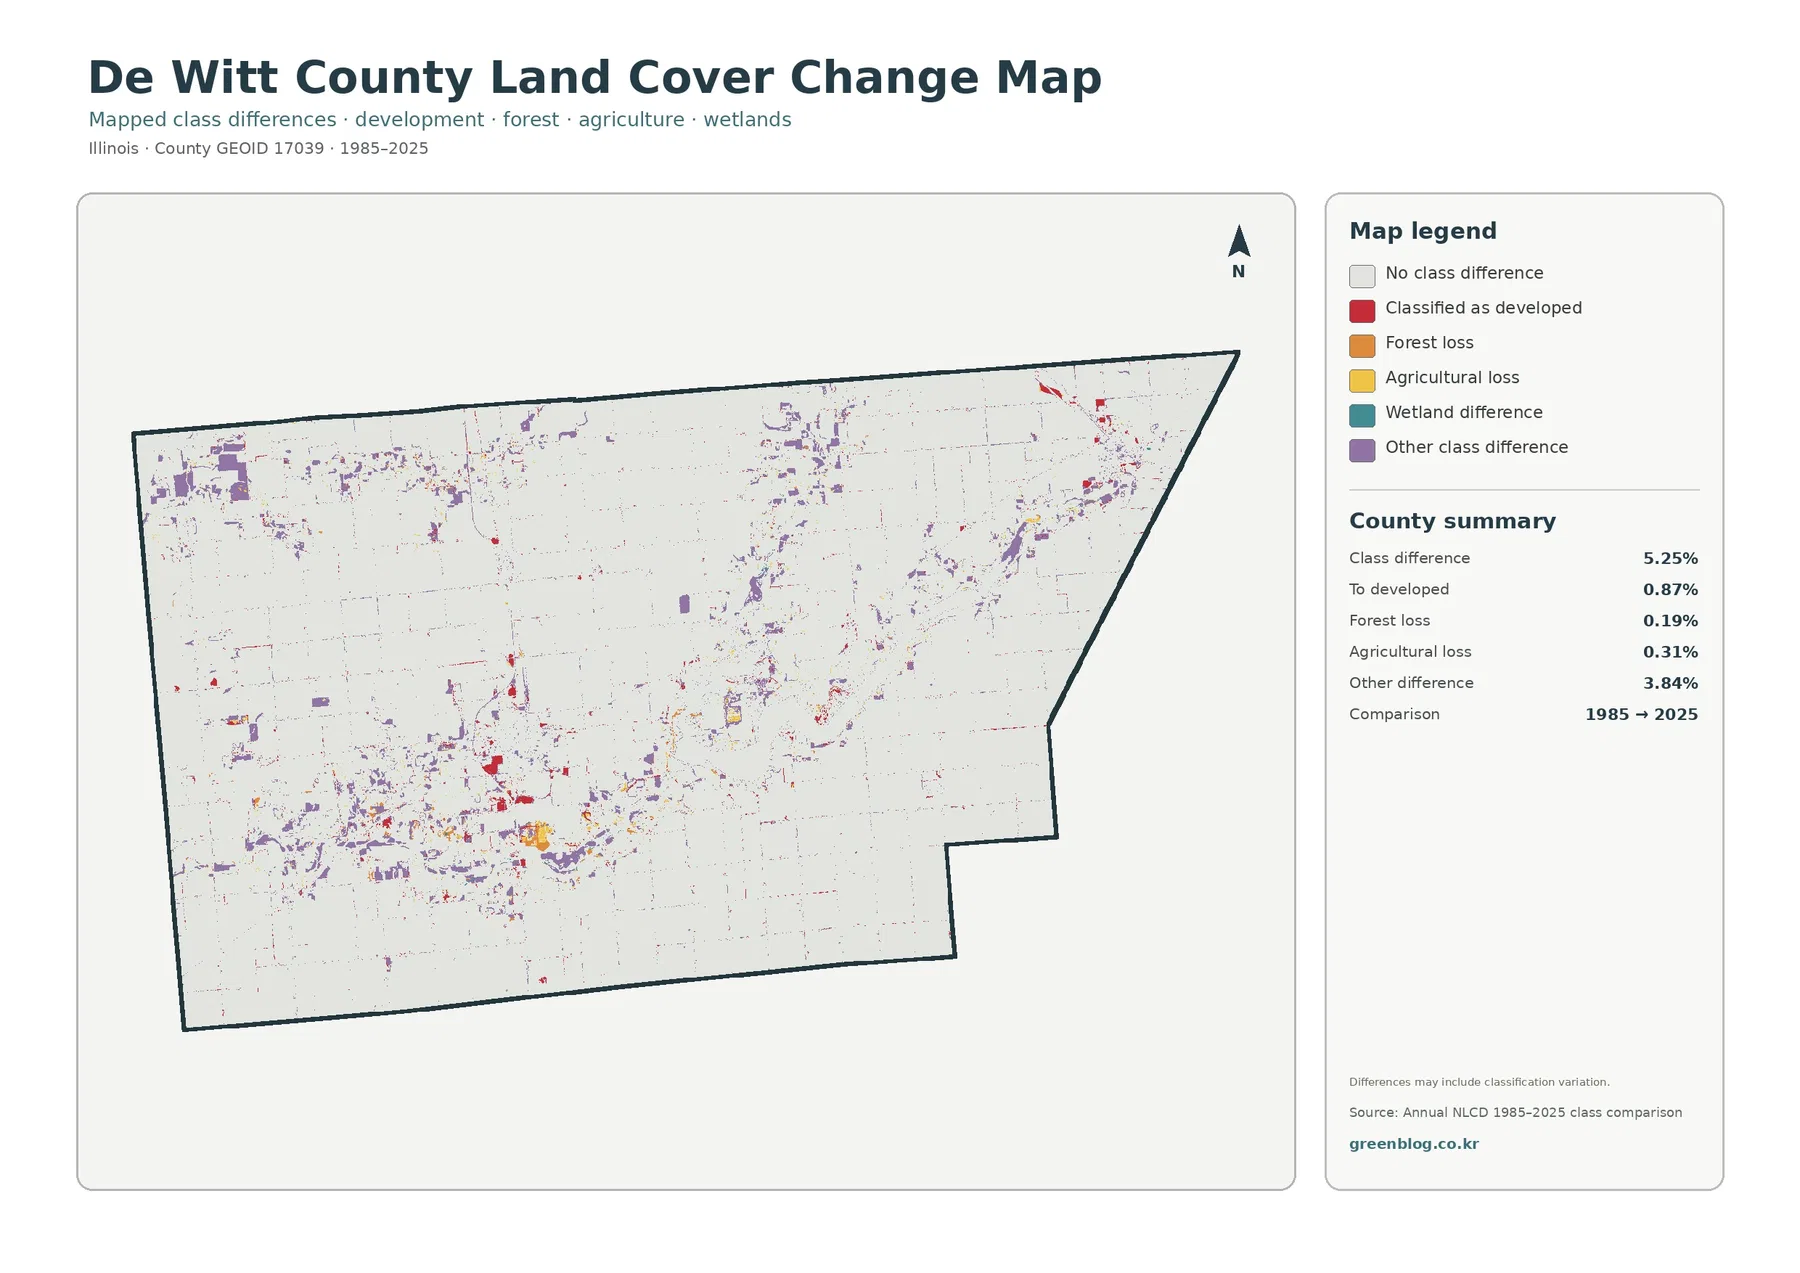
The change view compares mapped classes in 1985 and 2025 rather than showing a simple “before and after” photograph. The county summary reports class differences across 5.25% of the area. Of that total, 0.87% is mapped as changing to developed, 0.19% as forest loss, 0.31% as agricultural loss, and 3.84% as other class difference. The numbers indicate that most of De Witt County remains in the same broad class at the two endpoints.
That stability is visible on the map because unchanged areas occupy most of the county. Difference colors appear as small patches, narrow strips, and scattered cells rather than one large continuous zone. Red developed-change marks are more noticeable around Clinton and also appear near Farmer City. Other difference colors are spread more widely, including around wooded drainage lines, field edges, and parts of the Clinton Lake area.
The “other class difference” category deserves special attention because it accounts for 3.84%, more than the named development, forest-loss, and agricultural-loss categories combined. A purple patch therefore should not automatically be described as urban growth or ecological loss. It may represent a switch among other mapped classes or a classification difference at a boundary. This map is best used to locate places for closer review, not to assign a cause to every changed cell.
Which of the four maps should you use?
Start with the general land-cover map when the goal is to explain De Witt County in one image. It preserves the relationship among agriculture, Clinton Lake, forest, wetlands, and developed land, and it makes the 83.72% agricultural share immediately understandable. It is also the most useful view for showing where Clinton and Farmer City sit relative to the lake and the surrounding farm landscape.
Choose the forest-and-farmland map when the question is about green corridors, crop-dominated areas, or the boundary between fields and wooded land. Its simplified palette makes the lake shoreline and branching wooded strips easier to trace. For a presentation about surface development, the impervious map is more direct because it separates compact built centers from low-impervious rural roads and fields.
The 1985–2025 comparison serves a different purpose. It is useful for finding places where the mapped class has changed, especially around development centers or along complex class boundaries. It should not be used as a parcel-level development history. A strong workflow is to identify a difference on this map, then compare the same location on dated aerial imagery or another detailed local source before drawing a conclusion about what happened.
Reading limits matter at county scale
These maps are designed for county-scale interpretation. Annual NLCD is produced at 30-meter spatial resolution and stored as raster cells, meaning the landscape is divided into small grid squares and each cell receives a class or numerical value. A cell can contain more than one real-world surface, so a road beside a field or a narrow tree line beside crops may be simplified into the class that best represents that cell. That generalization is normal for regional land-cover mapping.
The change map has an additional limitation: endpoint differences can reflect both real land-cover change and classification variation. The source map itself warns that differences may include classification variation. Small isolated patches should therefore be interpreted cautiously. Larger repeated patterns, especially when they align with town growth or a clearly visible landscape feature, are better candidates for follow-up research than a single colored cell.
Frequently Asked Questions
What is the dominant land cover in De Witt County?
Agriculture is the dominant 2025 class at 83.72%. Developed land accounts for 7.71%, forest 5.97%, water 1.89%, and wetlands 0.48%. Clinton Lake and its wooded shoreline are the most prominent nonagricultural feature in the county.
Which map is best for comparing Clinton Lake with the surrounding farmland?
The general land-cover map gives the clearest overall comparison among water, forest, agriculture, and developed land. The forest-and-farmland map is better when you want the wooded shoreline and drainage corridors to stand out against the surrounding fields.
Does the 5.25% class difference from 1985 to 2025 mean all of that area physically changed?
No. The map compares classified endpoints, so the 5.25% can include real land-cover change as well as classification variation. The summary separately identifies 0.87% changing to developed, 0.19% forest loss, and 0.31% agricultural loss, while 3.84% is other class difference.
Map File Information
The ZIP contains four original JPG maps covering different ways to read land cover across De Witt County.
- Included Versions: land cover, forest and farmland, impervious/developed land, and 1985–2025 land-cover change
- File Type: one ZIP containing four JPG files
- Intended Use: printing, classroom reference, presentations, and county land-cover comparisons
Related Maps
- Adams County Illinois Land Cover Map
- Alexander County Illinois Land Cover Map
- Bond County Illinois Land Cover Map
Sources and references
- MRLC Annual NLCD Data – source portal for annual land-cover data used for the mapped 2025 classes.
- USGS Annual NLCD Land Cover Classification – definitions and background for the land-cover classes.
- Illinois DNR – Clinton Lake State Recreation Area – official local context for Clinton Lake and the surrounding recreation lands.
- USDA 2022 Census of Agriculture – De Witt County Profile – county-level farm counts and land-in-farms statistics.
- USGS Annual NLCD Collection 1.2 Land Cover – product details for the 2025 release and 30-meter spatial resolution.
- U.S. Census Bureau TIGER/Line Shapefiles – official source for county boundary data.
Green Map creates custom-edited map images using open geographic data sources such as geoBoundaries, Natural Earth, OpenStreetMap, and government open data.
These maps are edited visual materials, not raw data files, and are provided for education, documents, presentations, and graphic reference.