The Calhoun County Illinois Land Cover Map set reflects the county’s narrow position between the Mississippi and Illinois rivers. Forest leads the 2025 summary at 37.46%, agriculture follows at 35.06%, wetlands account for 12.09%, water for 9.87%, and developed land for 5.14%. Woods and farm openings dominate the interior, while blue and teal river-edge classes frame much of the county.
Four views are included: 2025 land cover, forest and farmland, impervious surface and developed land, and a 1985–2025 class-difference comparison. The WebP images are placed with the discussion, and the four original 2480 × 1754-pixel JPG maps are available together in one ZIP download for county profiles, river-corridor lessons, agriculture and forest comparison, and presentation graphics.
Table of Contents
Water and wetlands make the county edges as important as the interior
Calhoun County’s official site describes rolling hills between two great rivers, and the map outline makes that setting obvious. Blue water follows long sections of both sides of the county, while teal wetland cover spreads inward around backwaters and lower ground. The wetland pattern is broad enough that it cannot be treated as a thin shoreline feature.
Open water accounts for 9.87% and wetlands for 12.09%. The two values should stay separate. Open water emphasizes exposed water surfaces, while wetlands can include saturated soil and vegetation influenced by water. In the south and northwest, these classes occur next to one another but still represent different mapped surfaces.
The U.S. Fish and Wildlife Service describes Two Rivers National Wildlife Refuge as riverine and floodplain habitat between the Mississippi and Illinois rivers, with wetlands, open water, bottomland forest, and prairie. Its Calhoun and Batchtown divisions provide direct local context for the large wetland-and-water pattern in the southern and western parts of the county. A land-cover cell is not a refuge boundary or a legal wetland determination, so management and regulatory questions still require official boundary data.
Forest narrowly leads agriculture on the current countywide map
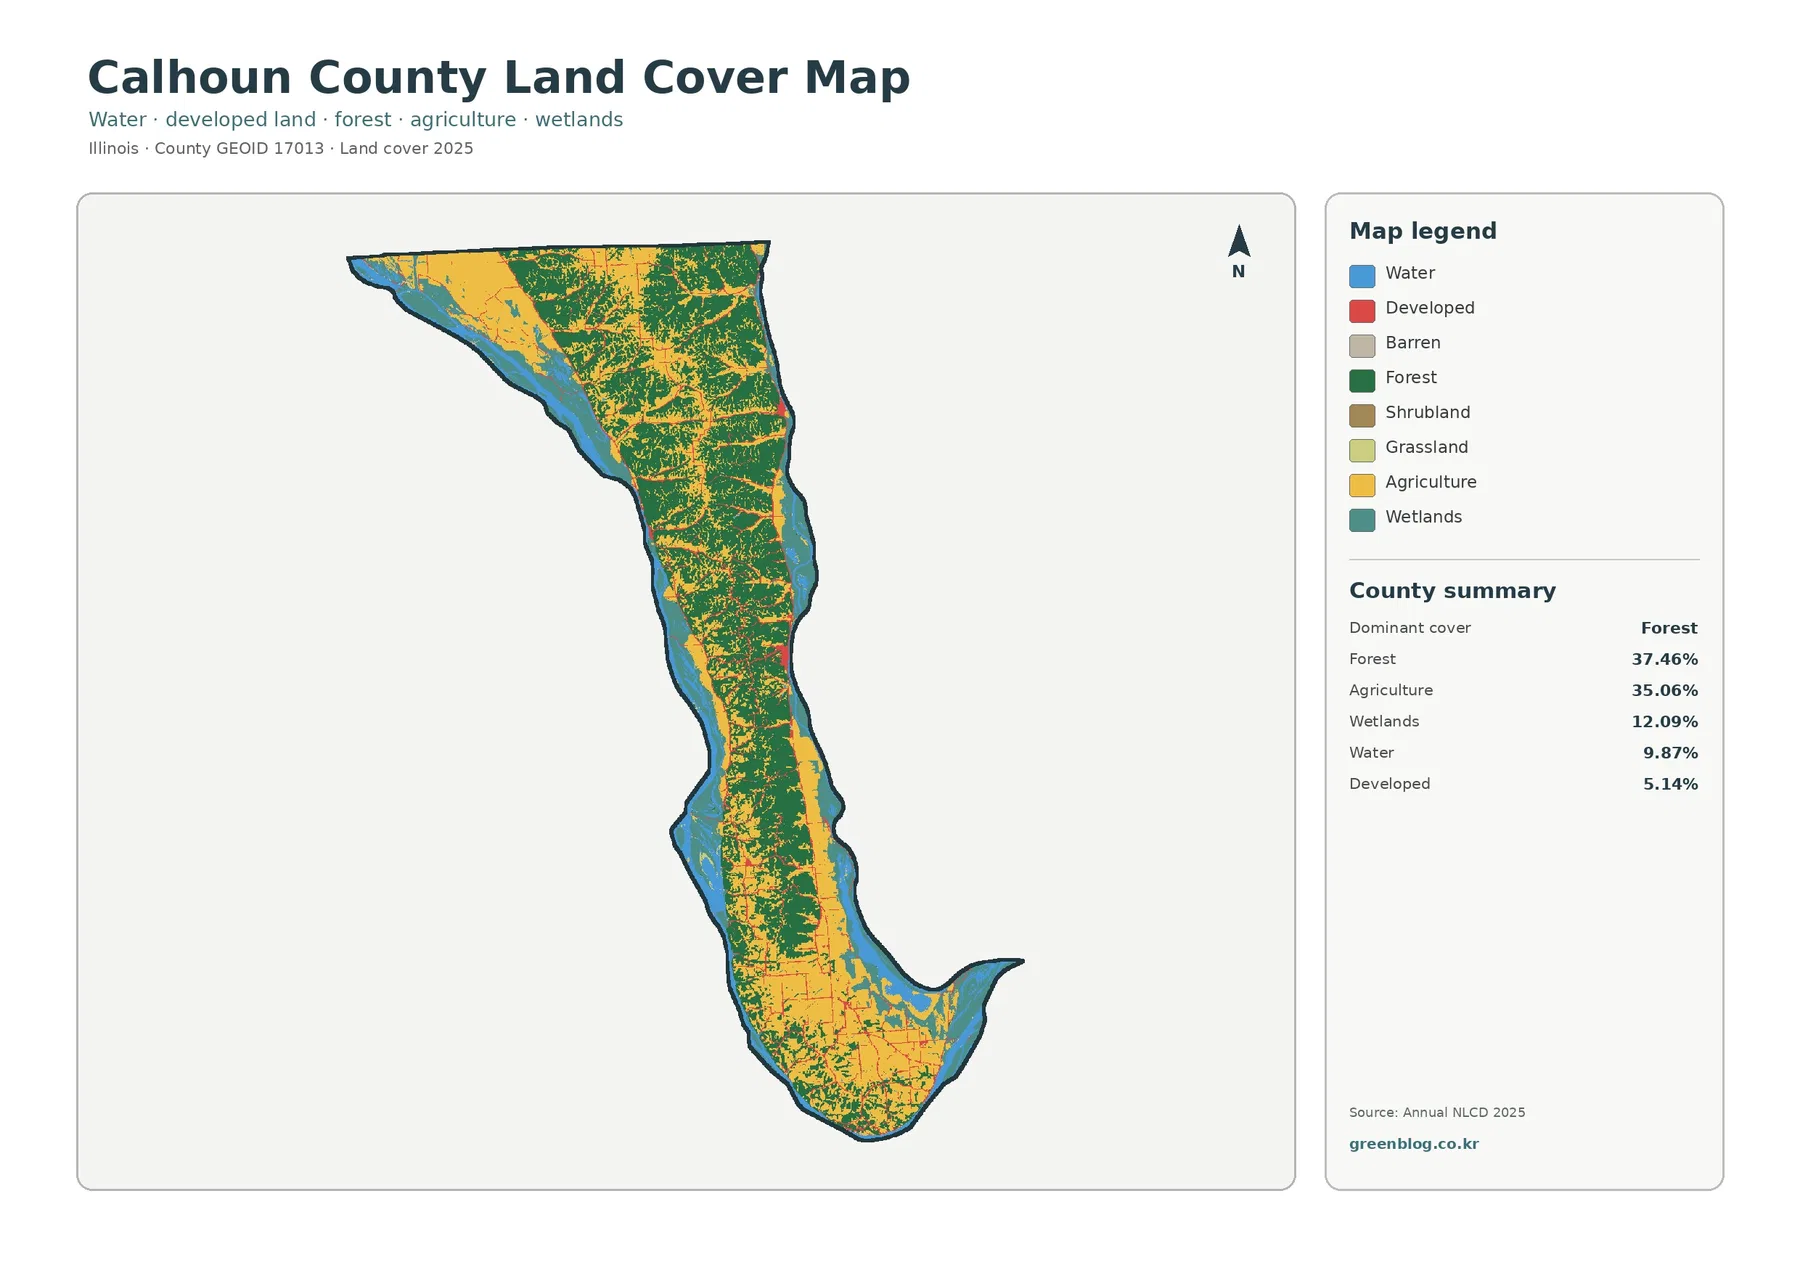
Forest covers 37.46%, the largest class by a small margin. Dark green is strongest through the central and northern interior and continues as smaller blocks farther south. Farm openings repeatedly break the wooded areas, and wetland or water classes replace forest near many river margins.
Agriculture accounts for 35.06%. Yellow farm areas are broad in the northwest and north, occur in a series of interior openings, and expand again toward the lower part of the county. Calhoun County’s visitor information highlights farmland and summer peaches, while University of Illinois Extension serves local farms and fruit growers from its Hardin office. Those sources support agriculture as an important local setting without changing the 2025 map statistic.
Developed land is only 5.14%. The strongest red concentration lies along the east-central side, where Calhoun County government offices and the courthouse are located in Hardin. Historical state material identifies Hardin as the county seat, so the main cluster aligns well with the Hardin area. The raster edge should not be used as a legal municipal boundary.
The vegetation view shows farm openings inside a wooded interior
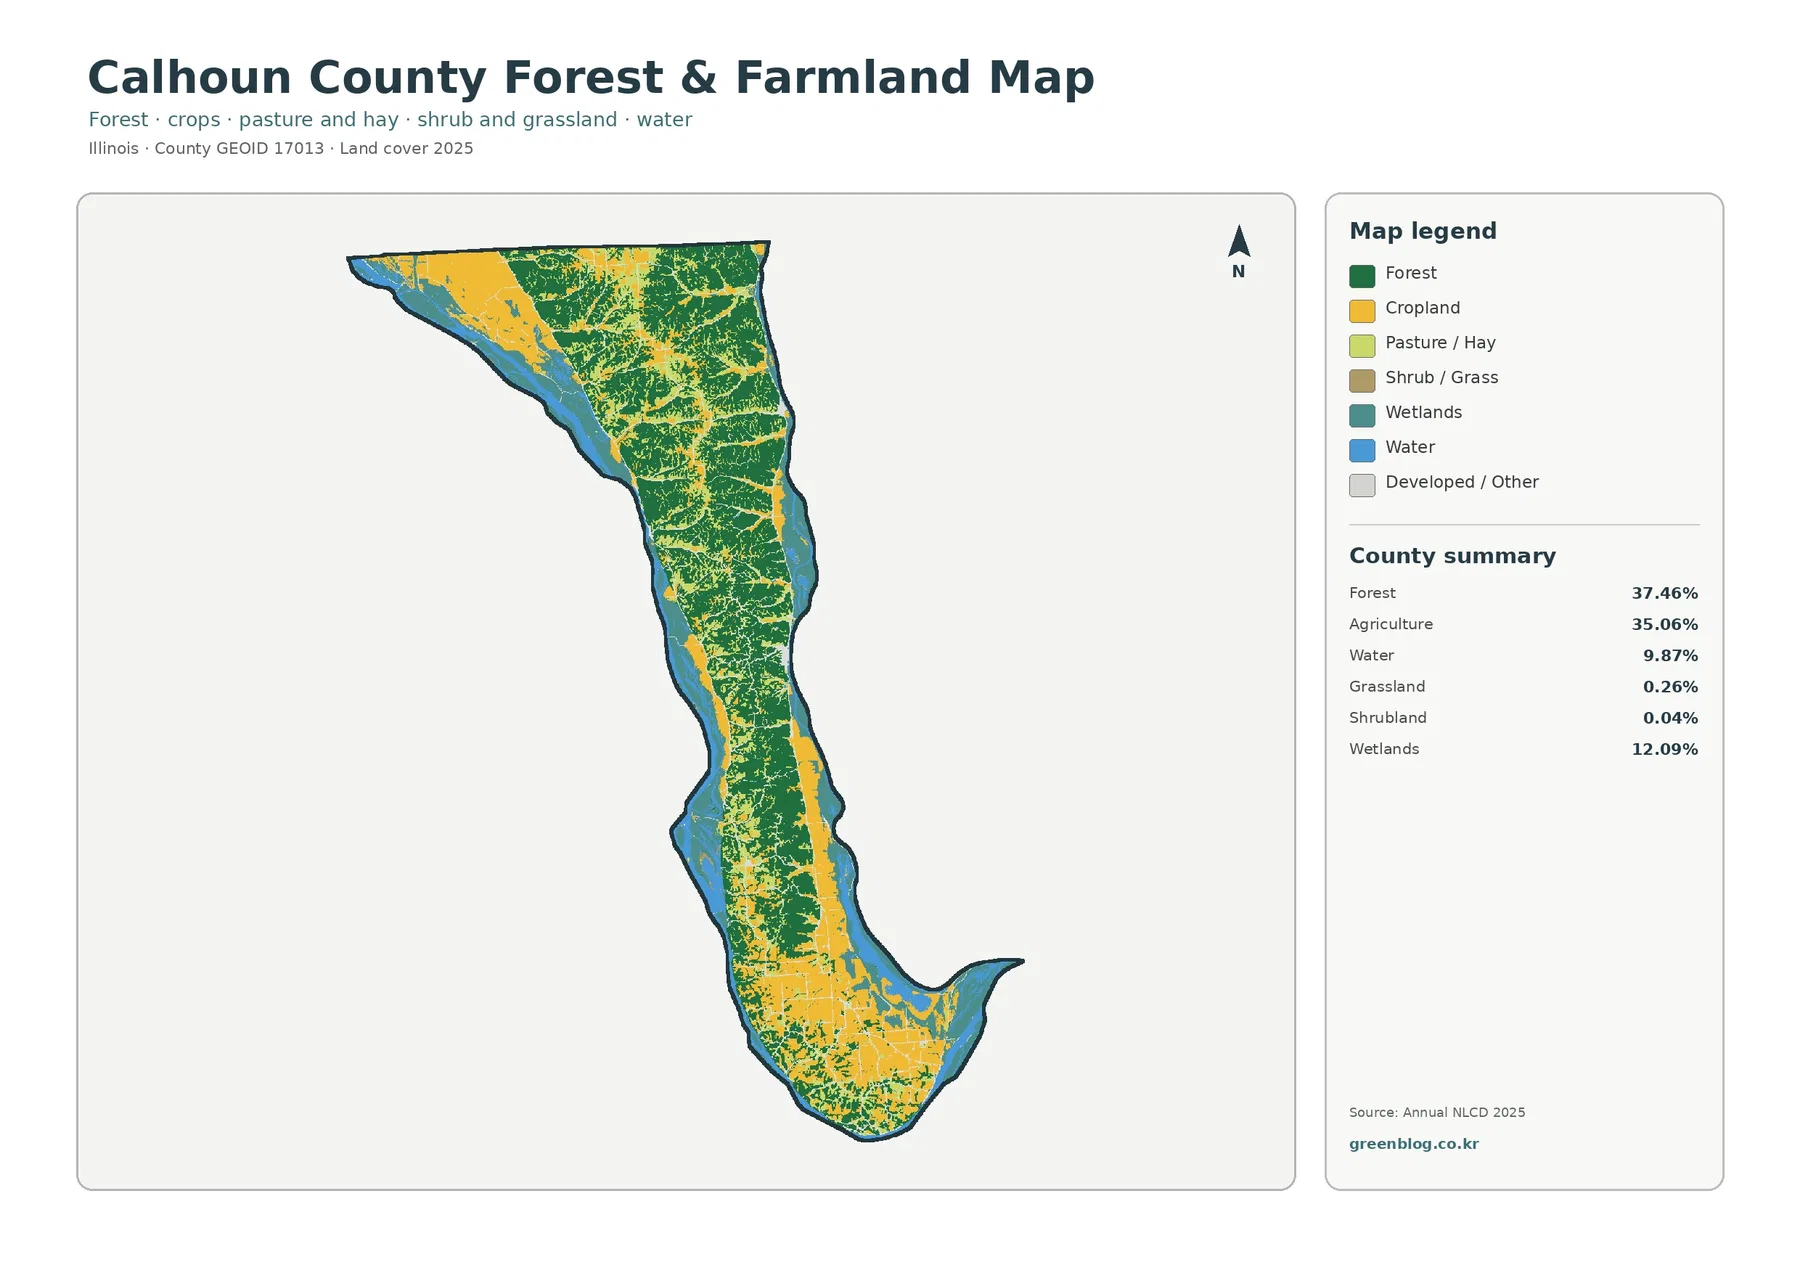
With developed and miscellaneous surfaces faded, the close forest-agriculture balance becomes easier to see. Forest remains broad through the interior, while cropland forms large openings in the north and south and smaller strips through the middle. Wetlands and water frame many of those openings near the two rivers.
Annual NLCD uses 30-meter raster cells rather than surveyed parcel boundaries. A single cell can contain crops, a ditch, a tree row, a farm road, and part of a building while receiving one predominant class. Parcel ownership, crop type, and exact field boundaries require higher-resolution imagery or cadastral records.
Hard surfaces remain concentrated even where the developed class is broader
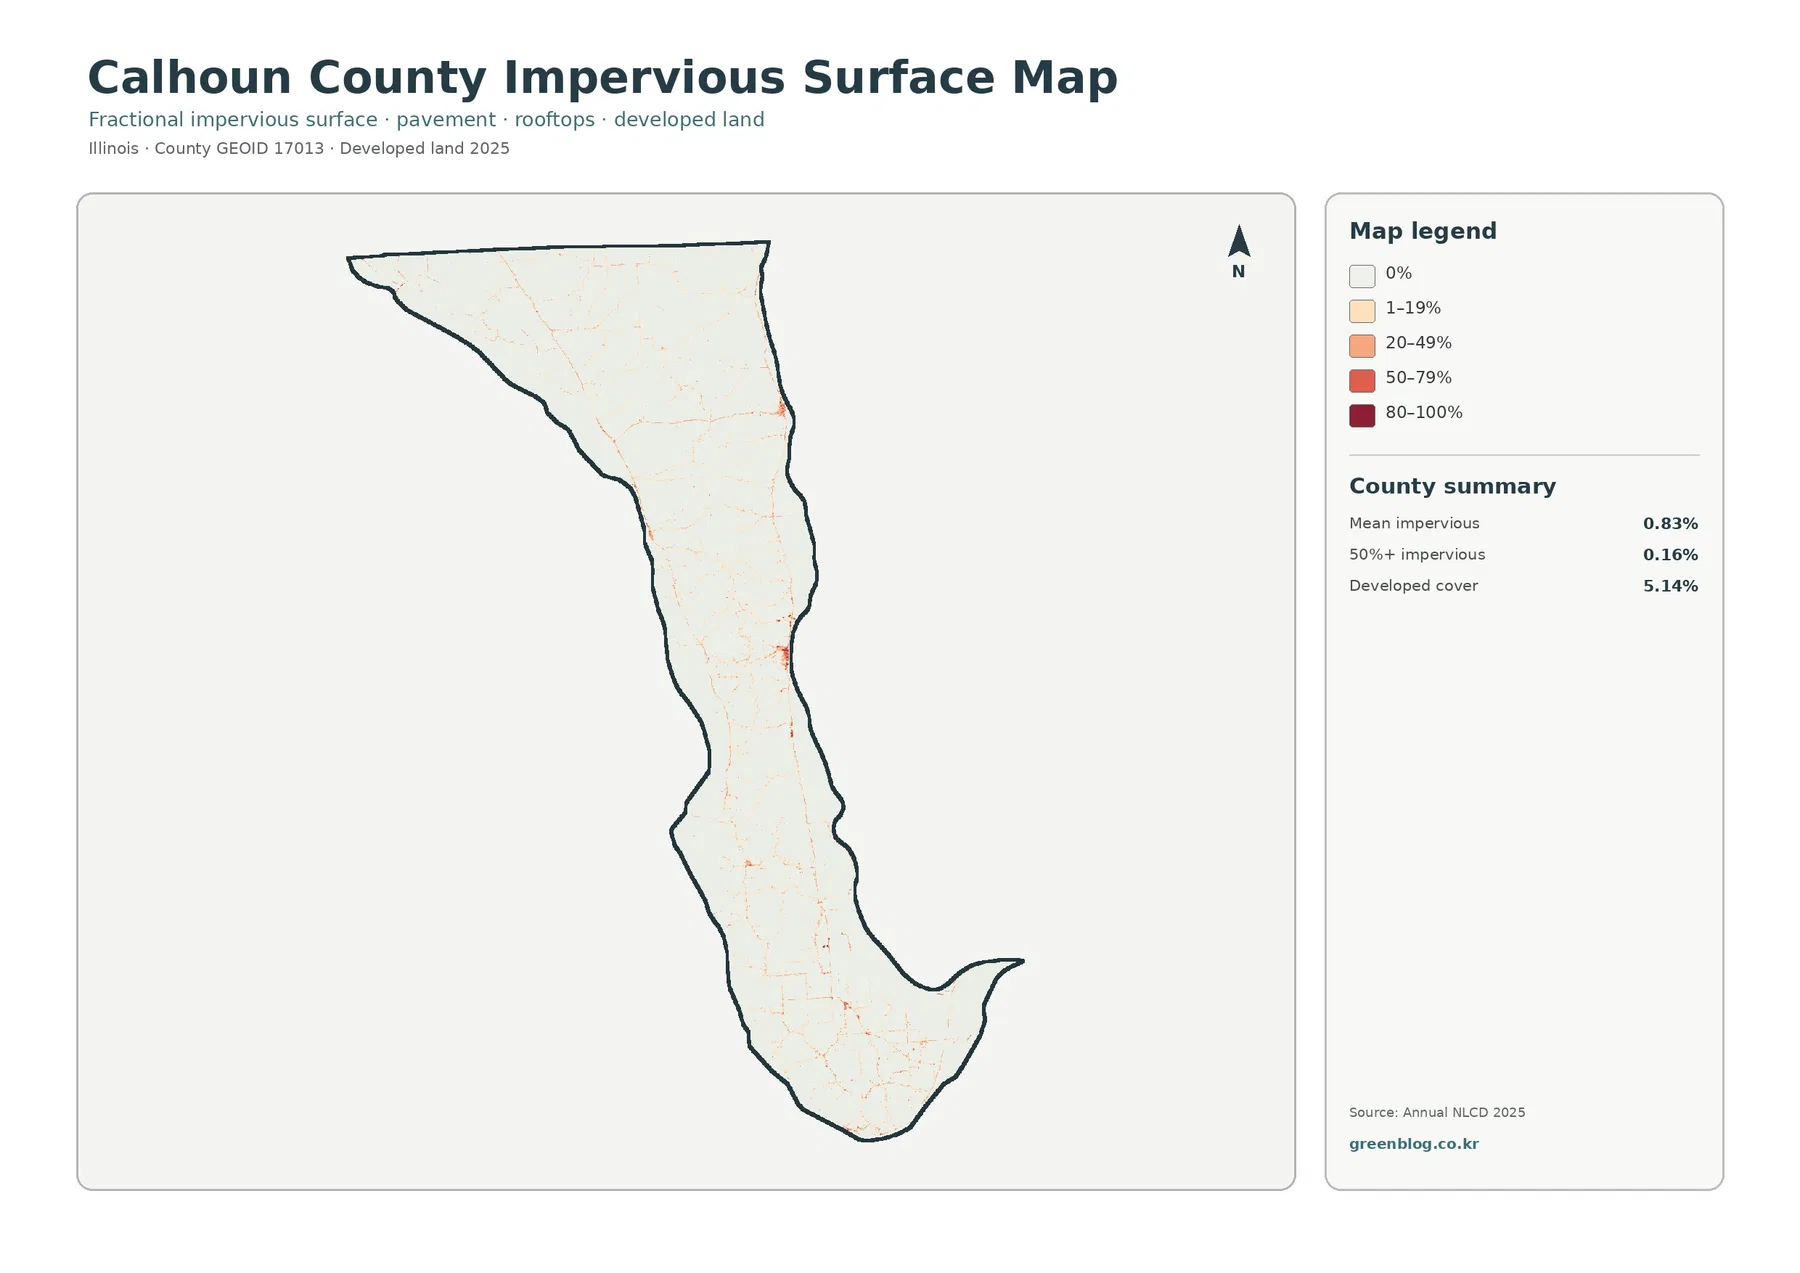
Impervious surface means hard materials such as roofs, pavement, and parking areas that do not readily absorb rainfall. Calhoun County’s mean impervious value is 0.83%, and only 0.16% of the county is mapped at 50% impervious or greater. Both figures are below the 5.14% developed land-cover share because developed classes can contain lawns, trees, soil, and other permeable surfaces.
The east-central Hardin area contains the darkest concentration. Smaller lines and points extend north and south, and the southern farm area contains a somewhat denser network of low-level impervious traces. Most of the county remains at zero or very low values, so settlement centers and roads stand out sharply against forest, farmland, and wet ground.
The 1985–2025 comparison records endpoint differences rather than one story of change
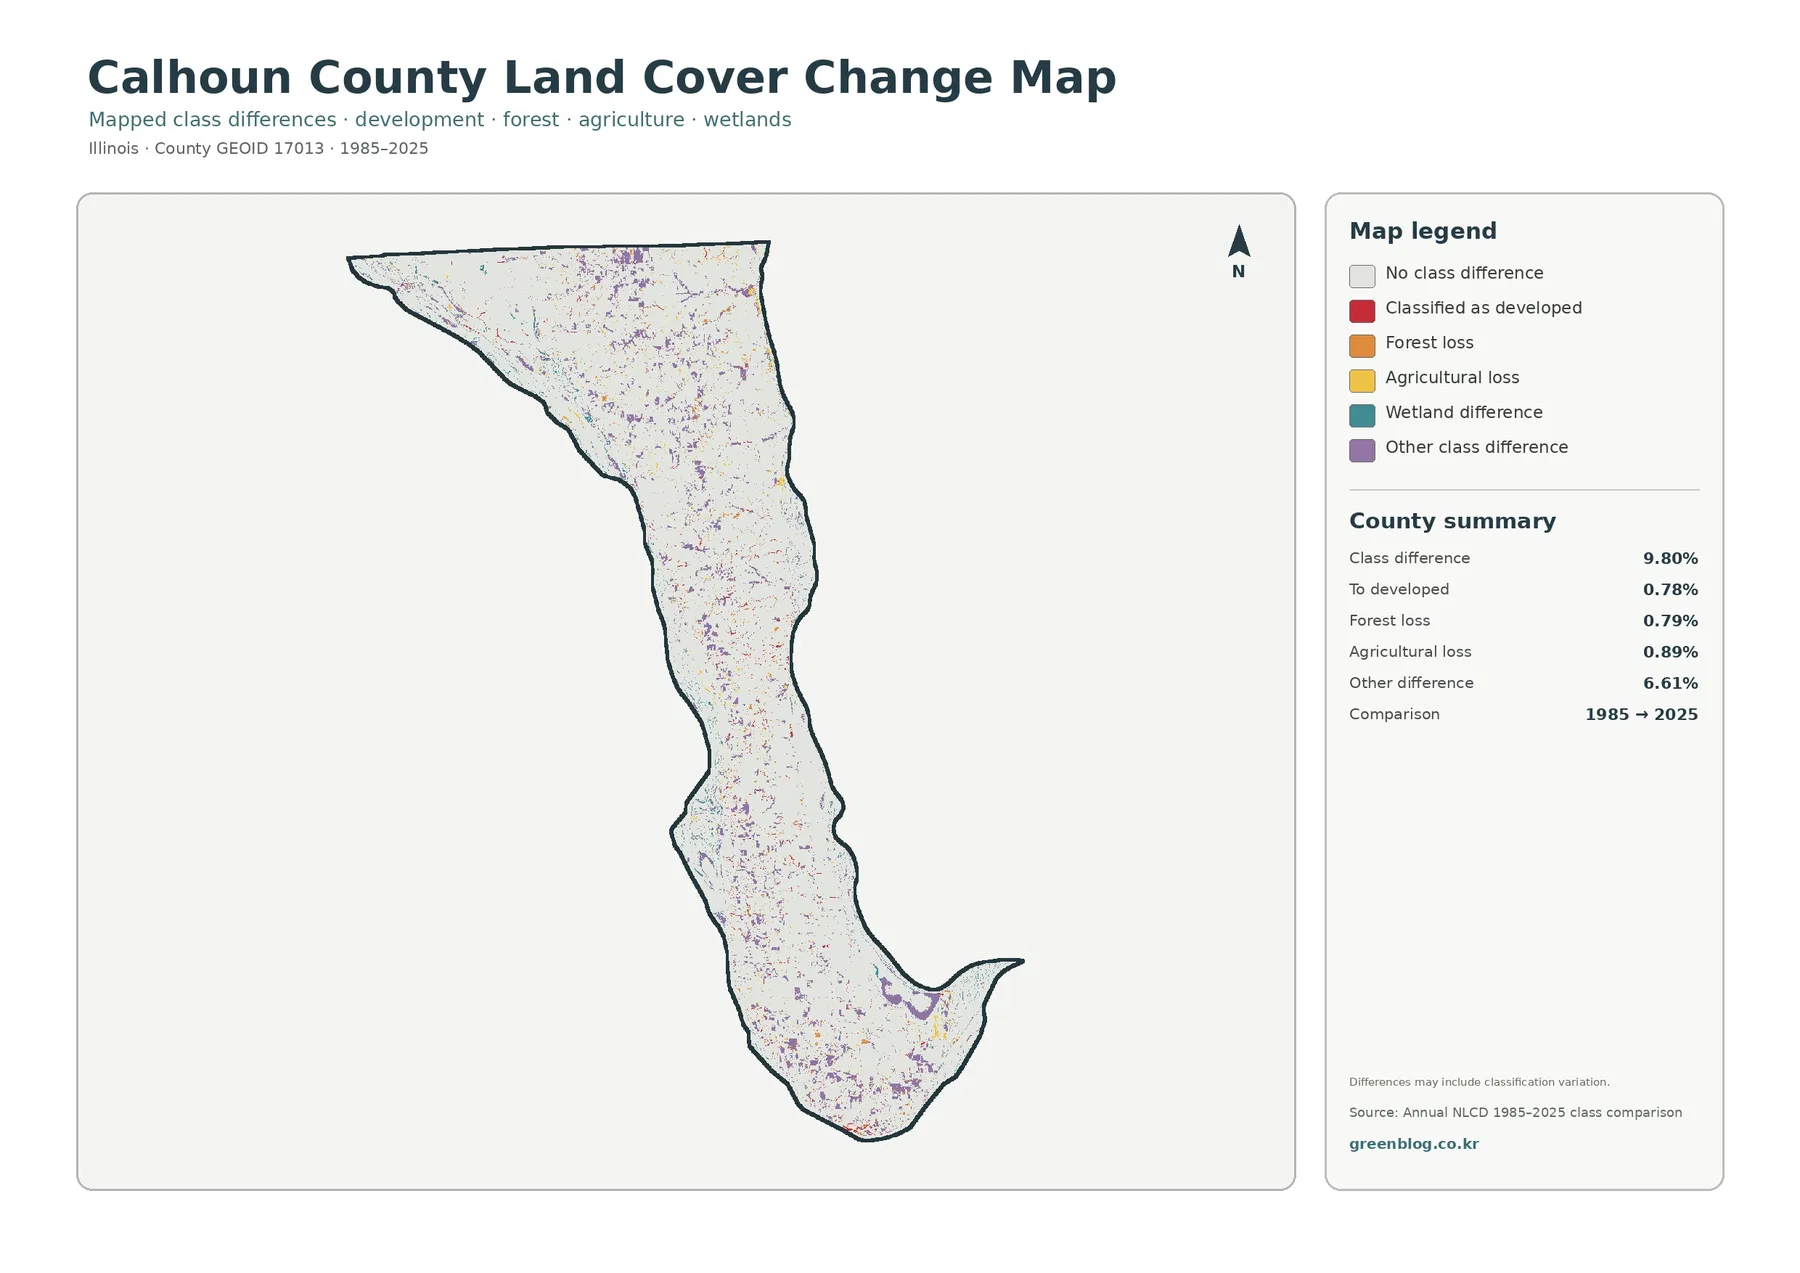
The comparison reports 9.80% total class difference. Listed components are 0.78% classified as developed, 0.79% forest loss, 0.89% agricultural loss, and 6.61% other difference. Wetland difference appears in the legend without its own printed percentage, so it should not be estimated visually or presented as an official residual.
Purple other-difference cells are scattered from the north through the central interior and into the south. Red developed-conversion cells remain small and are most noticeable near the Hardin area and a few settlement traces. Forest-loss and agricultural-loss marks are fragmented rather than forming one broad zone, while wetland-difference cells appear near several river and backwater areas.
The word loss only describes a change in endpoint classification. A forest cell in 1985 that received another class in 2025 is not automatically evidence of logging or damage, and an agricultural-loss cell does not by itself show abandonment or flooding. Real surface change, seasonal conditions, mixed pixels, and classification variation can all contribute, so intermediate imagery and local records are needed to establish cause and timing.
Use the four maps for different questions instead of treating them as interchangeable
Choose the impervious map for settlement intensity and hard-surface concentration. Its 0.83% county mean makes sense only when compared with the darker Hardin cluster and the long stretches of nearly zero cover elsewhere. Place the change map after the current maps so present-day classes are not confused with cells that simply received different labels at the two endpoints.
Files included in the four-map JPG download
The ZIP contains one JPG each for 2025 land cover, forest and farmland, impervious surface and developed land, and 1985–2025 land-cover change. Together they provide a consistent way to compare Calhoun County’s wooded interior, farm openings, Mississippi and Illinois River wetlands, Hardin hard surfaces, and endpoint class differences.
Frequently Asked Questions
Is Calhoun County more forested or more agricultural in the 2025 map?
Forest is the largest class at 37.46%, with agriculture close behind at 35.06%. Their locations overlap throughout the interior rather than forming two simple halves. Forest dominates many central and northern areas, while farm openings are broad in the north, south, and selected interior areas.
Why are wetlands 12.09% when open water is 9.87%?
They are separate land-cover classes. Open water emphasizes exposed water surfaces, while wetlands can include saturated ground and water-influenced vegetation. Calhoun County’s position between the Mississippi and Illinois rivers, including Two Rivers National Wildlife Refuge habitat, helps explain why both classes occupy substantial areas.
Does 9.80% class difference mean 9.80% of Calhoun County was damaged since 1985?
No. It is the share of cells receiving different classifications at the 1985 and 2025 endpoints. Real land-surface change can contribute, but seasonal conditions, mixed 30-meter cells, and classification variation can also matter. Intermediate imagery and local records are needed to determine a specific cause or date.
Sources and Reference Data
- MRLC Annual NLCD Data – official access point for annual land-cover and comparison products
- USGS Annual NLCD Land Cover Classification – official guidance for the 30-meter land-cover classes
- U.S. Census Bureau TIGER/Line Shapefiles – official county-boundary reference for Calhoun County
- Calhoun County, Illinois – official context for the two-river landscape, farmland, and county government in Hardin
- U.S. Fish & Wildlife Service – Two Rivers National Wildlife Refuge – official riverine, wetland, open-water, and floodplain habitat context in and around Calhoun County
- University of Illinois Extension – Calhoun, Cass, Greene, Morgan and Scott Counties – local agriculture, fruit, forestry, small-farm, soil, and natural-resource programs
Map File Information
The ZIP contains four original JPG maps for comparing Calhoun County's forest and agriculture, Mississippi and Illinois River wetlands and water, Hardin hard surfaces, and 1985–2025 class differences.
- Included Files: Use only the versions confirmed in the article and supplied images
- File Type: Use the confirmed download contents
- Intended Use: Printing, education, presentations, and map-based projects
Related Maps
- Adams County Illinois Land Cover Map
- Alexander County Illinois Land Cover Map
- Bond County Illinois Land Cover Map
Green Map creates custom-edited map images using open geographic data sources such as geoBoundaries, Natural Earth, OpenStreetMap, and government open data.
These maps are edited visual materials, not raw data files, and are provided for education, documents, presentations, and graphic reference.