Payette County has a clear split between broad open ground and a much busier western river plain. Grassland accounts for 57.15% of the supplied 2025 summary, while agriculture covers 29.60%. Developed land is concentrated near the county’s three cities rather than spread evenly across the map. This Payette County Idaho Land Cover Map helps compare those open, farmed, built, wet, and river-edge surfaces without treating land cover as zoning or parcel ownership.
Four related views are included: 2025 land cover, forest and farmland, impervious surface and developed land, and a 1985–2025 class-difference map. The WebP previews can be read with the discussion below, and the four original 2480 × 1754-pixel JPG maps are available together in one ZIP. They work best for county profiles, classroom material, presentations, environmental comparisons, and other uses that need a countywide picture rather than parcel-level detail.
Table of Contents
A grassland majority surrounds a concentrated western farm-and-city landscape
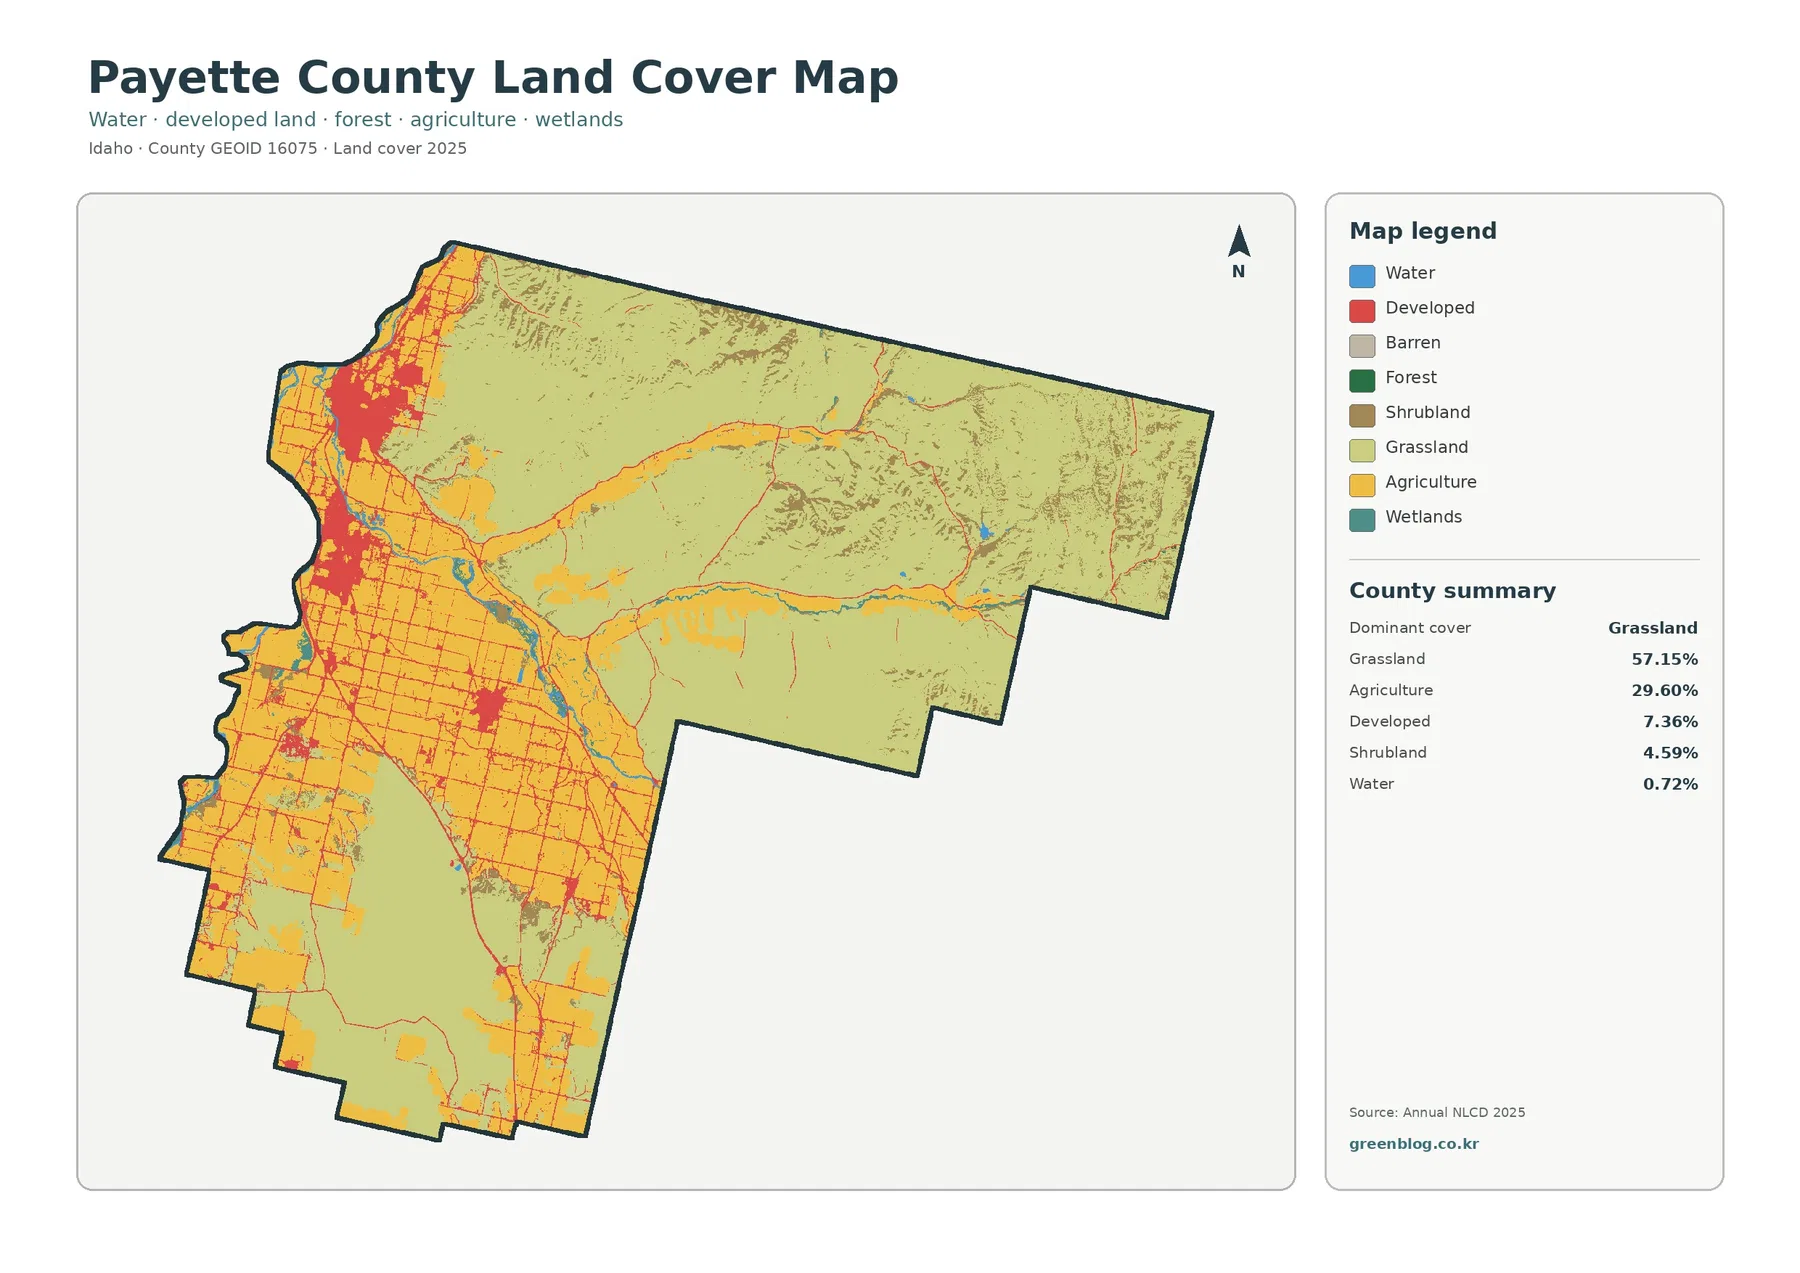
The county summary is led by 57.15% grassland and 29.60% agriculture. Developed land accounts for 7.36%, shrubland for 4.59%, and open water for 0.72%. The focused vegetation map also lists wetlands at 0.56% and forest at only 0.01%. Those figures describe a county where open grass cover dominates the total area, yet the farmed and developed west carries much of the visual detail because fields, streets, and settlement clusters sit close together.
Large pale-green grassland areas fill much of the east and northeast and continue into the south. Brown shrubland is scattered through that open country rather than forming the main cover. Yellow agricultural blocks become much more common toward the west and southwest, where straight edges and repeated field shapes stand out. Red developed areas are strongest in the same western half. The shift is easy to see without needing a statistical model: the east is broadly open, while the west contains most of the farm and settlement texture.
Blue water traces the western edge and crosses the interior along a river corridor. Idaho Department of Environmental Quality describes the Payette River as flowing southwest before entering the Snake River near Payette. That regional fact fits the visible meeting of water, farmland, and development in the northwest. Smaller blue and teal features should remain unnamed unless a hydrography layer is added, because the preview does not distinguish named tributaries, canals, drains, and minor water bodies.
Impervious cover separates the three built clusters from the open county
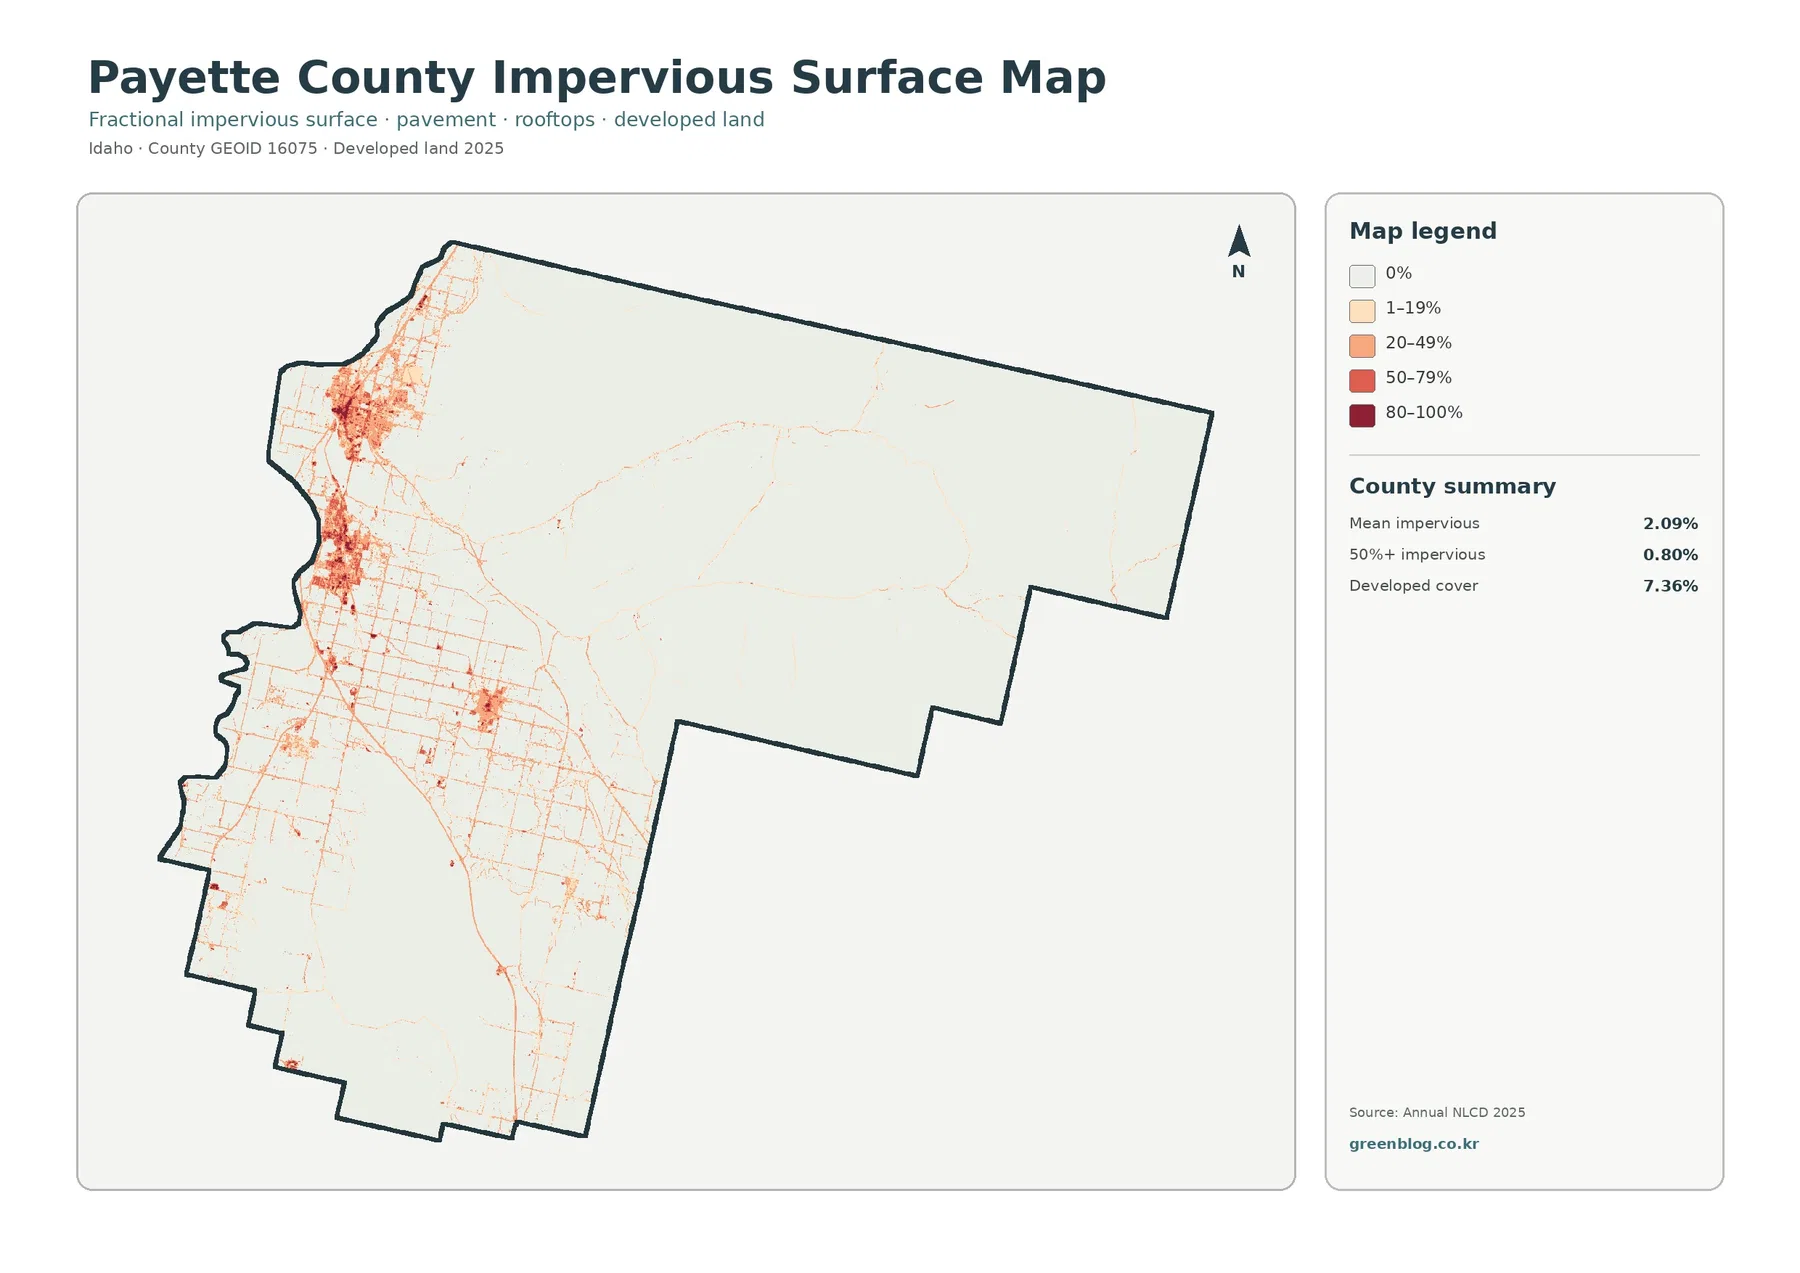
Mean impervious cover is 2.09%, and only 0.80% of the county is mapped at 50% impervious or greater. Both values are much lower than the 7.36% developed share. That difference is expected because developed land-cover classes can include lawns, trees, bare soil, and other permeable surfaces around buildings and roads. The impervious layer narrows the question to roofs, pavement, parking areas, and similar surfaces that resist infiltration.
The darkest impervious tones form several compact groups in the west. The northern group is the strongest, another cluster lies farther south along the western side, and a smaller concentration appears inland. With official city positions for reference, these patterns correspond broadly to the Payette, Fruitland, and New Plymouth areas. Fine lines connect and extend beyond the clusters, but the preview does not label highways or local roads. A line that looks like a transportation route should not be assigned a route number without a road layer.
The vegetation view makes the irrigated river plain easier to follow
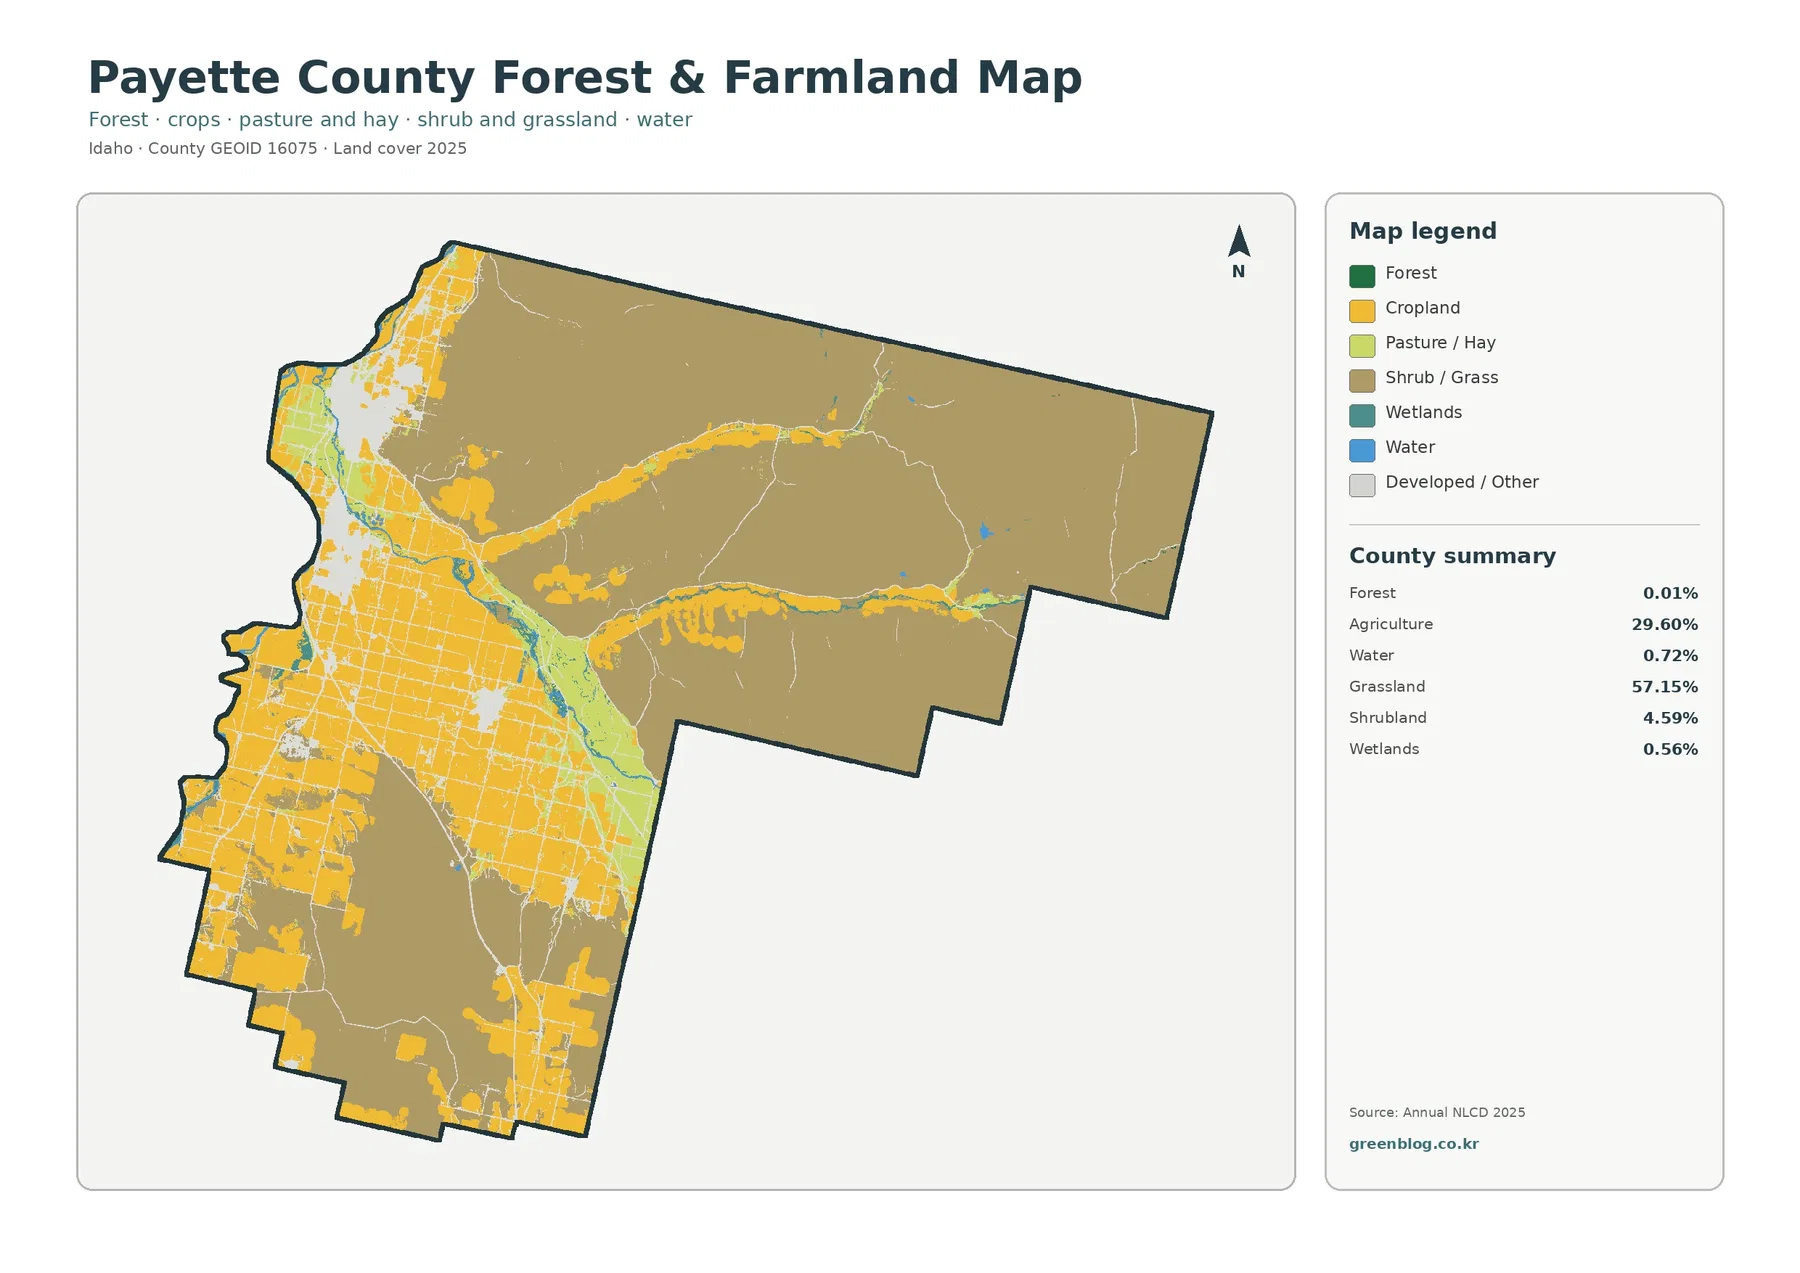
Once developed and miscellaneous surfaces are faded, agriculture becomes especially clear in the western half. Large yellow blocks extend from the northwest through the southwest, while additional cultivated areas follow the interior river corridor and appear in scattered southern patches. The east remains dominated by shrub and grass tones. This version is useful when the goal is to explain where working agricultural land sits relative to the county’s open range-like cover without the red developed class competing for attention.
Forest is almost absent from the county summary at 0.01%. That matters because some brown and greenish areas can look wooded at a quick glance. The legend shows that most of the broad eastern cover is shrub or grass, not forest. Grassland alone is 57.15%, and shrubland adds 4.59%. Payette County is therefore very different from the forest-heavy Idaho counties to the north and east. The supplied map is better read as an open-country and agricultural landscape with limited tree-dominated cover.
The 1985–2025 layer marks class differences, not a single development story
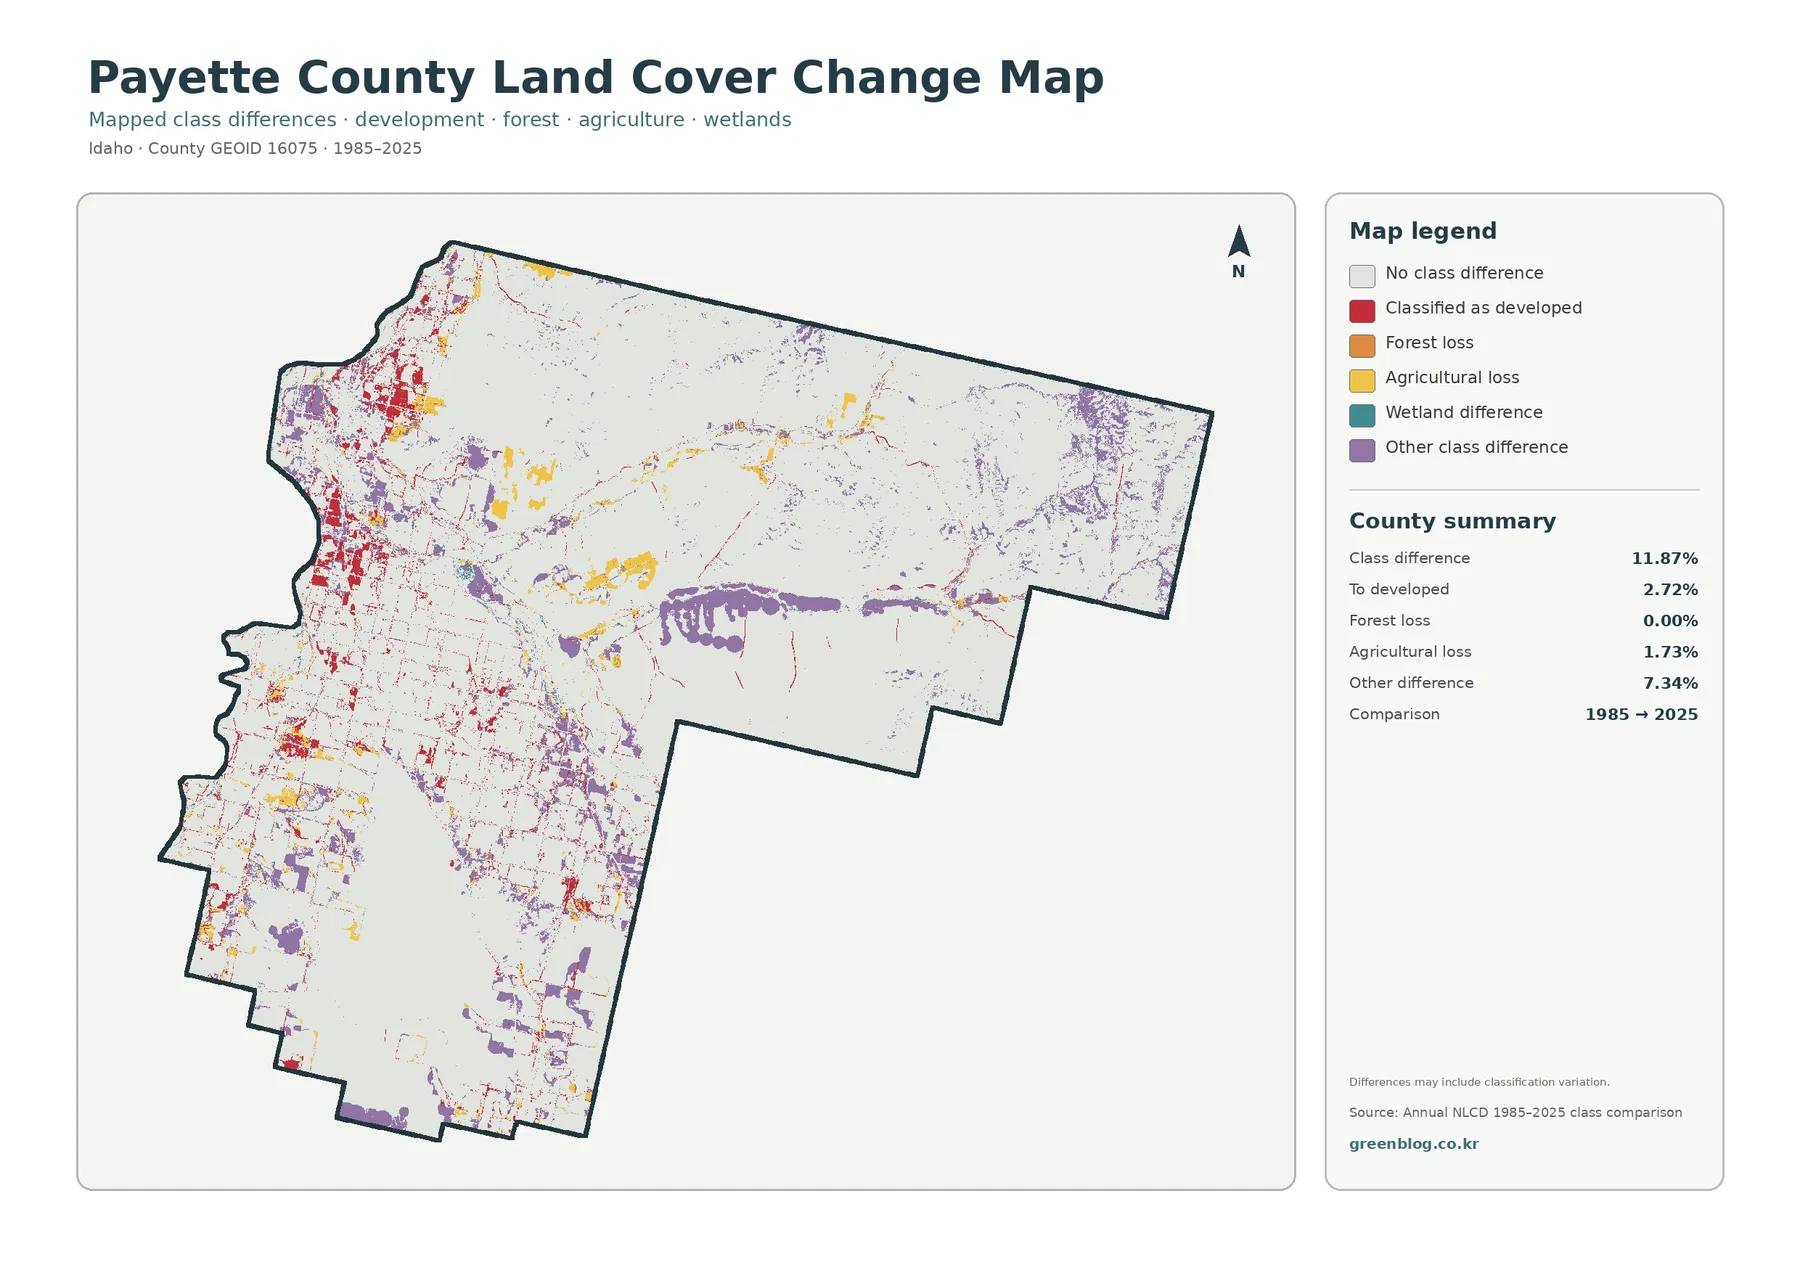
The endpoint comparison reports 11.87% total class difference. Listed components include 2.72% classified as developed, 1.73% agricultural loss, 0.00% forest loss, and 7.34% other difference. Wetland difference appears in the legend but has no separate percentage in the displayed summary. The missing value should not be reverse-calculated and presented as an official statistic. The map also warns that differences may include classification variation, which is essential when interpreting small or scattered cells.
Red conversion-to-developed cells are most visible around the western and northwestern built clusters, with smaller traces elsewhere. Yellow agricultural-loss cells are scattered through the farmed west. Purple other-difference cells occur across a much broader area, including open country away from the main cities. Because the largest listed component is the 7.34% other-difference category, the change map cannot be summarized as an urban-growth map. It records several kinds of class movement between the two endpoints.
“Agricultural loss” means a cell classified as agricultural at the 1985 endpoint received another class in 2025. It does not establish whether the cause was construction, fallowing, crop rotation, vegetation recovery, a water-related change, or classification variation. Similarly, 2.72% classified as developed does not provide the construction year or project name. Intermediate-year imagery, aerial photography, permits, and local planning records are needed to explain a specific location.
Use the maps at county scale and keep the 30-meter grid in mind
Annual NLCD commonly represents the landscape with 30-meter square raster cells. A raster cell is simply one square in the image grid. If crops, a ditch, grass, pavement, and a building share the same square, the product still assigns a predominant class. Straight agricultural edges can therefore resemble survey parcels even though they are not parcel boundaries. Narrow tree rows, canals, farm roads, and small ponds may be absorbed into a neighboring class.
Choose one main map, then add the comparison that answers the next question
For a general county profile, start with the 2025 land-cover view because it shows the 57.15% grassland majority, the 29.60% agricultural share, the western developed clusters, and the water pattern in one image. Use the forest-and-farmland version when the subject is irrigated fields versus open ground. The impervious map is the clearer choice for comparing hard surfaces around Payette, Fruitland, and New Plymouth. Place the 1985–2025 image after a current map so its difference colors are not mistaken for present-day land cover.
Frequently Asked Questions
Is agriculture the largest land-cover class in Payette County?
No. Grassland is the largest class in the supplied 2025 summary at 57.15%, while agriculture accounts for 29.60%. Agriculture looks especially prominent because large field blocks are concentrated in the western half and along river-related corridors rather than spread evenly across the county.
Why is developed cover 7.36% when mean impervious cover is only 2.09%?
Developed land-cover classes can contain lawns, trees, soil, and other permeable surfaces around buildings and roads. The impervious layer focuses on rooftops, pavement, parking areas, and similar hard surfaces, so its countywide mean is lower than the total developed share.
Does the 11.87% class difference mean that much of the county was developed after 1985?
No. The 11.87% total includes several kinds of endpoint differences. Only 2.72% is listed as classified as developed, while 1.73% is agricultural loss and 7.34% is another class difference, with wetland difference also shown in the legend. Classification variation can be included, so the total is not a direct measure of construction or legal land-use conversion.
Sources and Reference Data
- MRLC Annual NLCD Data – official access point for annual land-cover and comparison products
- USGS Annual NLCD Land Cover Classification – definitions and guidance for grassland, agriculture, developed land, wetlands, water, forest, and related classes
- U.S. Census Bureau TIGER/Line Shapefiles – official county-boundary reference for Payette County
- Payette County Official Website – official county information identifying Payette, Fruitland, and New Plymouth
- Payette County 2022 Comprehensive Plan – county planning information on agriculture, growth, and city areas of impact
- Idaho Fish and Game – Payette River WMA – local river and wetland context along the Payette and Snake rivers
Map File Information
The ZIP contains four original JPG maps for comparing Payette County's grassland majority, agricultural river plain, city-area impervious surfaces, water features, and 1985–2025 class differences.
- Included Files: Use only the versions confirmed in the article and supplied images
- File Type: Use the confirmed download contents
- Intended Use: Printing, education, presentations, and map-based projects
Related Maps
Green Map creates custom-edited map images using open geographic data sources such as geoBoundaries, Natural Earth, OpenStreetMap, and government open data.
These maps are edited visual materials, not raw data files, and are provided for education, documents, presentations, and graphic reference.