Owyhee County is a very large southwestern Idaho county where open shrub and grass cover overwhelms the smaller farm, forest, and developed classes. The 2025 summary assigns 60.32% of the county to shrubland and 31.06% to grassland. Forest accounts for 3.30%, agriculture 3.25%, and developed land only 0.89%. The four maps here separate those patterns into a general land-cover view, a forest-and-farmland view, an impervious-surface view, and a 1985–2025 class-difference view.
The four original JPG maps are available together in a single ZIP download after the map explanations. They are useful for printing, classroom work, presentations, and county-scale environmental reference. Land cover describes how the ground surface is classified from satellite-based data; it does not establish parcel ownership, zoning, legal land use, grazing rights, water rights, or whether a property can be developed.
Table of Contents
More than nine-tenths of the county is mapped as shrubland or grassland
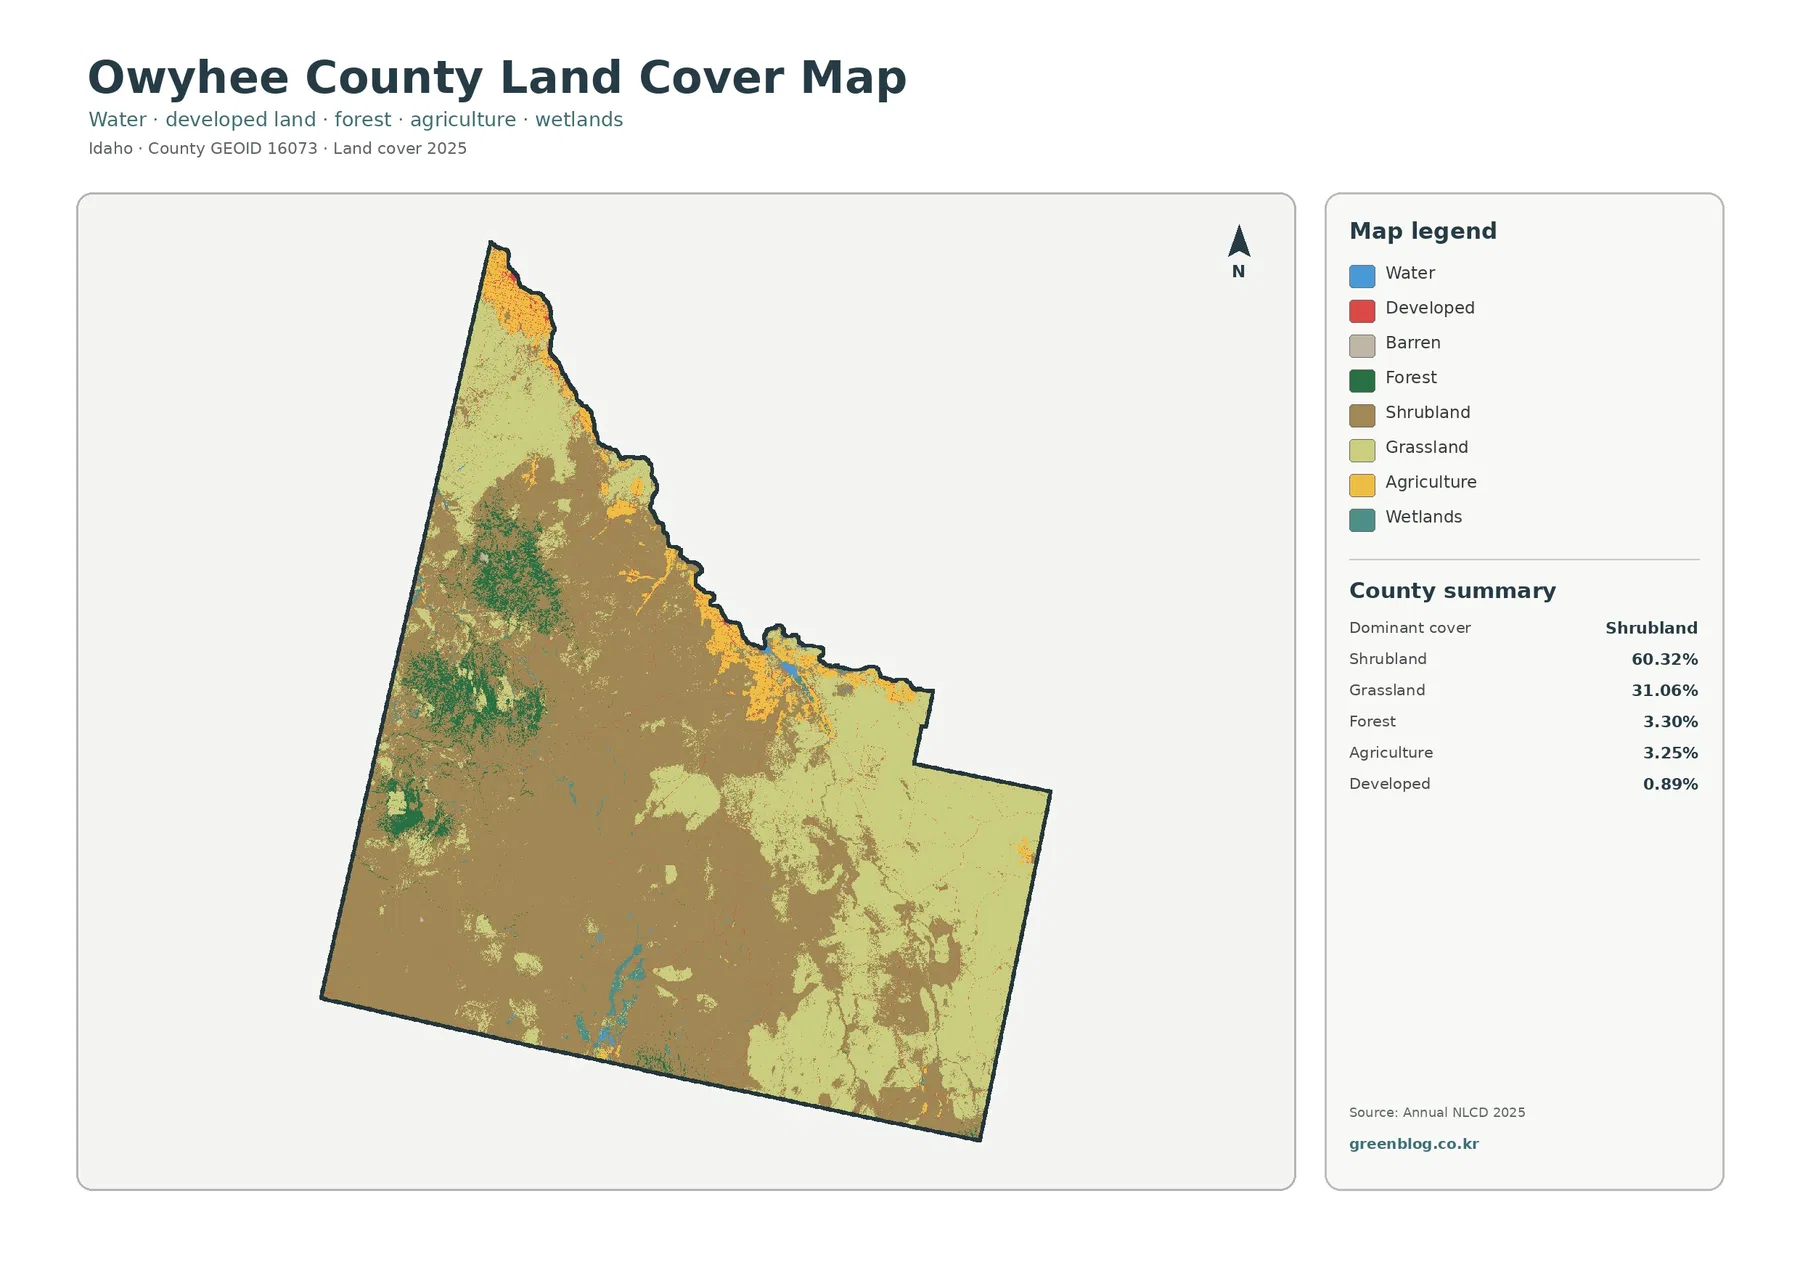
The broadest pattern is visible before any small class is considered. Brown shrubland covers much of the central and southern county and continues through large western and eastern areas. Pale green grassland fills another series of broad blocks, especially toward the north and east. Together, the two open-land classes make up more than 91% of the 2025 county total, so they define the visual background of every other feature on the map.
Grassland and shrubland do not divide the county into two clean halves. Their boundaries are irregular, and many patches sit inside or beside the other class. This matters when comparing different years because modest shifts in vegetation condition or classification can move a cell between similar open classes. The county percentages are valuable for the large picture, but the edges should not be treated like surveyed boundaries.
Impervious cover is extremely low at the county scale
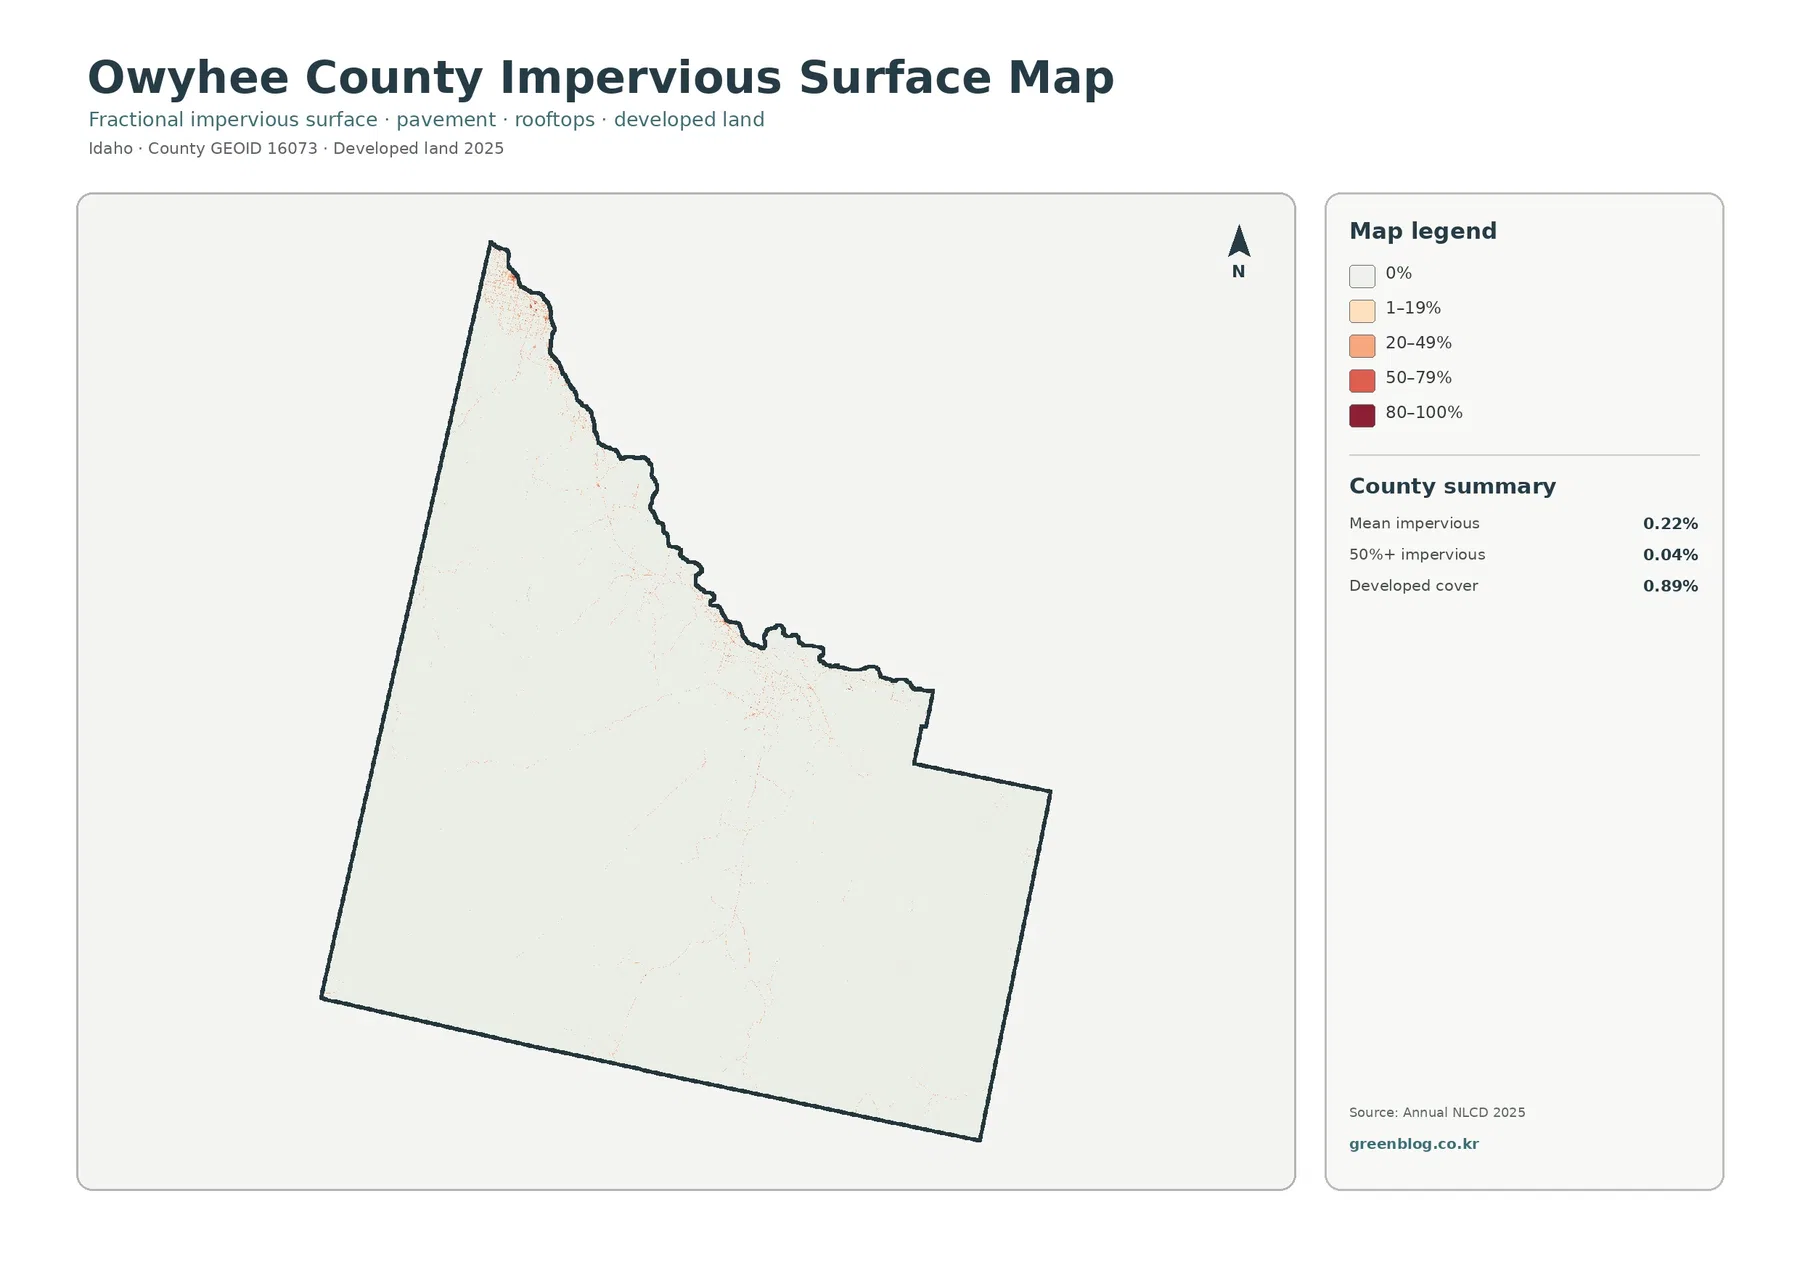
Impervious surface means hard material such as pavement, rooftops, and other surfaces that shed water rather than allowing it to soak readily into the ground. Owyhee County has a mean impervious value of 0.22%, and only 0.04% of the county is mapped above 50% impervious. Developed land covers 0.89%, which is a different measure. A place can be classified as developed while still containing soil, grass, trees, and other permeable ground.
Most of the impervious map is nearly white. Thin warm-colored lines become visible along roads, while the strongest small concentrations occur in the northern part of the county and at a few scattered developed locations. This is consistent with the general map, where development occupies a tiny area against an enormous rural background. The pattern is better understood by looking for lines and clusters than by relying on the countywide mean alone.
A narrow northern farm edge contrasts with the vast open interior
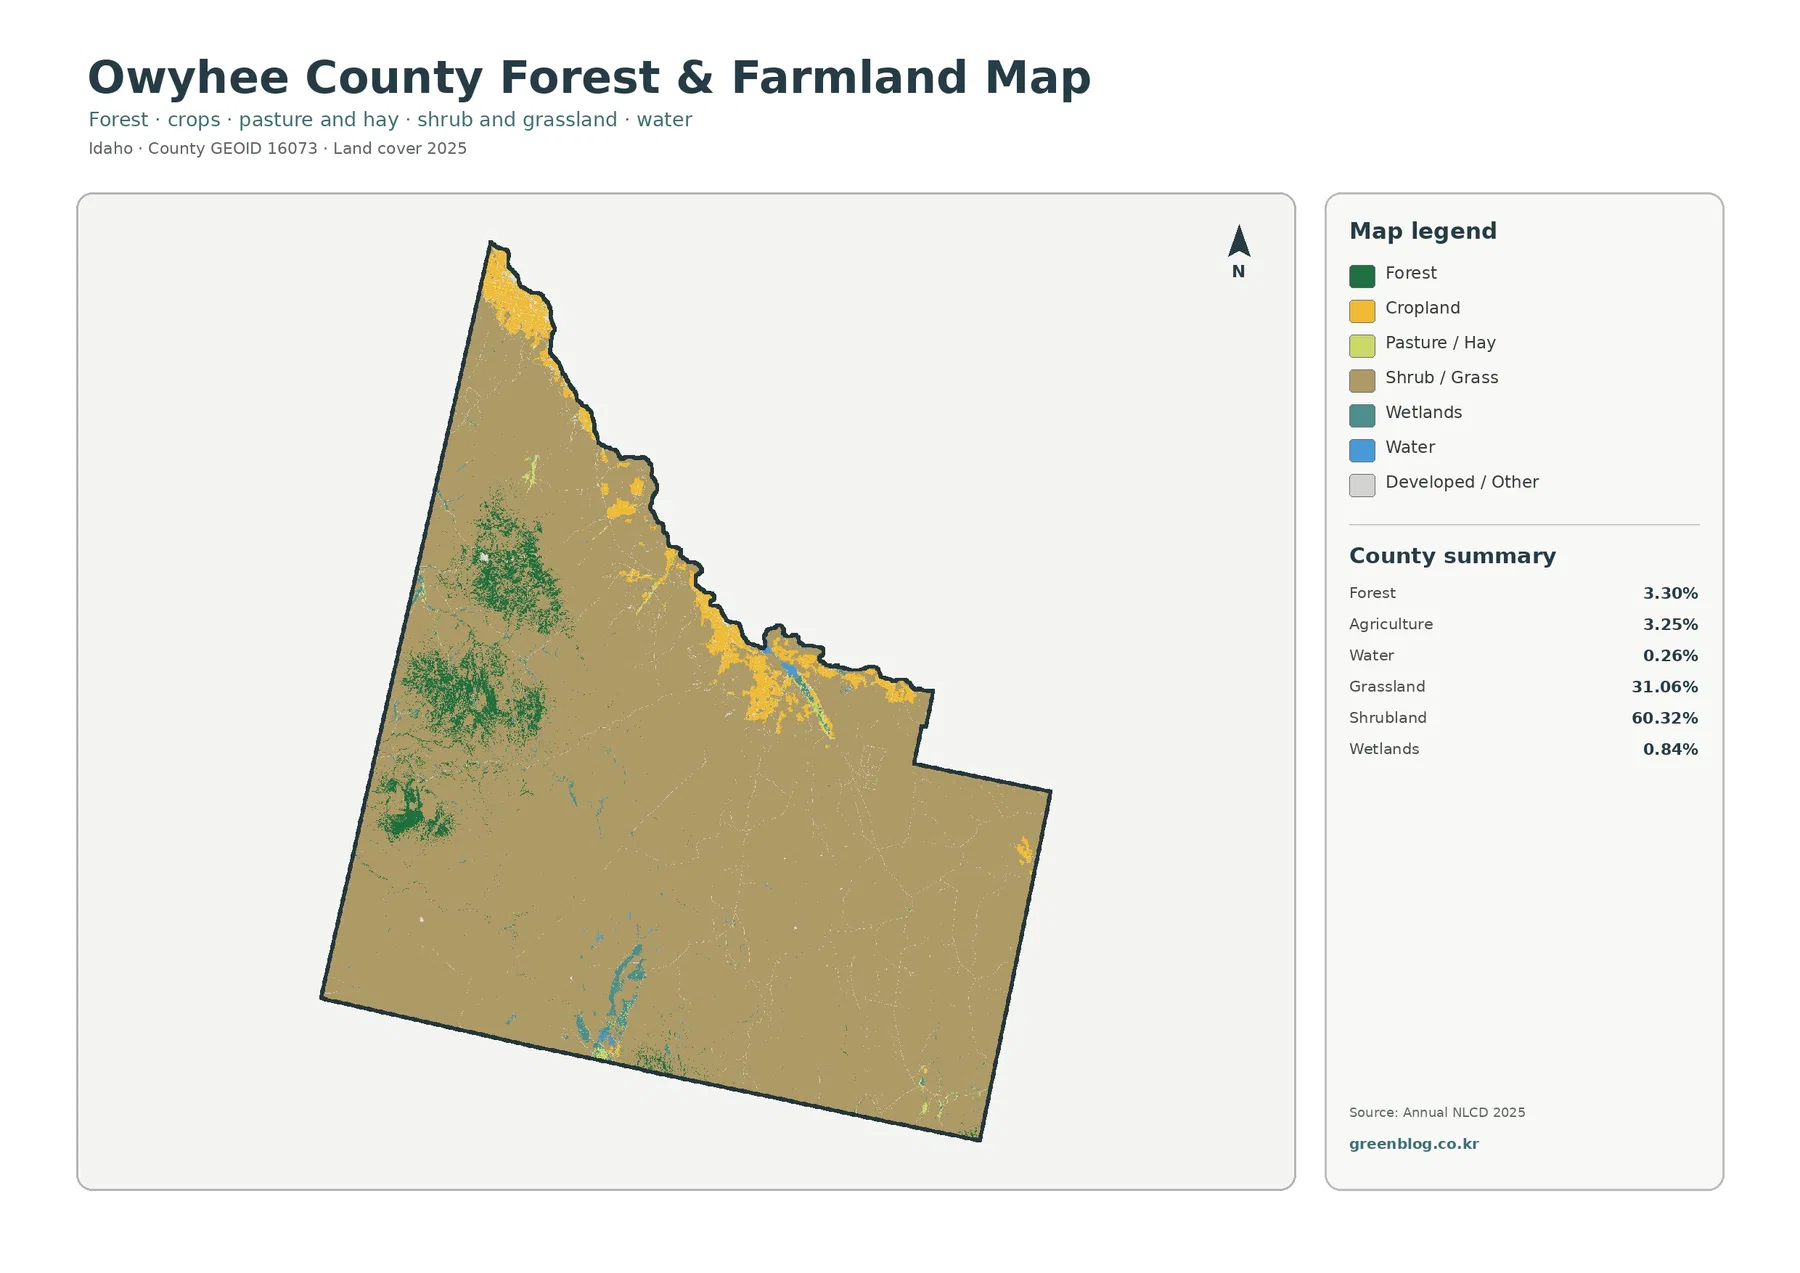
Agriculture covers only 3.25% of Owyhee County, yet it is easy to find because much of it is concentrated near the northern edge. Yellow farm blocks cluster along the Snake River side of the county, while smaller agricultural patches appear in a few eastern and southern locations. The Owyhee Conservation District describes intensive farming in valleys along the Snake River and rangeland grazing as the dominant use at higher elevations. That county-specific context helps explain why a small percentage can still form a conspicuous band on the map.
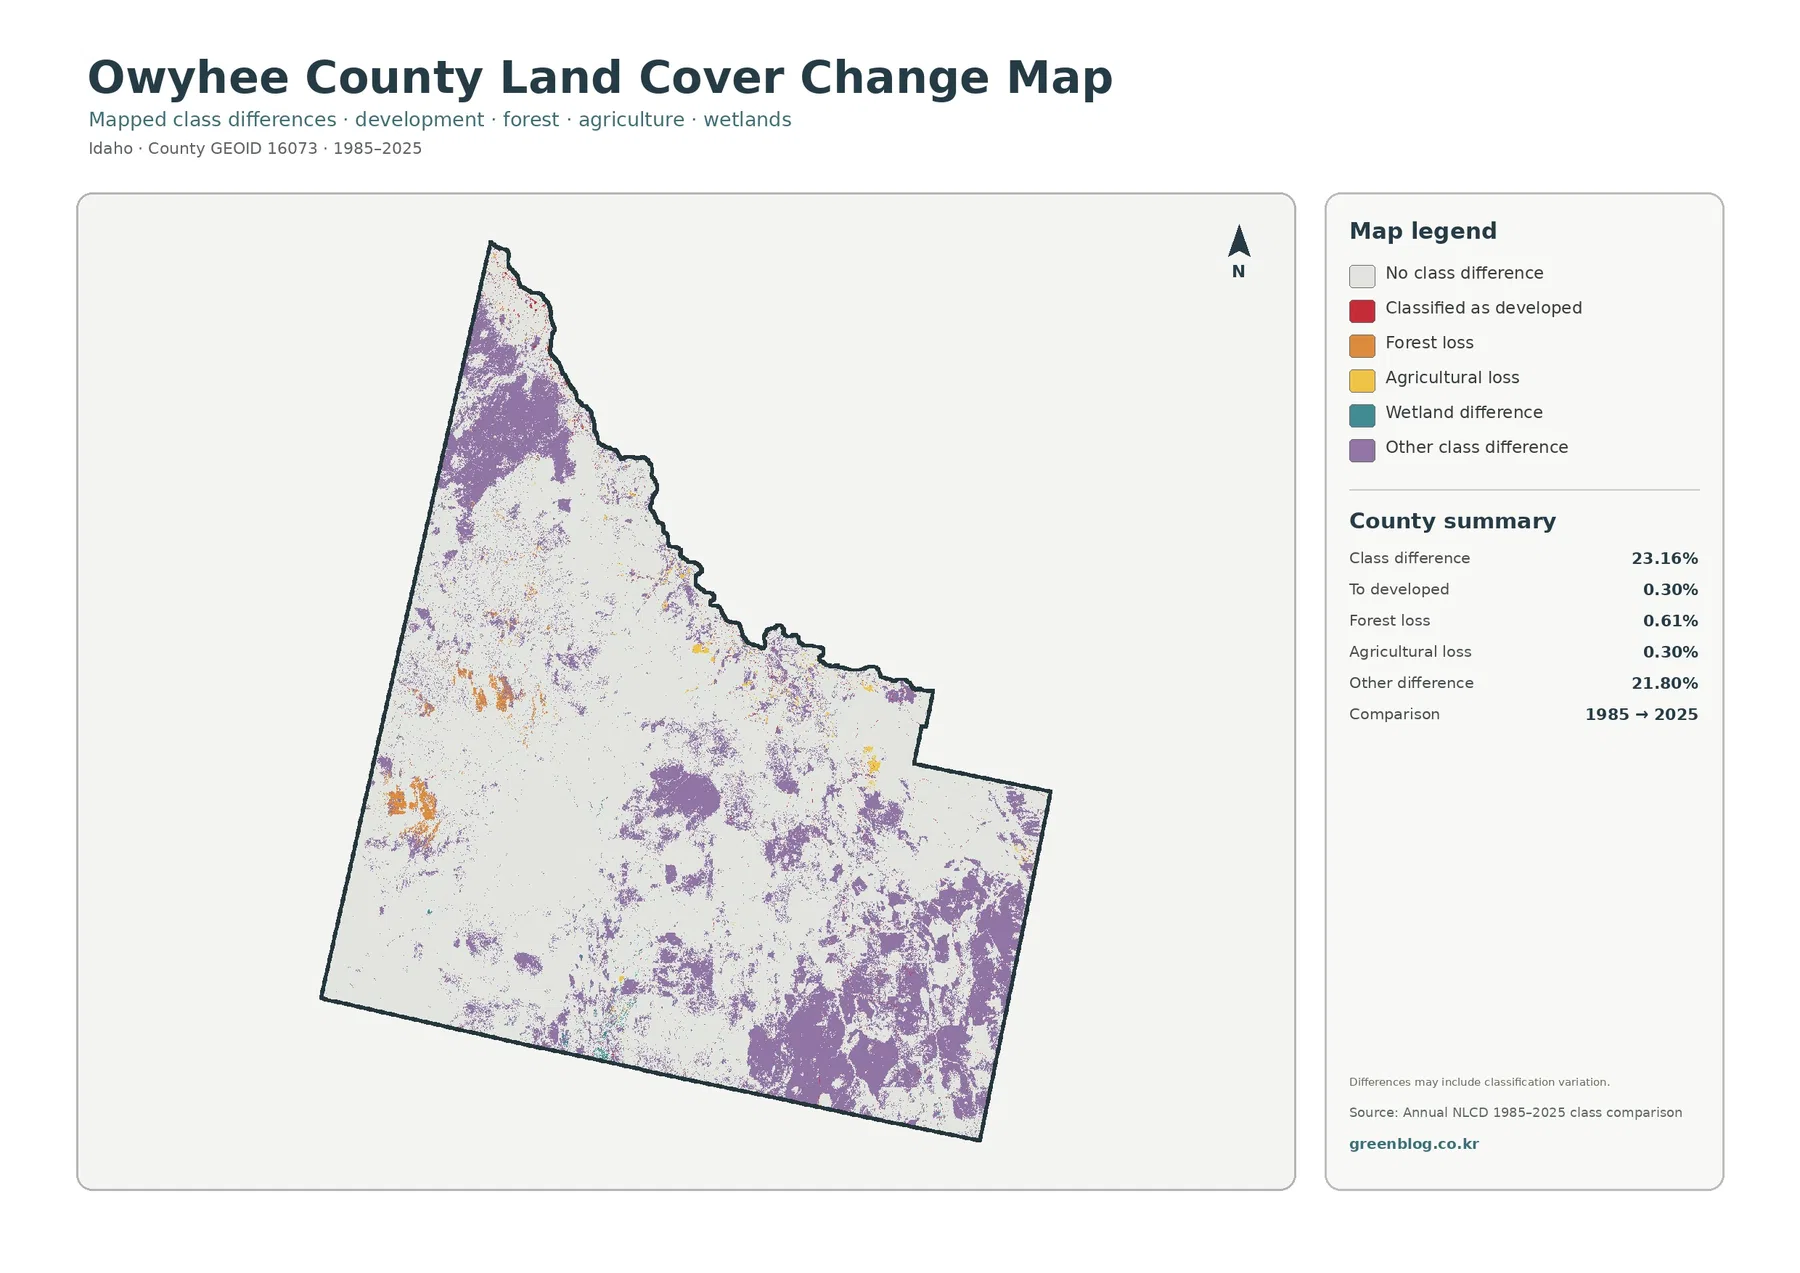
The 1985–2025 map is dominated by “other class difference,” not mapped development
The class-difference map compares the classification assigned to each location in 1985 with the class assigned in 2025. Overall, 23.16% of the county is shown with a class difference. Only 0.30% is categorized as a difference to developed, 0.61% as forest loss, and 0.30% as agricultural loss. The much larger category is “other class difference” at 21.80%.
Purple other-difference areas appear widely in the north, southeast, and several central patches. Because the current map is dominated by shrubland and grassland, differences between open-cover classes are especially important to consider. The change map itself warns that differences may include classification variation. It would therefore be misleading to describe the full 23.16% as confirmed land conversion or disturbance.
Orange forest-loss patches are more localized and can be compared with the western forest clusters on the current forest map. Agricultural-loss and to-developed categories are smaller still. These colors are useful for finding places that deserve a closer look, but the two-date product does not explain the cause or timing of a difference. Intermediate Annual NLCD years, aerial imagery, fire history, agricultural records, or local planning documents may be needed for a specific interpretation.
Forest is only 3.30%, but its western clusters are geographically distinctive
The forest-and-farmland map makes the small forest share easier to see. Dark green is concentrated mainly in western and west-central mountain areas instead of forming a continuous countywide belt. Owyhee County planning material describes forest as being largely confined to the Owyhee Mountains and Range in the western part of the county. The mapped pattern follows that general direction and stands out sharply against the much larger shrub and grass background.
Water accounts for 0.26% and wetlands for 0.84% in this view. The values are small enough that neither class dominates the county map, but blue and teal features occur as narrow lines or small patches near river, reservoir, and drainage settings. Owyhee County planning documents note that surface water occupies less than one percent of the county and identify the Snake, Bruneau, Owyhee, and Jarbidge rivers among the major systems.
These maps work well for county-scale teaching, reference, and first-pass comparison
Water, farms, and development make more sense when the four maps are cross-checked
A useful reading sequence starts with the current land-cover map, then moves to the forest-and-farmland map. The first establishes the countywide shrub-and-grass setting; the second strips away some detail so the small farm belt, forest clusters, wetlands, and water are easier to locate. This sequence prevents a small but bright class from appearing more important than its actual countywide share.
Four original JPG maps are packaged together for download
The download ZIP contains one JPG for general land cover, one for forest and farmland, one for impervious surface and developed land, and one for land-cover class differences. Keeping the four files together makes it easier to compare the same county outline without switching among unrelated sources. The JPGs are practical for printing, slide decks, reports, and offline reference.
A 30-meter classification is a regional reference, not a parcel survey
Annual NLCD land cover is organized as a 30-meter raster. Each cell is assigned a representative class even though the real ground inside that square may contain shrubs, grass, bare soil, a narrow road, a small channel, or several other features. Field edges and thin streams can therefore look simplified, and small patches may disappear into the surrounding class.
Land cover must also be kept separate from legal land information. A shrubland pixel does not tell you whether the land is private, state, federal, protected, leased for grazing, or available for development. Owyhee County provides separate parcel mapping through the Assessor for property-oriented questions. Zoning, permitting, water rights, and management status all require their own official records.
Frequently Asked Questions
What is the dominant 2025 land-cover class in Owyhee County?
Shrubland is the dominant class at 60.32%, followed by grassland at 31.06%. Forest is 3.30%, agriculture 3.25%, and developed land 0.89%, so the county is overwhelmingly mapped as open shrub-and-grass country.
Why is the northern farm area noticeable if agriculture is only 3.25% of the county?
Agriculture is concentrated rather than evenly distributed. The strongest farm blocks sit along the northern Snake River side of the county, while most of the much larger interior is shrubland or grassland. Owyhee Conservation District material also describes intensive farming in Snake River valleys and rangeland at higher elevations.
Does the 23.16% class difference from 1985 to 2025 represent confirmed land conversion?
No. Other class difference makes up 21.80% of the total, while 0.30% is mapped to developed, 0.61% as forest loss, and 0.30% as agricultural loss. Classification variation and shifts among similar open-cover classes can be included, so intermediate years and other records should be checked.
Map File Information
Download the four original Owyhee County land-cover JPG maps together in one ZIP file.
- Included Versions: Land cover, forest & farmland, impervious surface & developed land, land-cover change
- File Type: ZIP containing 4 JPG files
Related Maps
Sources and References
- MRLC – Annual NLCD Data (2025 land-cover data and annual land-cover products)
- U.S. Geological Survey – Annual NLCD Land Cover Classification (land-cover classes and classification guidance)
- Owyhee County – About (county location, communities, size, and local context)
- University of Idaho Extension – Owyhee County (county agriculture, livestock, and range education)
- Idaho Soil & Water Conservation Commission – Owyhee Conservation District (local context on Snake River valley farming and higher-elevation rangeland)
- U.S. Census Bureau – TIGER/Line Shapefiles (official geographic boundary data)
Green Map creates custom-edited map images using open geographic data sources such as geoBoundaries, Natural Earth, OpenStreetMap, and government open data.
These maps are edited visual materials, not raw data files, and are provided for education, documents, presentations, and graphic reference.