This Taylor County Georgia land cover map page provides four county map views for comparing current land cover, forest and farmland, impervious and developed surfaces, and classification differences between 1985 and 2025. Forest is the largest 2025 class at 44.98%, while agriculture, wetlands, and compact developed clusters break up the wooded pattern.
You can view WebP previews below and download the four original JPG maps together in one ZIP. The set is useful for comparing where forest, farms, wetlands, pavement, and mapped class changes occur without treating land-cover class, impervious surface, and long-term change as the same measurement.
Table of Contents
Forest covers 44.98%, yet farm, wetland, and open-land patches repeatedly interrupt the wooded blocks
The supplied summary places forest first at 44.98% of the mapped area. Agriculture accounts for 17.11%, wetlands 10.67%, grassland 9.37%, and developed cover 7.83%. The forest-and-farmland panel also reports shrubland at 7.76% and open water at 0.70%. Barren land appears in the legend, but no separate percentage is printed for it, so an unreported remainder is not assigned to that class.
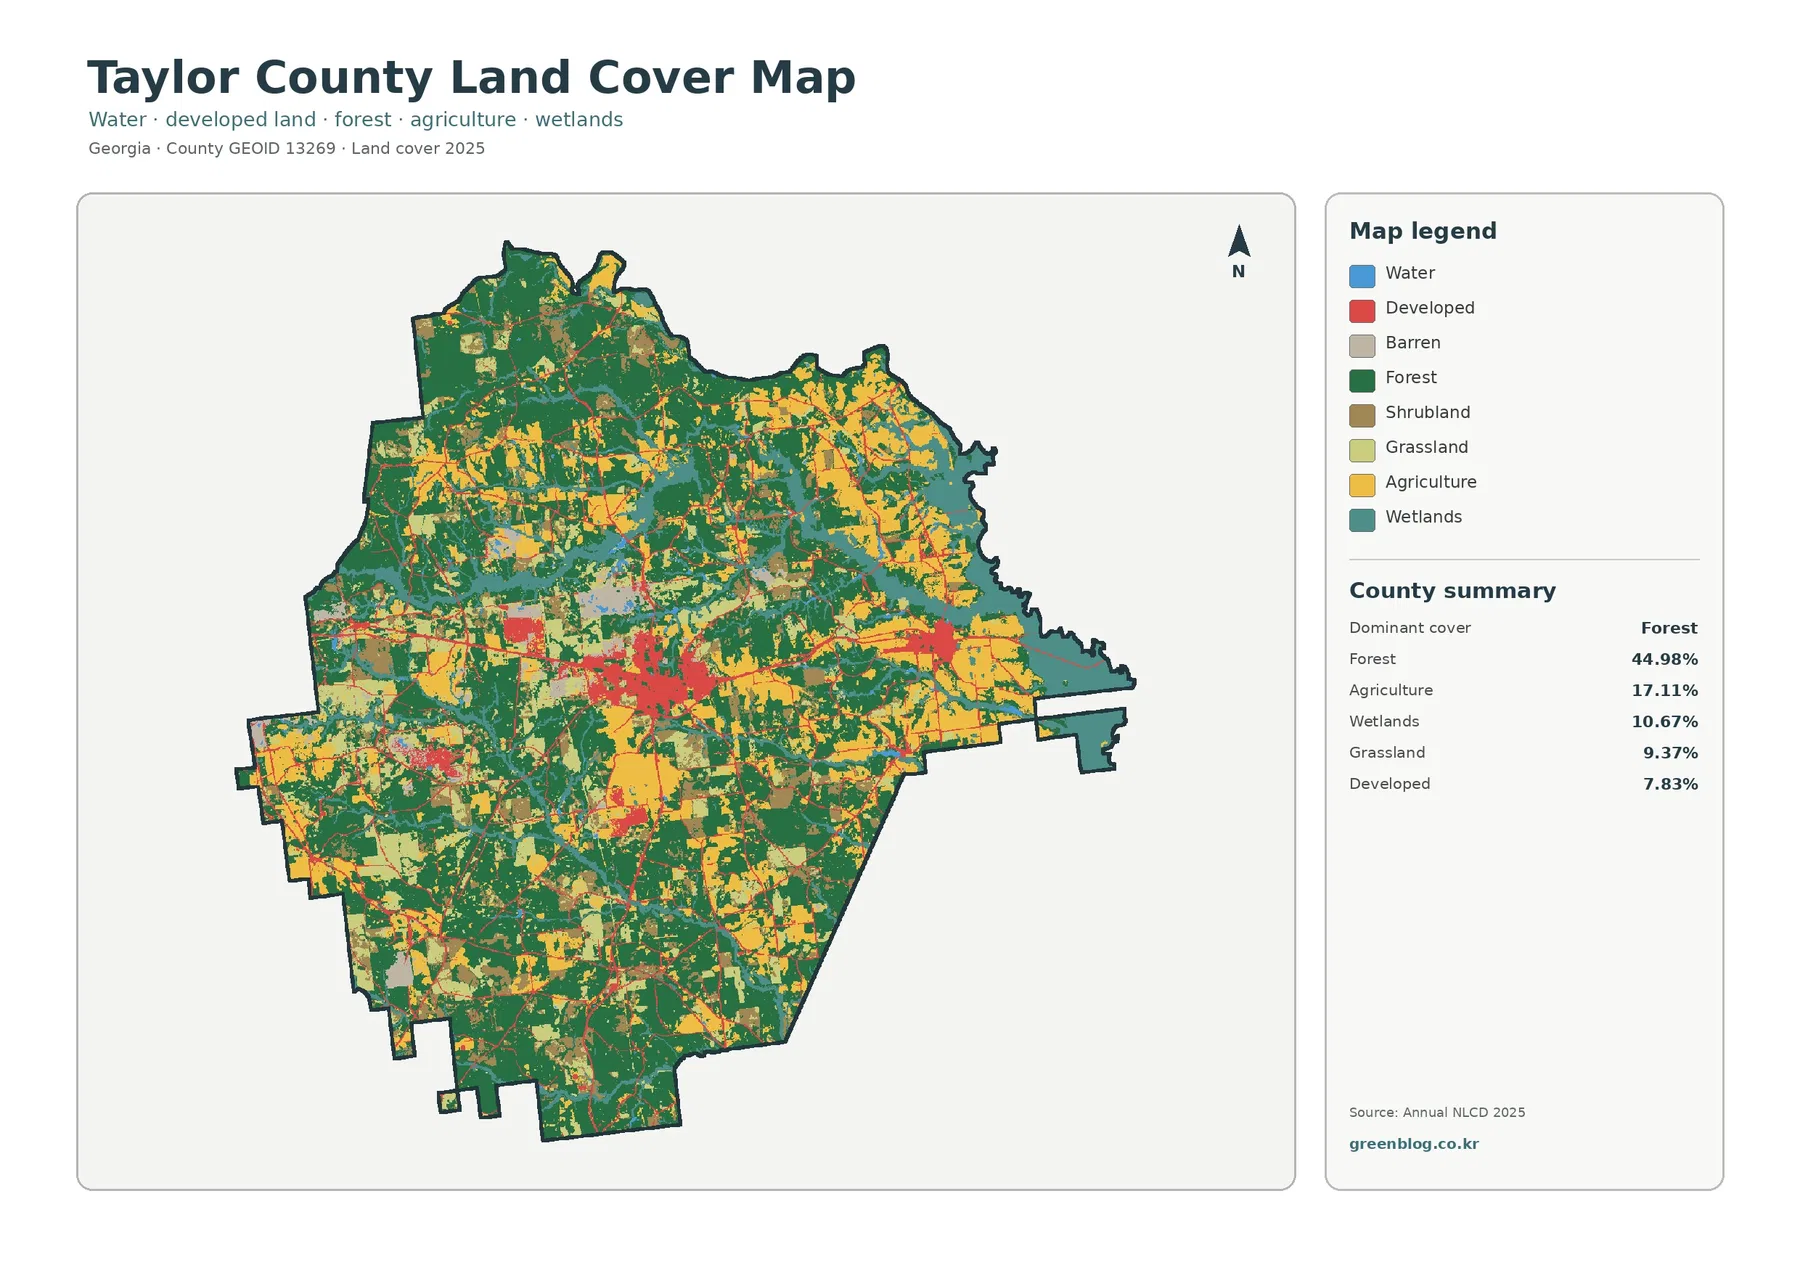
Dark-green forest occupies broad areas in both the northern and southern portions of the county, but yellow agriculture cuts into those blocks in several directions. The eastern and northeastern side contains some of the most obvious farm concentrations, with additional large patches in the southwest and smaller openings near the center. Light-green grassland and brown shrubland appear around and between those farm areas, which is why every bright rural patch should not be labeled as cropland.
Red developed cover forms a different geometry. Instead of covering a broad side of the county, it gathers into a pronounced central cluster, a smaller eastern cluster, and narrow connecting lines. No municipal boundaries or road names are printed on these images, so the visible red features are described by position rather than assigned to a named city or highway without a separate base map.
Teal wetlands are also spatially distinctive. They trace an irregular pattern along parts of the eastern edge and recur through the interior, while blue open-water cells occupy much less area. The 10.67% wetland share therefore describes something very different from the 0.70% open-water figure. Neither class should be treated as a regulatory boundary, flood zone, or parcel-level restriction.
| 2025 map summary | Share |
|---|---|
| Forest | 44.98% |
| Agriculture | 17.11% |
| Wetlands | 10.67% |
| Grassland | 9.37% |
| Developed | 7.83% |
| Shrubland | 7.76% |
| Water | 0.70% |
Reading the percentages beside the shapes gives a more faithful picture of Taylor County than either view alone. Forest is numerically dominant, yet farm and wetland cover fragment it in visible places. Developed land is smaller in total share but easier to notice because it is concentrated. The summary tells how much of each class is present; the map shows where those classes gather and how they meet.
Agriculture at 17.11% is most obvious in eastern, northeastern, and southwestern patches
The forest-and-farmland layer isolates woods, cropland, grass, shrub cover, wetlands, and water so their rural pattern can be compared directly. Forest remains much larger than agriculture, but grassland at 9.37% and shrubland at 7.76% add another substantial share of open cover. In Taylor County, those classes matter because they repeatedly appear between forest blocks and around the larger farm patches.
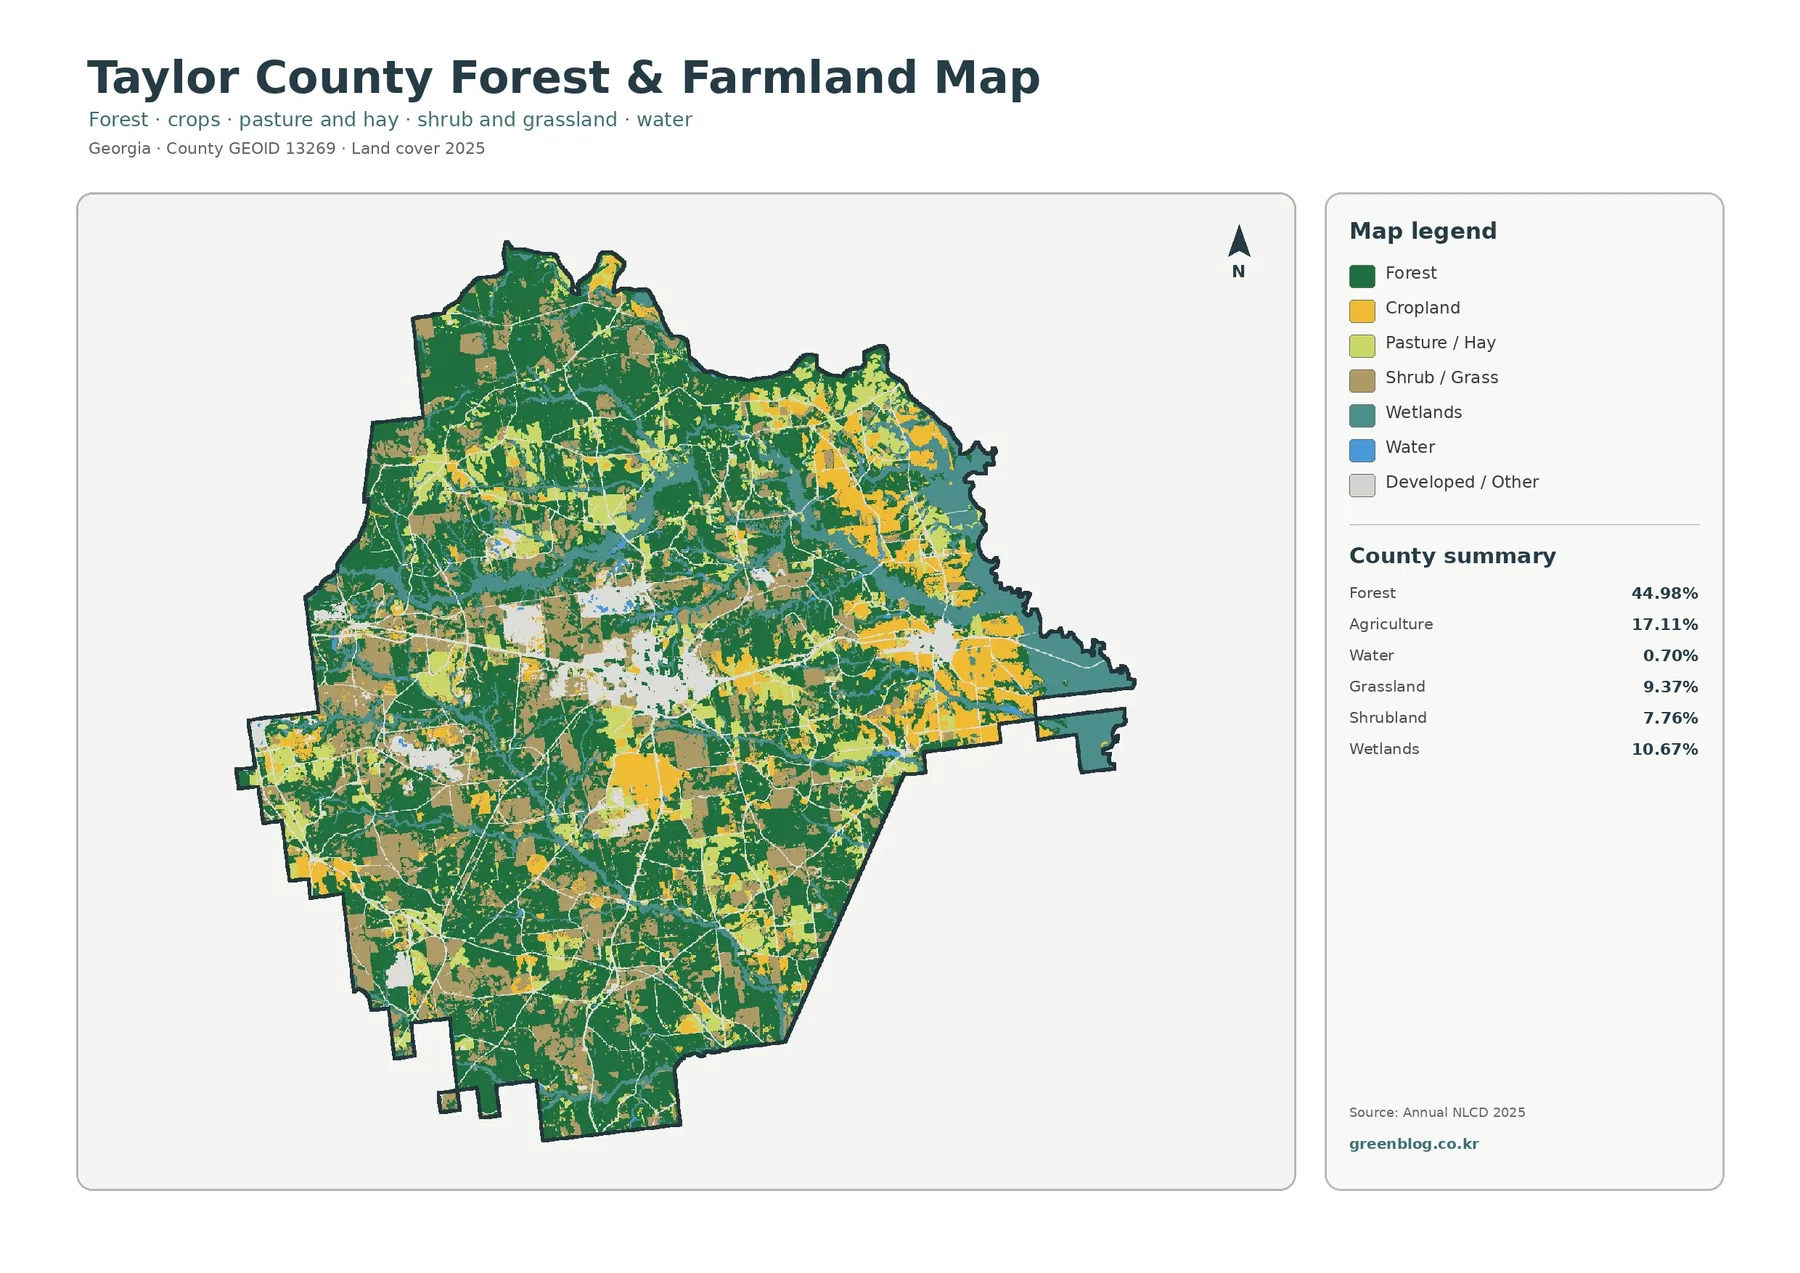
Large yellow areas stand out toward the east and northeast, while the southwest contains another notable agricultural concentration. Smaller openings occur closer to the center. Wooded cover fills much of the space around those fields, and grass or shrub pixels often mark transitions rather than clean borders. The visual result is a mixed rural mosaic, not a simple split between a forest half and a farming half.
UGA Extension Taylor County describes the county as part of Georgia’s Fall Line and notes a varied agricultural and natural-resource setting that includes horticultural crops, cotton and other row crops, cattle, and pine. That local context helps explain why forest and working rural cover both deserve attention. It does not turn an Annual NLCD agriculture cell into a peach orchard, cotton field, or any other specific commodity.
Keep the evidence sources separate: the land-cover layer shows where agricultural cover is mapped, while agricultural records describe what is produced there. The same caution applies to forest. A large green patch identifies forest cover at the classification scale, but it does not specify tree species, timber management, ownership, or conservation status. Those questions need more specialized records.
Wetlands at 10.67% occupy far more area than the 0.70% open-water class
At 10.67%, wetlands occupy enough of the county that combining them with open water would hide an important part of the landscape. Teal wetland cells appear as broad patches and narrow irregular bands, particularly along the eastern side and in several interior areas. Blue water cells are much less extensive. The two colors should remain separate in charts, captions, and classroom explanations.
A wetland-class cell can include wet soils and wetland vegetation without being a permanent open-water surface. By contrast, the water class is intended to represent open water. That separation helps locate areas where wetland cover is common, but it does not replace a regulatory wetland determination, a flood-insurance map, or a field survey.
Adjacency also needs restraint. Forest touching a wetland patch does not reveal why the site is wet, how often it floods, or what its drainage characteristics are. Elevation, soils, hydrology, rainfall, and site observations would be needed for those questions. Here, the land-cover layer simply marks where wetland-class surfaces recur at county scale.
The central and eastern built clusters stand out even though mean impervious surface is only 1.61%
Developed cover represents 7.83% of the current land-cover summary, yet the impervious layer reports a countywide mean of only 1.61%. Areas where at least half of a raster cell is impervious account for just 0.36% of the county. Those numbers are compatible because a developed cell may contain lawns, trees, soil, and other permeable ground along with buildings and pavement.
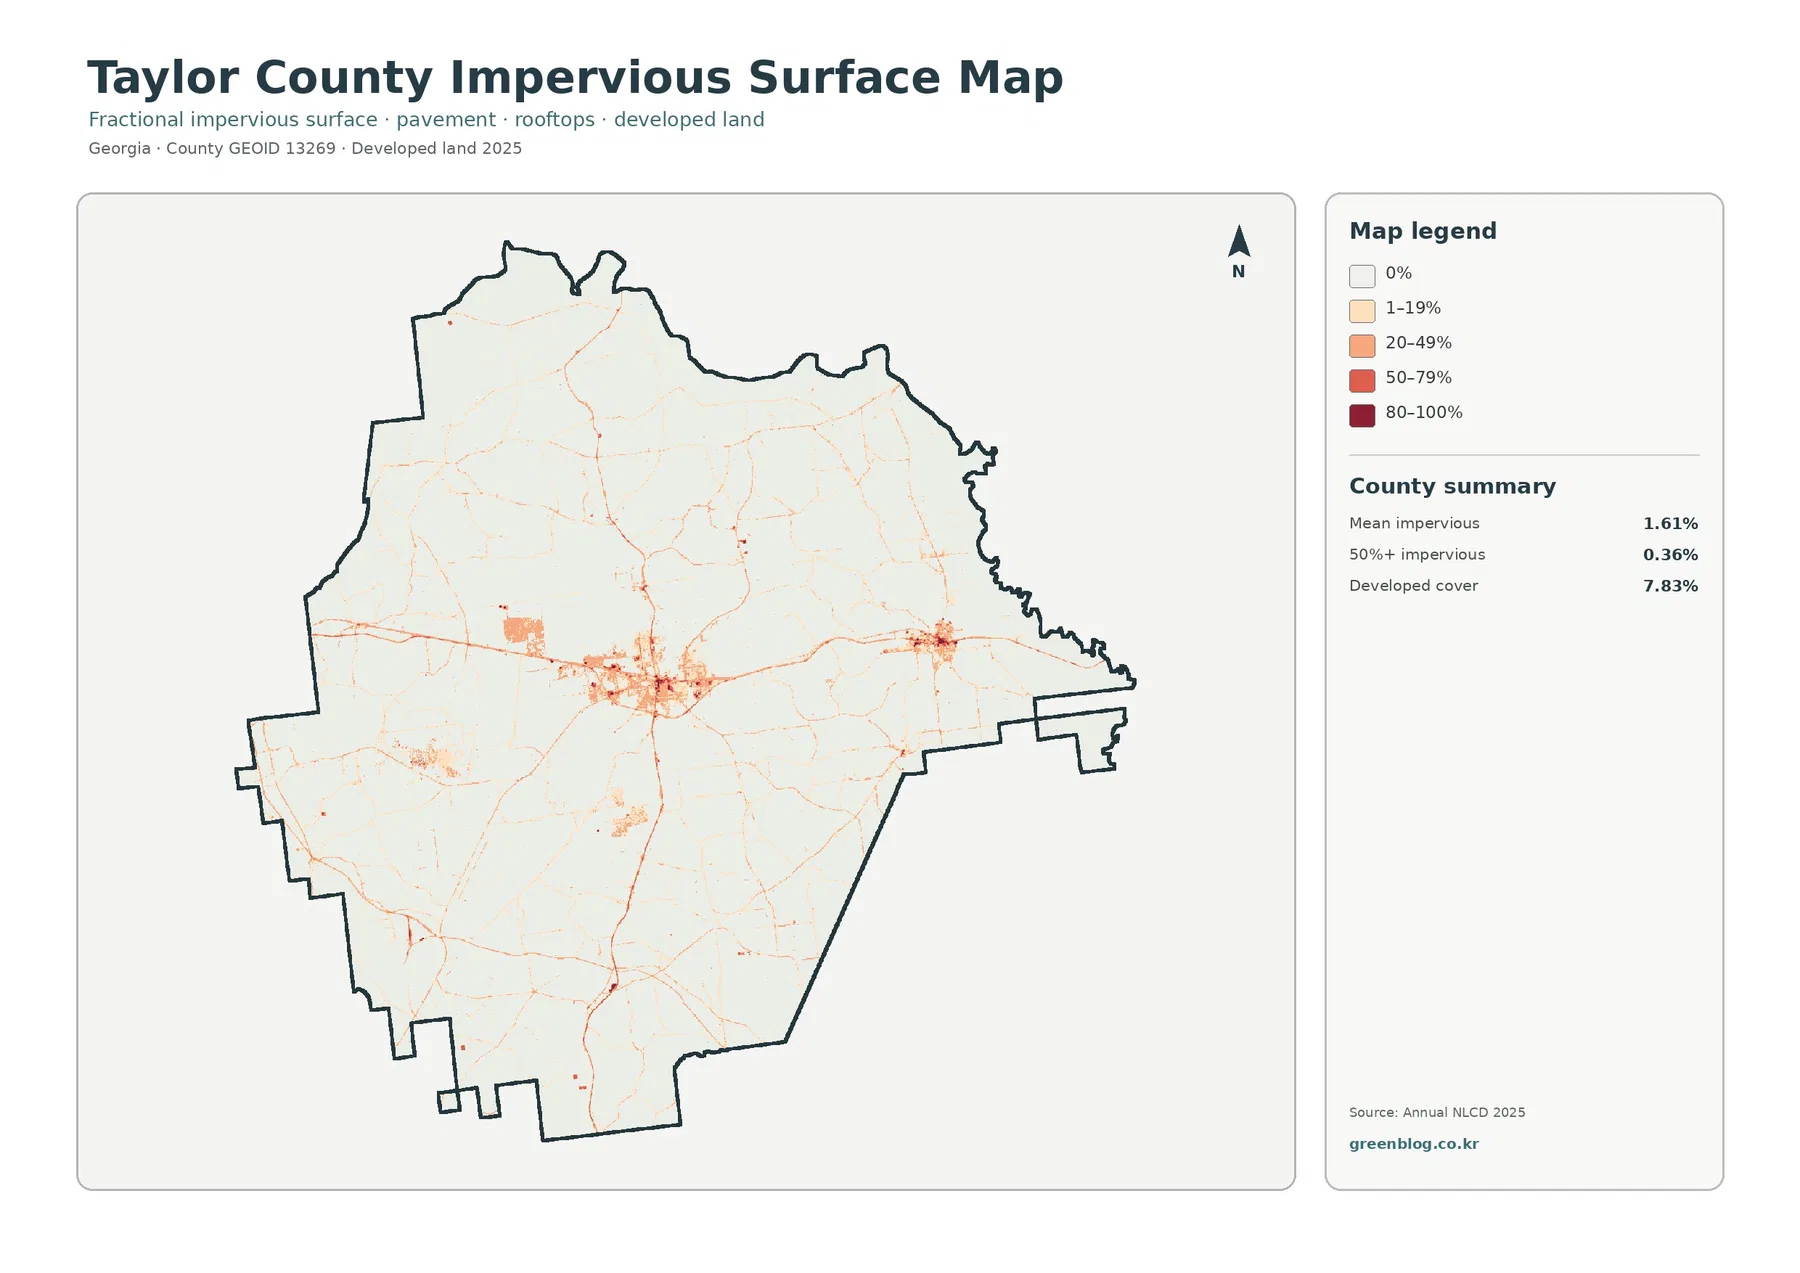
The strongest orange and red impervious values gather near the middle of the county. A smaller concentration appears farther east, while thin lines extend across otherwise lightly impervious rural areas. Most forest and farm sections remain very pale. That contrast explains how a few visible settlement and road concentrations can coexist with a low countywide mean.
Taylor County’s official website identifies Butler and Reynolds as the county’s principal cities. Those names matter when the layer is compared with a labeled map, but neither city boundary is printed on the supplied land-cover images. Assigning the central red cluster to Butler or the eastern cluster to Reynolds should therefore be done only after matching the county outline against a boundary or road map.
A 1.61% mean should not be read as if every location is 1.61% paved. Large rural cells have zero or very low impervious fractions, while small areas around built clusters and roads reach much higher classes. For runoff or drainage screening, the concentrated higher-value zones matter more than the county average; actual flood or drainage analysis still requires terrain, soils, rainfall, and infrastructure data.
Only 2.30% is mapped as changing to developed within a 43.04% total 1985–2025 class difference
The change layer compares the 1985 and 2025 endpoint classifications rather than measuring one single process. The change panel reports 43.04% total class difference, 2.30% changing to developed, 12.86% forest loss, 5.11% agricultural loss, and 22.33% other class difference. A wetland-difference category appears in the legend without a separate percentage, so no remainder is calculated and labeled as wetland change.
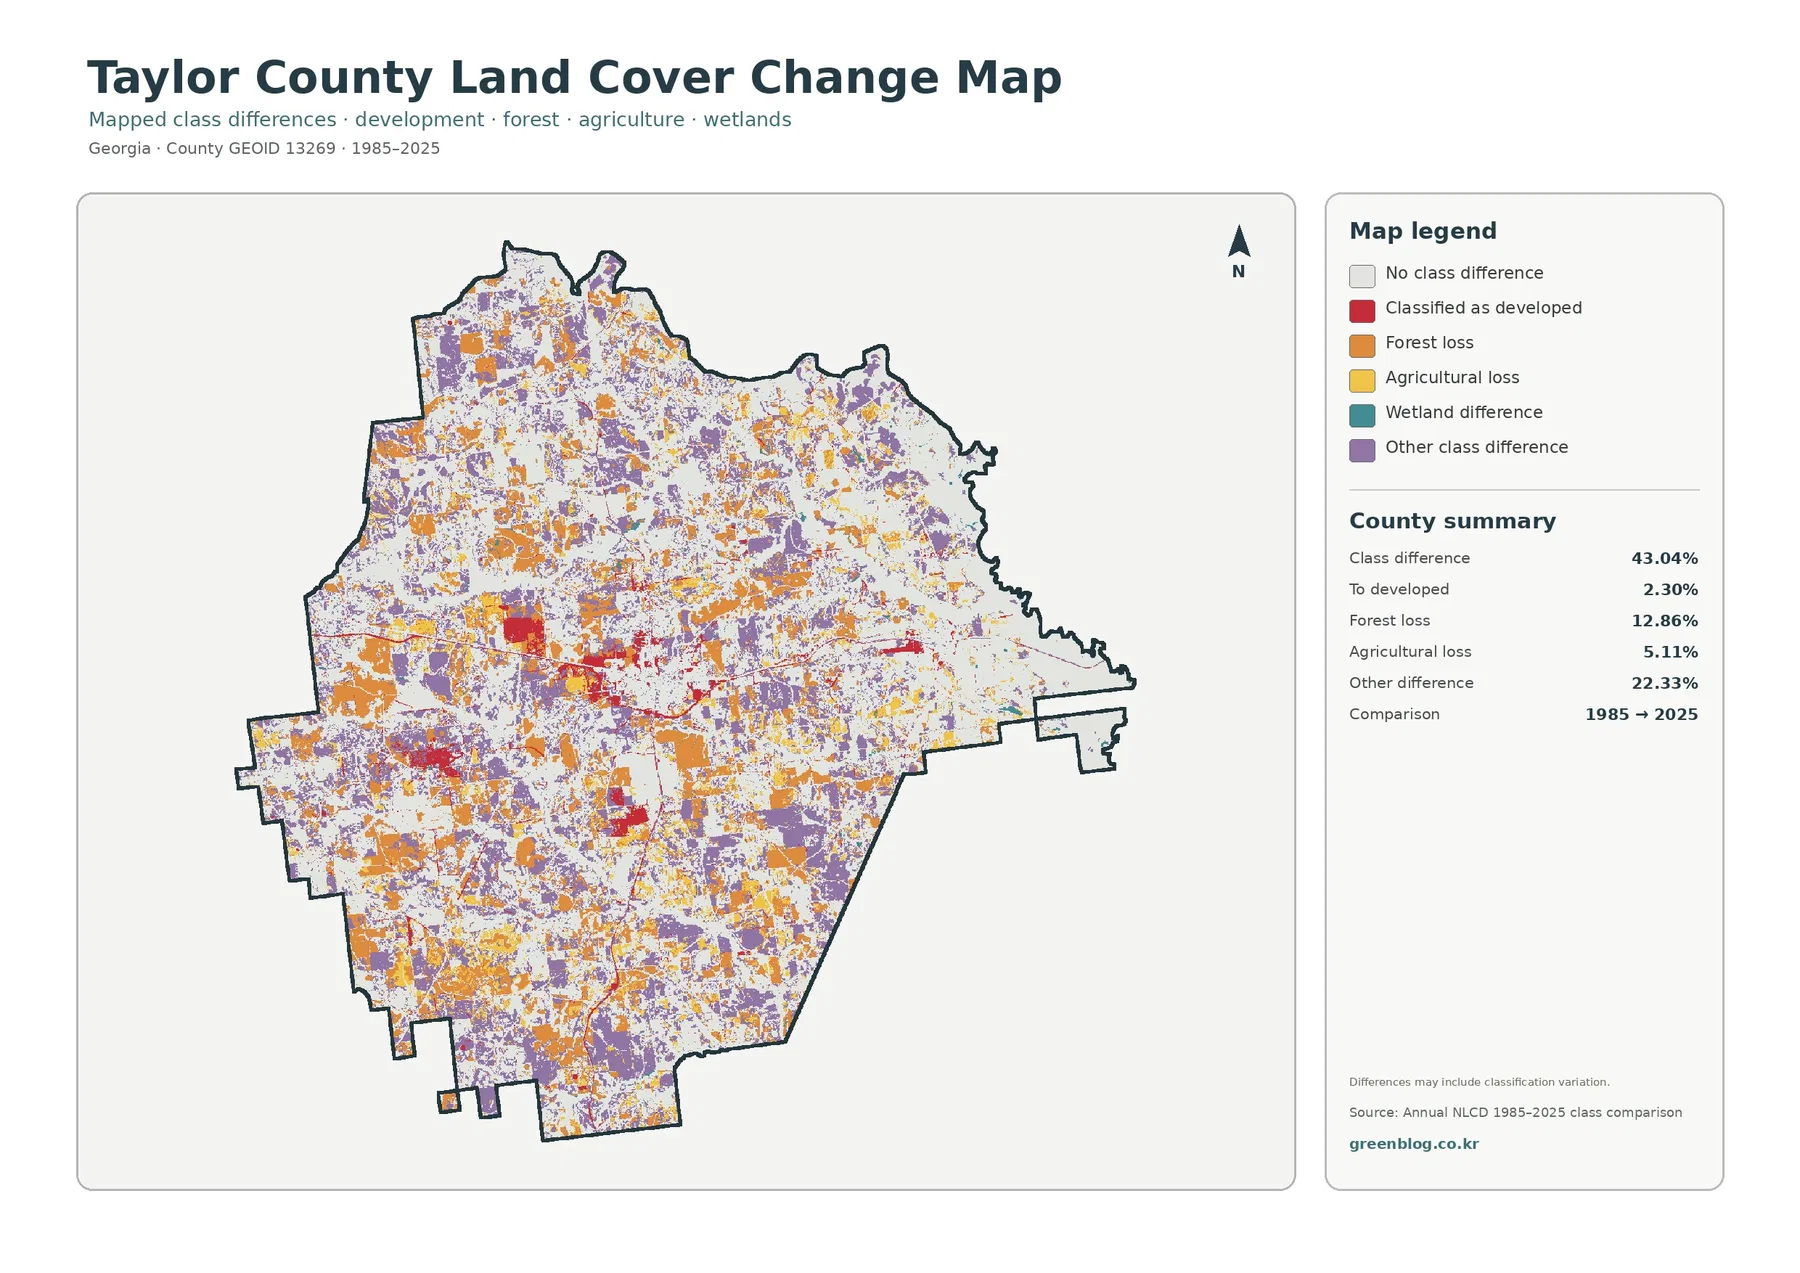
Orange forest-loss cells and purple other-difference cells are scattered broadly, often in patches of many sizes. Red developed-change cells appear around some of the strongest present-day built concentrations and in a few smaller places, but they represent only a small fraction of the total colored area. Calling the full 43.04% an urbanization rate would therefore misstate what the layer measures.
The 12.86% forest-loss category also needs context. A difference between two classified endpoints may include real clearing or conversion, but it can also reflect harvest and regrowth cycles, image timing, mixed pixels, vegetation condition, or classification variation. The supplied change map warns that classification variation can be part of the result, so a specific Taylor County patch should not be assigned a cause without intermediate-year imagery and independent records.
Agricultural loss at 5.11% is a cover-transition measure, not a 5.11% decline in farm income, farm numbers, or commodity production. Current Extension material describes agricultural activity in the county, but it cannot explain why an individual pixel changed class. Economic statistics and mapped surface classifications answer different questions.
Other class difference, at 22.33%, is the largest named component in the summary. Purple cells combine multiple transitions rather than one event, so they should not be relabeled as wetland loss, forest conversion, or agricultural expansion without more detailed information. Annual NLCD time steps or a transition matrix would be needed to identify direction and timing.
Butler and Reynolds require a labeled reference map because city names are not printed on these four images
Local context comes from sources that the land-cover graphics do not contain. The county website and the Georgia DCA comprehensive-plan page identify Taylor County together with Butler and Reynolds, while the supplied map images show only the county outline, class colors, legends, and summary panels.
For that reason, a red cluster is not named solely from its appearance. A labeled road map or Census TIGER/Line boundary layer can be aligned with the county outline before a city name is attached to a feature. This keeps the local explanation specific without inventing labels that are absent from the source image.
The Fall Line description from UGA Extension adds geographic background, but elevation and soil classes are not drawn on these land-cover maps. Explaining a specific field or forest block as the product of a particular soil or elevation would require separate terrain and soil data.
Pair the four views according to the question instead of shrinking all of them into one small panel
A county overview can begin with current land cover because the 44.98% forest share, 17.11% agriculture, 10.67% wetlands, and compact developed areas appear together. When the topic shifts to rural cover, the forest-and-farmland layer separates agriculture from grassland and shrubland. For settlement or pavement, the impervious layer is more direct because it shows hard-surface concentration rather than only a developed class.
For long-term comparison, place the current map beside the 1985–2025 change layer. The pairing lets a reader see present forest, farm, wetland, and developed cover while locating endpoint differences nearby. Labeling 43.04% total class difference and 2.30% change to developed separately prevents the most important numerical misunderstanding.
Legends and summary panels should remain visible in documents and slides. Red means current developed cover on the general map, but red marks change to developed on the change map. Removing the legend can make two correctly drawn images mean something different to the reader. One or two maps per slide usually leaves enough room for Taylor County’s narrow impervious lines and smaller change patches to remain legible.
Native JPG size and 30-meter raster cells define how far the maps can be enlarged or interpreted
Each original JPG in the download is 2480×1754 pixels, while the article previews are 1800-pixel WebP images. The asset manifest does not mark the JPGs as meeting an A3 high-resolution reference. They work well for screen viewing and many document or presentation layouts, but a large printed output should be tested at its intended size before production.
Annual NLCD products generalize the landscape into raster cells at roughly 30-meter scale. Trees, lawn, a narrow road, part of a building, and bare soil can all occur inside one cell even though the final product assigns a representative class or impervious fraction. The raster scale supports countywide comparison; it does not support parcel surveying, building outlines, zoning, or development-right decisions.
The current layers are labeled for 2025, and the change layer compares 1985 with 2025. Construction, clearing, regrowth, or farm changes after the 2025 observation period are outside this package. Any decision that depends on present site conditions should add recent aerial imagery, current county records, and field verification when necessary.
Frequently Asked Questions
Why does 44.98% forest not look like one continuous forest block in Taylor County?
Agriculture, wetlands, grassland, and shrubland repeatedly interrupt the wooded areas. Large farm patches are especially visible in the east and northeast, another concentration appears in the southwest, and smaller openings occur near the center. The countywide percentage describes total area; the map shows how that area is broken into separate shapes.
Does the 43.04% 1985–2025 class difference mean that 43.04% of Taylor County became urban?
No. Only 2.30% is reported as changing to developed. The same summary lists 12.86% forest loss, 5.11% agricultural loss, and 22.33% other class difference, and the map warns that classification variation may be included. The 43.04% total is an endpoint classification difference, not an urbanization rate.
Can Butler and Reynolds be identified directly on the supplied land-cover maps?
Not reliably from these images alone because city names and municipal boundaries are not printed on them. The safest method is to align the county outline with a labeled road or Census boundary map, then compare the central and eastern built clusters against the verified city locations. Map File Information The ZIP contains four original Taylor County JPG maps: current land cover, forest and farmland, impervious/developed land, and 1985–2025 land-cover change.
Map File Information
Download the map files associated with this page for reference, printing, and compatible visual projects.
- Included Files: Use only the versions confirmed in the article and supplied images
- File Type: Use the confirmed download contents
- Intended Use: Printing, education, presentations, and map-based projects
Related Maps
- Appling County Georgia Land Cover Map
- Atkinson County Georgia Land Cover Map
- Bacon County Georgia Land Cover Map
Sources and references
- MRLC Annual NLCD – Official documentation and access information for Annual NLCD land-cover, impervious, and change products, including the 2025 collection.
- USGS Annual NLCD Land Cover Classification – Official background on the meaning of forest, developed, agriculture, wetland, and other land-cover classes.
- U.S. Census Bureau TIGER/Line Shapefiles – Official geographic boundary data useful for matching Taylor County land-cover graphics with labeled administrative maps.
- Taylor County, Georgia Official Website – Official county information identifying Butler and Reynolds and providing local administrative context.
- UGA Extension Taylor County – Our Impact – University of Georgia county information describing the Fall Line setting and Taylor County’s agricultural and natural-resource context.
- Georgia DCA Taylor County Comprehensive Plan – Georgia Department of Community Affairs planning resources for Taylor County and the cities of Butler and Reynolds.
Green Map creates custom-edited map images using open geographic data sources such as geoBoundaries, Natural Earth, OpenStreetMap, and government open data.
These maps are edited visual materials, not raw data files, and are provided for education, documents, presentations, and graphic reference.