Telfair County’s 2025 land-cover pattern is unusual in how closely its two largest classes match: forest accounts for 29.68% and wetlands for 29.66%. Agriculture adds another 17.15%, while grassland, shrubland, developed cover, and open water occupy smaller shares. Across the map, natural cover remains widespread, but a distinct built cluster appears in the north-central part of the county and a smaller concentration appears near the eastern tip.
This page brings together four views of Telfair County: current land cover, forest and farmland, impervious/developed land, and mapped class differences from 1985 to 2025. The four original JPG maps are available in one download, while the WebP previews below make it easy to compare the county before choosing a file for a report, classroom project, watershed discussion, or presentation.
Table of Contents
Forest and wetlands are separated by only 0.02 percentage point in the 2025 summary
The general land-cover map gives the clearest countywide overview. Forest is the largest supplied class at 29.68%, but wetlands follow at 29.66%, a difference too small to treat either one as overwhelmingly dominant. Agriculture covers 17.15%, grassland 9.06%, and shrubland 7.33%. The companion impervious map reports developed cover at 6.08%, and the forest-and-farmland view lists open water at 0.91%. Barren land appears in the legend, but the supplied summary does not give a separate percentage, so no remainder has been assigned to that class.
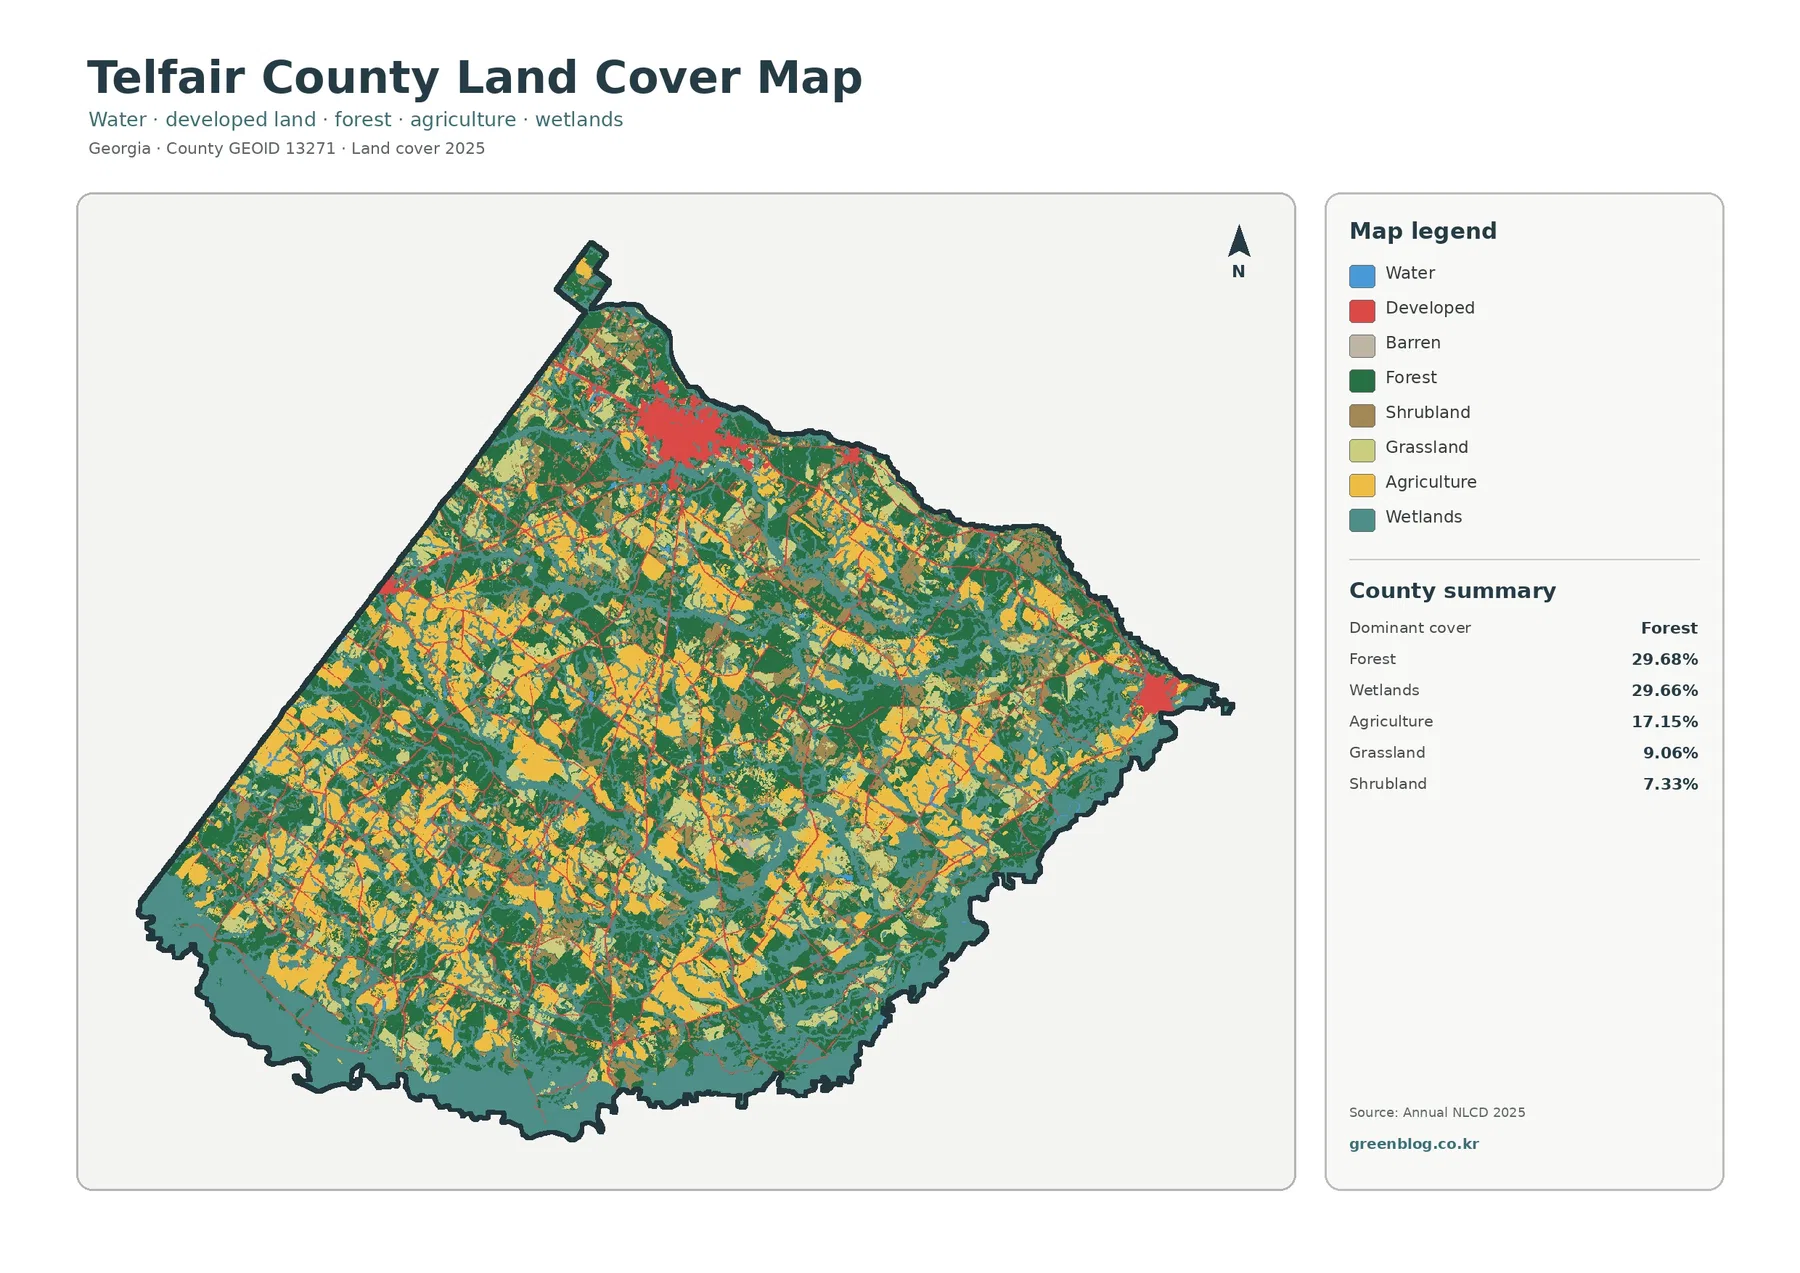
Dark-green forest occurs throughout the county in blocks of different sizes instead of forming one uninterrupted mass. Yellow agricultural patches are especially noticeable through the central and western portions, with additional fields scattered elsewhere. Teal wetlands occupy large areas along the southern edge and across much of the eastern side, while smaller wetland bands extend into the interior. Grassland and shrubland fill many of the transitions between forest, agriculture, and wet ground, giving the map a highly mixed appearance at county scale.
| 2025 map summary | Share |
|---|---|
| Forest | 29.68% |
| Wetlands | 29.66% |
| Agriculture | 17.15% |
| Grassland | 9.06% |
| Shrubland | 7.33% |
| Developed cover | 6.08% |
| Open water | 0.91% |
These classes describe what covers the ground, not who owns the land or what a parcel is legally allowed to become. A forest pixel is not automatically public forest, an agriculture pixel does not define a farm property line, and a wetland-classified cell does not by itself establish a jurisdictional wetland. The map is best used for county-scale surface comparison. Parcel ownership, zoning, permitting, flood regulation, and legal wetland boundaries require the corresponding official records.
A 6.08% developed class produces only 1.17% mean impervious surface across the county
Developed land and impervious surface answer different questions. The current land-cover summary reports 6.08% developed cover, while the impervious map gives a countywide mean of 1.17%. Only 0.29% of the county falls in cells that are at least 50% impervious. Developed cells can include lawns, trees, bare soil, yards, and other surfaces that still absorb water, so a developed classification does not mean the entire cell is covered by pavement or rooftops.
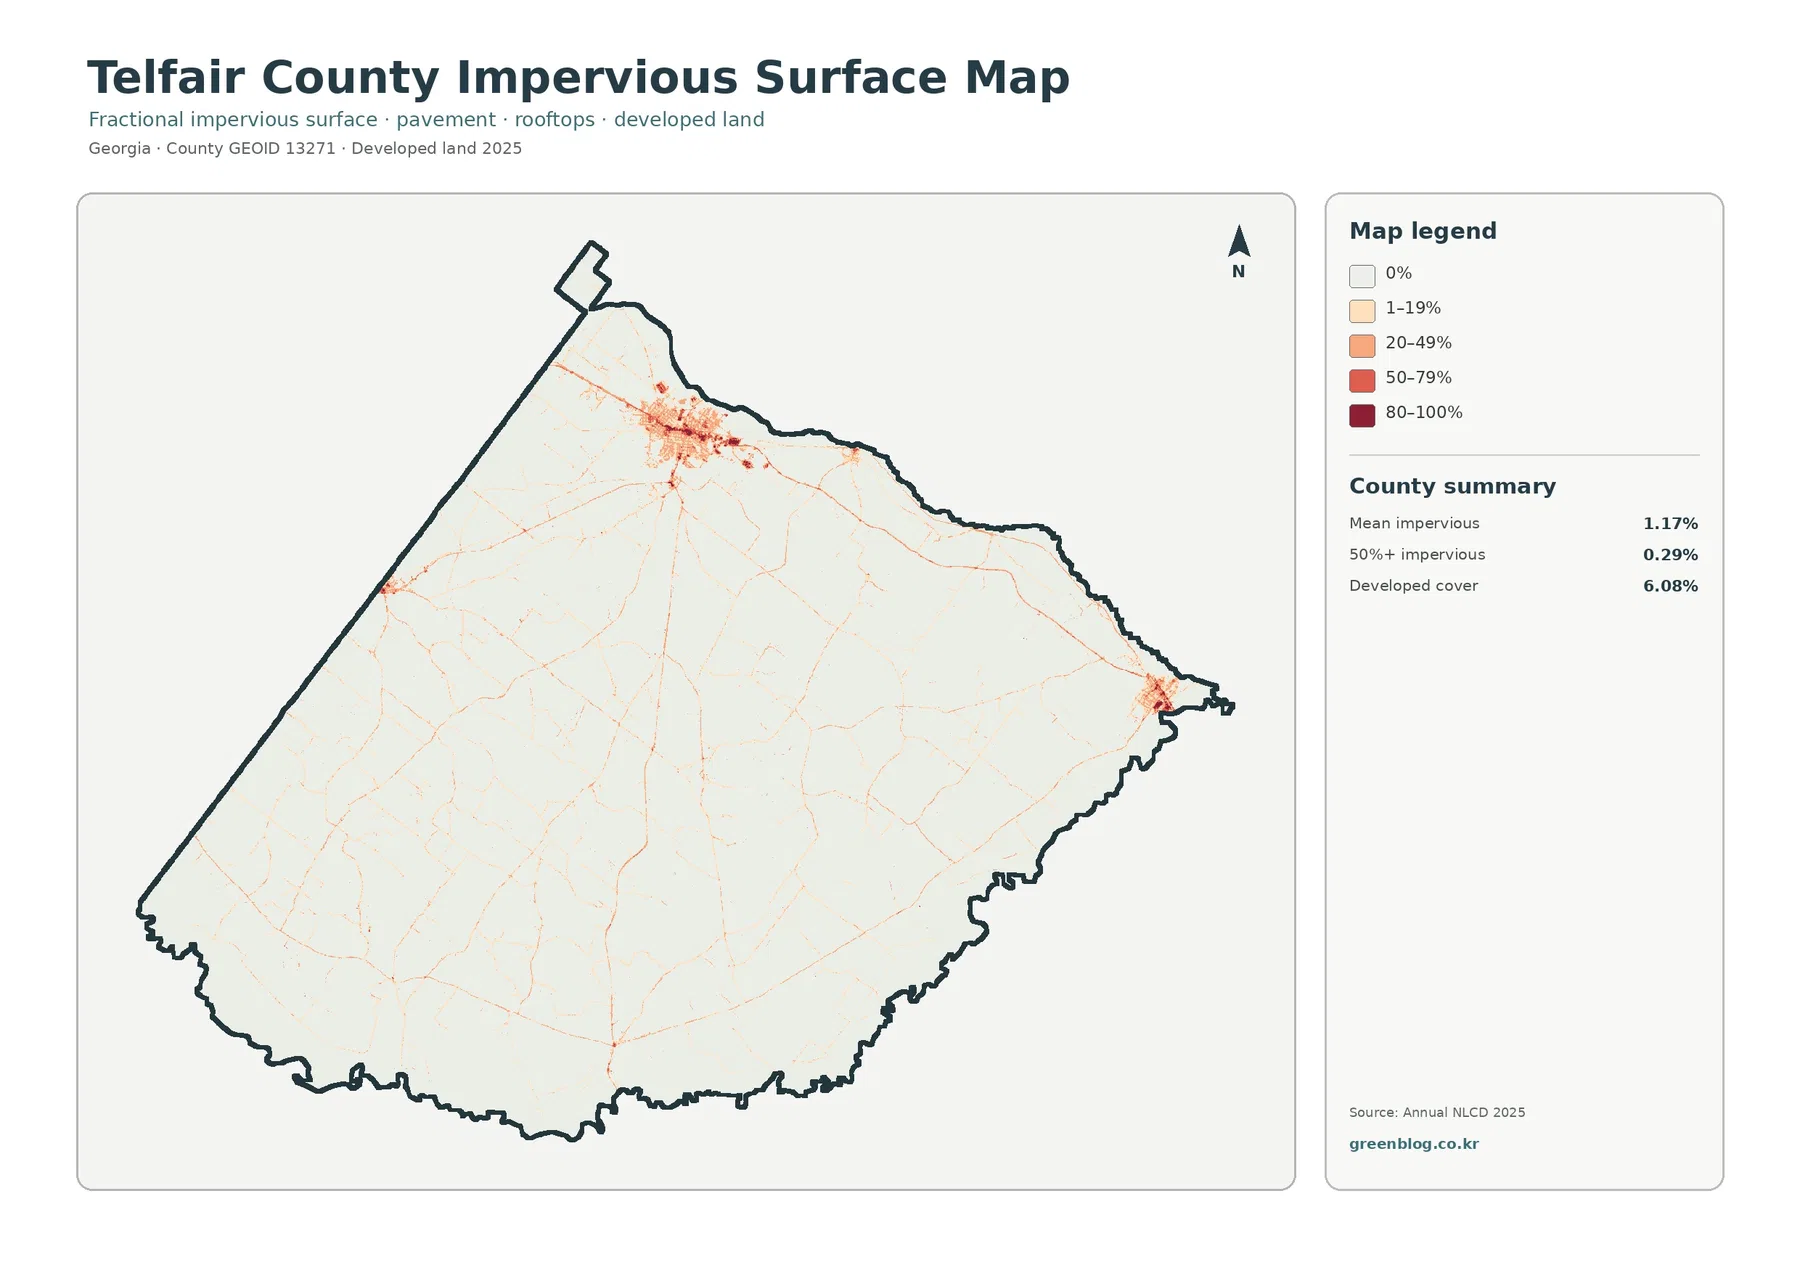
The largest high-impervious cluster is visible in the north-central part of Telfair County. A smaller compact cluster appears near the eastern tip, and thin lines extend through otherwise pale rural areas. Their shape is consistent with settlement and transportation features, but the preview does not label roads or municipal boundaries. A road map or Census municipal layer should be added before assigning a particular line or red patch to a named street or city limit.
Georgia’s Department of Community Affairs maintains a joint comprehensive-plan page for Telfair County and the cities of McRae-Helena, Jacksonville, Lumber City, and Scotland. Those named places provide useful reference points when the impervious map is compared with a separate administrative map. The supplied image alone should not be used to claim that a red cluster exactly matches one municipal boundary, because the land-cover product and legal city limits represent different kinds of geography.
The 1.17% mean also hides substantial local variation. Most forest, farm, and wetland areas contain little or no hard surface, while parts of the compact built clusters contain cells in the 20–49%, 50–79%, and 80–100% ranges. For a stormwater or heat-related presentation, the location of those concentrated cells is more informative than the county mean by itself. The summary number is useful for comparison, but the map explains where the harder surfaces actually occur.
Wetlands form a major landscape component along the southern and eastern parts of Telfair County
Wetlands make up 29.66% of the supplied 2025 classification, whereas open water is only 0.91%. Keeping those categories separate matters. Blue identifies open water, while teal represents wetland cover where vegetation and saturated conditions are part of the mapped class. Combining both values into a single “water area” figure would erase an important distinction in the dataset and make the county appear simpler than it is.
Large teal areas line much of the southern boundary and extend through the eastern and northeastern portions of the map. Interior wetland bands also thread between forest and agricultural patches. Telfair County planning documents identify the Ocmulgee and Little Ocmulgee rivers, wetlands, groundwater recharge areas, and other natural resources as resources the community seeks to conserve. That official context helps explain why river and wetland settings are relevant here, while the land-cover pixels themselves should still not be treated as regulatory boundaries.
A watershed lesson can use this map to compare open water with vegetated wet ground and then bring in a separate hydrography layer for named rivers and streams. The land-cover image is strong at showing broad surface patterns, but it does not provide channel centerlines, flood-frequency zones, wetland jurisdiction, or water-quality status. Those questions need datasets designed specifically for hydrology, regulation, or field assessment.
The forest-and-farmland view makes Telfair’s working landscape easier to separate from wet ground
With fewer colors competing for attention, the forest-and-farmland map makes the 17.15% agricultural share easier to locate. Cropland appears in many medium and large patches through the west, center, and southwest, with smaller areas elsewhere. Forest remains widespread around and between those fields. Wetlands continue to occupy a large part of the southern and eastern landscape, so farming is shown as one component of a broader mix rather than the only defining cover.
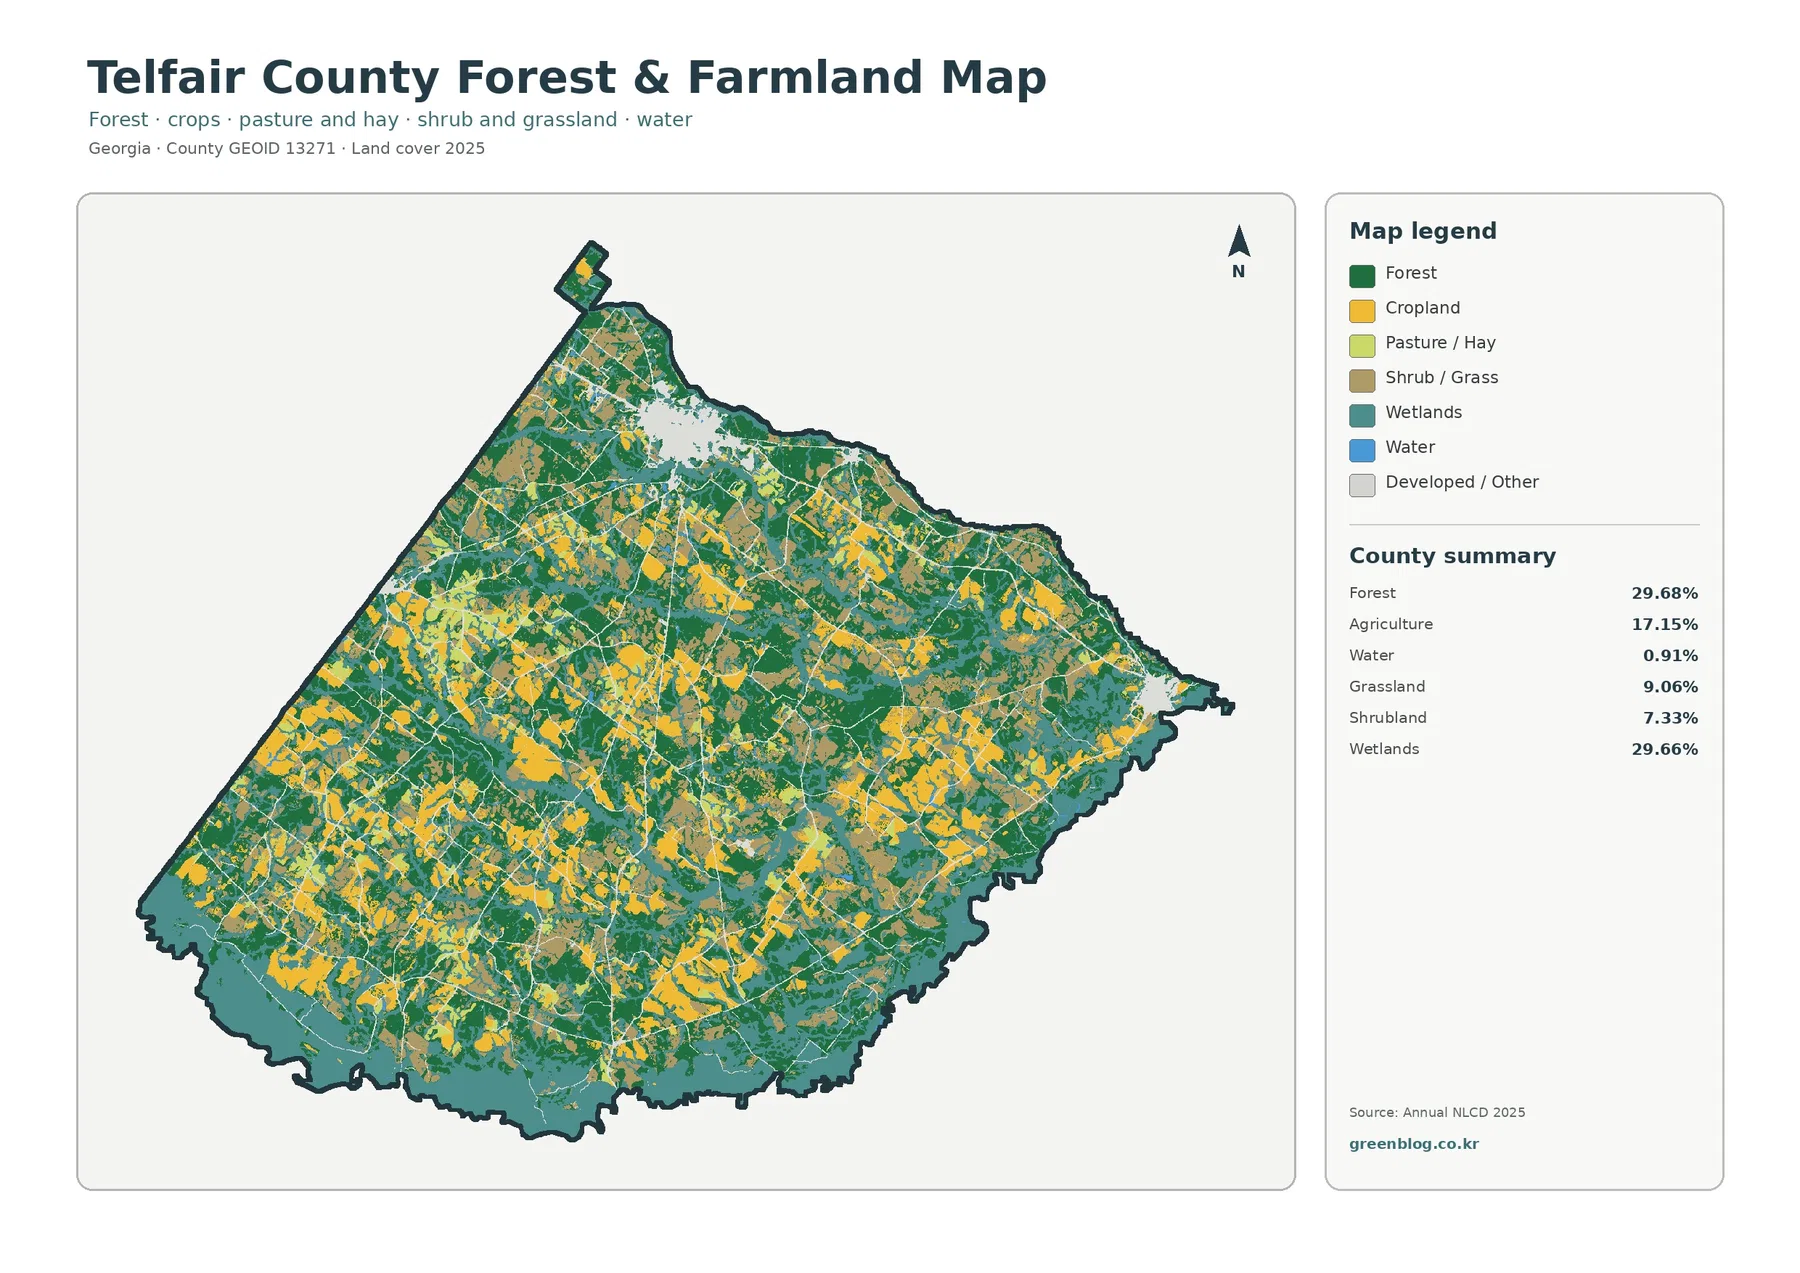
UGA Extension’s Telfair County Agriculture & Natural Resources office provides county-level support for field crops, fruits and vegetables, pastures, soil testing, water testing, and related topics. Its 2025 Georgia Ag Impact Report lists cotton, timber, and watermelons among Telfair County’s leading commodities. Those sources are useful background for understanding why both working farmland and forest matter locally, but the Annual NLCD agriculture color does not identify crop species or individual farm operations.
The same caution applies to grassland at 9.06% and shrubland at 7.33%. An open-looking patch is not automatically an active farm field. Pasture, hay, unmanaged grass, young vegetation, shrub-dominated land, and land between management cycles can be represented differently depending on the classification. When crop type, production value, or farm ownership is the question, agricultural statistics and field-level records should be used instead of trying to extract that information from a county land-cover class.
For presentations, a useful approach is to show the simplified map first and add the UGA agricultural information beside it. The map answers where broad agriculture and forest cover occur. The Extension material addresses agricultural activity and commodities. Keeping those roles separate lets the two sources reinforce each other without implying that every yellow polygon represents a specific commodity listed in the county report.
The 33.39% 1985–2025 class difference is not a 33.39% urbanization rate
The change map compares the classifications at two endpoints, 1985 and 2025. Its summary reports a 33.39% total class difference. Within that total, 1.15% is identified as change to developed, 13.85% as forest loss, 5.68% as agricultural loss, and 10.73% as other class difference. Wetland difference also appears in the legend, but no separate percentage is supplied in the summary, so the unlisted remainder should not be calculated and labeled as a verified wetland-change rate.
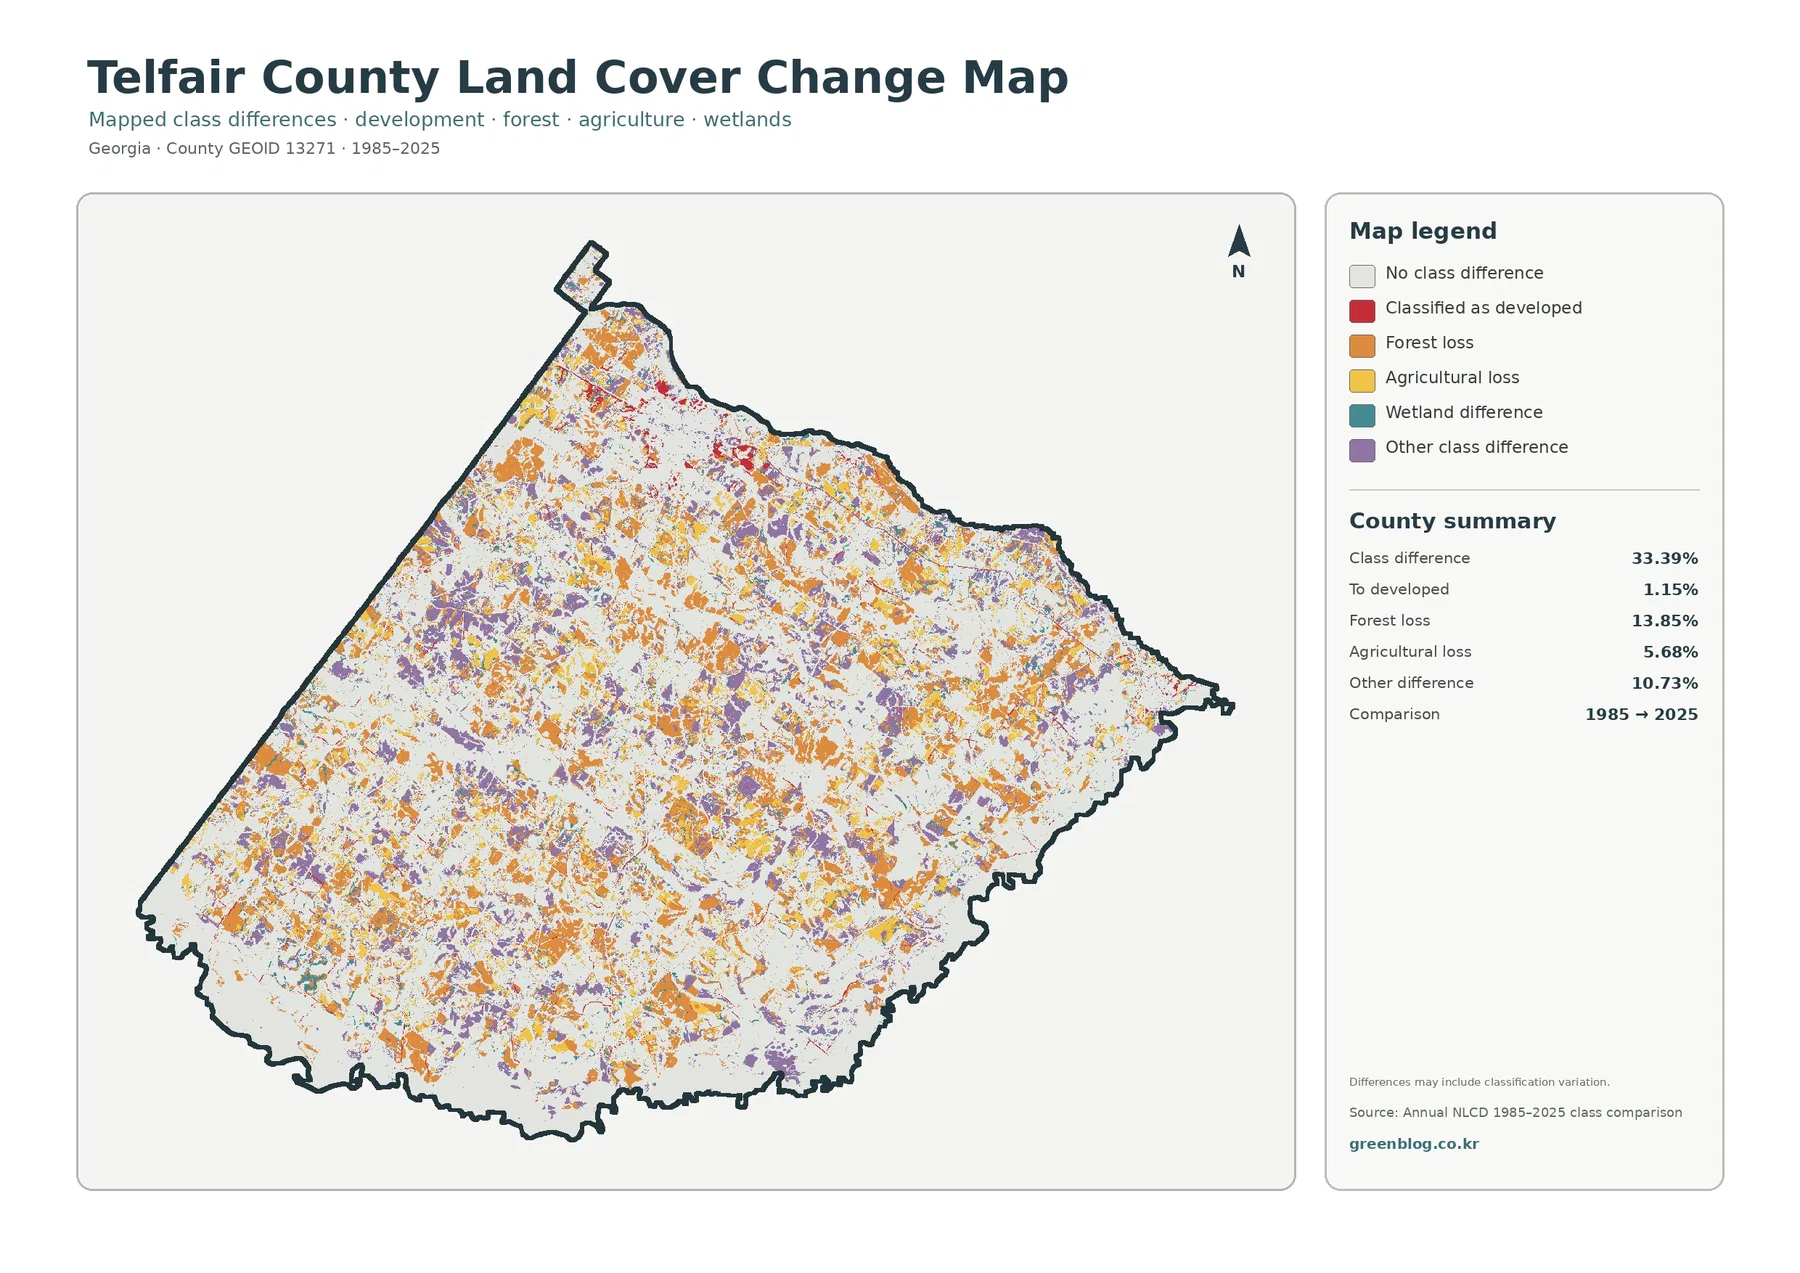
Orange forest-loss patches and purple other differences are scattered widely across the county, with white areas indicating no class difference between the two endpoints. Red change-to-developed cells are visible in smaller concentrations and do not account for most of the colored change area. Describing the whole 33.39% as development would therefore misread the legend. The map separates several kinds of class differences, and development is only one of them.
Forest loss at 13.85% should not automatically be interpreted as permanent clearing for construction. The map itself warns that differences may include classification variation. Vegetation condition, moisture, agricultural cycles, imagery, and classification behavior can cause an area to receive different labels at the two endpoints. A site-specific investigation of forest change would need intermediate Annual NLCD years, aerial imagery, forestry records, and other evidence before assigning a cause.
Agricultural loss at 5.68% has a similar limitation. It indicates cells that were not classified the same way at the two endpoints, not a measured 5.68% drop in agricultural production or farm income. A pixel could move among agriculture, grass, shrub, forest, wetland, developed, or another class for several reasons. Economic trend claims should come from agricultural statistics, while this map remains a visual record of classification differences.
Choose the map according to the question instead of treating all four as interchangeable
For a quick description of Telfair County today, begin with the general land-cover map. It establishes the near tie between forest and wetlands and shows how agriculture, grassland, shrubland, and development fit around them. When the topic is farming or vegetation, move to the forest-and-farmland view because it removes some visual complexity and makes the relationship among fields, woods, wet ground, and open cover easier to follow.
The impervious layer is better for questions about hard surface than for general land use. Its strongest message is the contrast between 6.08% developed cover and only 1.17% mean impervious surface, plus the concentration of higher values in a few compact areas. The change map belongs in a time-comparison section, after readers understand that its colors describe differences between 1985 and 2025 rather than the present surface alone.
These distinctions are useful in classrooms, county reference material, environmental education, and watershed presentations. A single map rarely answers every question. Showing the current map for broad context, the simplified vegetation map for working land, the impervious map for hard surfaces, and the change map for endpoint comparison gives each figure a clear job and reduces the chance that similarly colored classes will be confused.
The download contains four 2480×1754 JPG maps with legends and summary panels intact
The on-page previews are 1800-pixel WebP images. The ZIP contains four original JPGs covering current land cover, forest and farmland, impervious/developed land, and 1985–2025 land-cover change. The supplied asset manifest records each JPG at 2480×1754 pixels. Their consistent county outline and layout make them convenient for side-by-side use in documents, lessons, presentations, and general county reference work.
The manifest does not mark these JPGs as meeting an A3 high-resolution reference. They work well for screen viewing and many ordinary documents, but large-format printing should be tested before final use. Narrow impervious lines and small change-map cells can appear more generalized when enlarged far beyond the source dimensions.
Keep the legend and year label whenever possible. Red represents current developed cover on the general map, while red on the change map identifies cells classified as changing to developed between the two endpoint years. Cropping away the legend can make those different meanings look identical. The 2025 label and 1985–2025 comparison text are part of the information, not just decoration.
Thirty-meter raster cells are useful for county patterns but not for parcel surveys
Annual NLCD represents the landscape as raster cells at roughly 30-meter scale. A raster is a grid, and one cell can contain trees, a narrow road, grass, soil, and part of a building at the same time. The product must generalize that mixed area into a class or an impervious percentage. Broad patterns remain informative, but a tiny colored patch should not be treated as a surveyed boundary or proof that every square meter has the same cover.
The current land-cover and impervious summaries are labeled 2025, while the change map compares 1985 and 2025. Construction, harvesting, regrowth, crop rotation, storm damage, flooding, or other changes after the observation period may not be represented. If a present-day site decision depends on exact conditions, recent aerial photography, parcel records, road and hydrography layers, and field inspection should be added.
Used at the intended scale, the set provides a strong overview of Telfair County. It shows the near-equal importance of forest and wetlands in the supplied classification, the dispersed agricultural pattern, the concentration of hard surfaces in a few developed areas, and the fact that long-term class differences cannot be reduced to one story about urban growth. Those are county-level observations; legal status and site-specific decisions require more detailed sources.
Frequently Asked Questions
What are the largest 2025 land-cover classes in Telfair County?
Forest is 29.68% and wetlands are 29.66%, so they are nearly tied. Agriculture is 17.15%, followed by grassland at 9.06%, shrubland at 7.33%, developed cover at 6.08%, and open water at 0.91%.
Why is developed cover 6.08% when mean impervious surface is only 1.17%?
A developed cell can include lawns, trees, soil, yards, and other permeable surfaces in addition to pavement and rooftops. Only 0.29% of the county is in cells that are at least 50% impervious.
Does the 33.39% class difference mean one-third of Telfair County became developed?
No. Change to developed is 1.15%. The total also includes forest loss at 13.85%, agricultural loss at 5.68%, other class difference at 10.73%, and mapped wetland differences, with a warning that classification variation may be included.
Map File Information
The four original Telfair County JPG maps are packaged in one ZIP: current land cover, forest and farmland, impervious/developed land, and 1985–2025 land-cover change.
- Printable Size: 2480×1754 pixels each
Related Maps
- Appling County Georgia Land Cover Map
- Atkinson County Georgia Land Cover Map
- Bacon County Georgia Land Cover Map
Sources and references
- MRLC Annual NLCD Data – Official access point for Annual NLCD land-cover and related products used for the supplied 2025 mapping.
- USGS Annual NLCD Land Cover Classification – Official explanation of land-cover classes including forest, developed land, agriculture, and wetlands.
- U.S. Census Bureau TIGER/Line Shapefiles – Official source for county, municipal, and other geographic reference boundaries.
- UGA Extension Telfair County Agriculture & Natural Resources – County-level agricultural and natural-resource information and services.
- 2025 Georgia Ag Impact Report – Telfair County – County agricultural summary listing cotton, timber, and watermelons among leading commodities.
- Georgia DCA Telfair County Comprehensive Plan – Planning documents for Telfair County, McRae-Helena, Jacksonville, Lumber City, and Scotland, including natural-resource context.
Green Map creates custom-edited map images using open geographic data sources such as geoBoundaries, Natural Earth, OpenStreetMap, and government open data. These maps are edited visual materials, not raw data files, and are provided for education, documents, presentations, and graphic reference.