Stewart County in west-central Georgia is a strongly forested county with a very different western edge. Forest accounts for 61.84% of the 2025 land-cover summary, while the Chattahoochee River boundary is lined by water and wetland cover. Small built centers around Lumpkin and Richland stand out against a much larger rural landscape of woods, fields, grassland, shrub cover, and wet ground.
The page includes four views of the same county: current land cover, forest and farmland, impervious surface, and mapped differences from 1985 to 2025. The four original JPG maps are available together in one download. Use the overview for the countywide mix, the impervious layer for paved intensity, and the change layer only after reading its classification warning.
Table of Contents
A forest-dominated interior sits beside a distinctly wetter western boundary
The 2025 overview gives forest a clear lead at 61.84%. Agriculture makes up 9.31%, grassland 8.74%, wetlands 8.04%, and shrubland 7.45%. The companion forest-and-farmland summary lists water at 0.86%, while the impervious map reports developed cover at 3.60%. Together, those figures describe a county where natural and rural surfaces occupy far more area than built land.
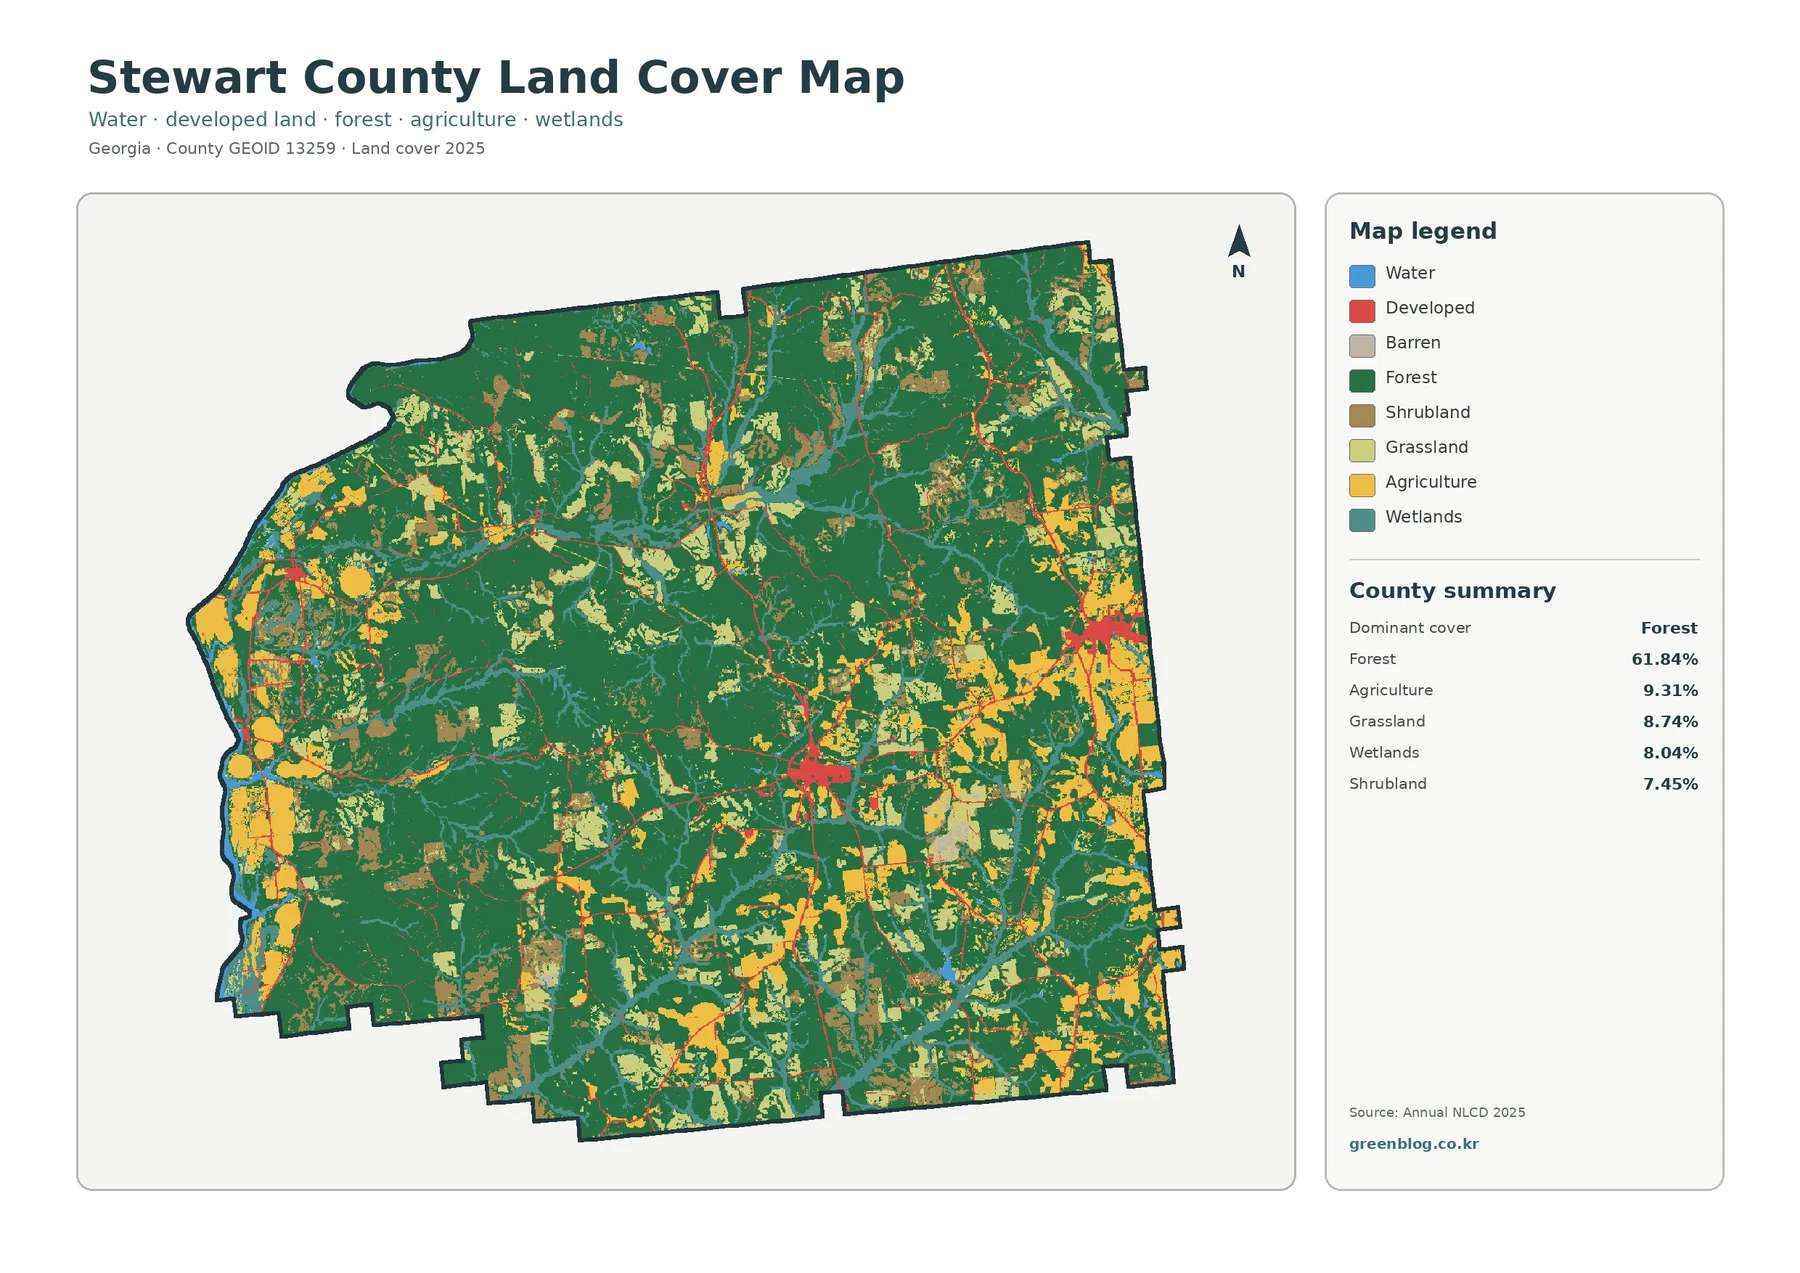
Green forest cover forms large blocks through the middle, north, and south rather than staying in one corner. Yellow agricultural patches and lighter grassland colors break those woods into a mosaic, especially toward the eastern side and in several southern areas. Shrub cover adds another open or transitional class, so the non-forest landscape should not be reduced to farms and towns alone.
The west side has a different visual character. Blue water and teal wetland cells follow the county edge and branch inward in places. Stewart County’s official government site states that the entire western boundary is the Chattahoochee River. That local fact helps explain why the edge should be read as a river corridor rather than as an arbitrary line of blue pixels. The map does not, however, show flood zones, channel depth, or water quality.
Developed cover appears in compact nodes and along thin connecting lines. The strongest interior cluster lies near the county’s central-southern area, with another clear concentration farther east. Census geography identifies Lumpkin and Richland areas within Stewart County, and the county directory lists city halls for both communities. Those named places provide useful context for the two most obvious built concentrations, while smaller road-related patches remain scattered elsewhere.
| 2025 mapped class | County summary |
|---|---|
| Forest | 61.84% |
| Agriculture | 9.31% |
| Grassland | 8.74% |
| Wetlands | 8.04% |
| Shrubland | 7.45% |
| Water | 0.86% |
| Developed cover | 3.60% |
The western river corridor deserves a separate reading from the county’s interior wetlands
Water covers only 0.86% in the supplied summary, yet wetlands account for 8.04%. That difference matters when reading Stewart County. Open water is a narrow category, while wetland classification can include vegetated areas where water or saturated soils shape the surface cover. As a result, the Chattahoochee edge and interior drainage areas can look much broader in teal than the blue water class alone would suggest.
Wetland cells do not stay on the county line. Thin branches and small patches extend into the interior, often alongside forest. This pattern is useful for watershed teaching or for choosing places that deserve closer hydrologic study, but it is not a regulatory wetland map. A county-scale raster layer cannot establish jurisdictional wetland boundaries, stream buffers, or floodplain limits for an individual property.
The river-edge setting also makes scale important. A narrow channel or wet strip can be simplified within a roughly 30-meter cell, especially where water, trees, and exposed ground meet. If a project depends on the exact bank location, use a dedicated hydrography layer, recent aerial imagery, and field information rather than tracing the colored edge from this land-cover image.
Forest and open land form a patchwork rather than a simple east-west split
Removing most of the developed colors makes the rural pattern easier to follow. The forest-and-farmland layer emphasizes forest, cropland, pasture or hay, shrub and grass cover, wetlands, and water. Large green areas still dominate, but the map also reveals sizeable open blocks on both sides of the county and many smaller clearings between forest patches.
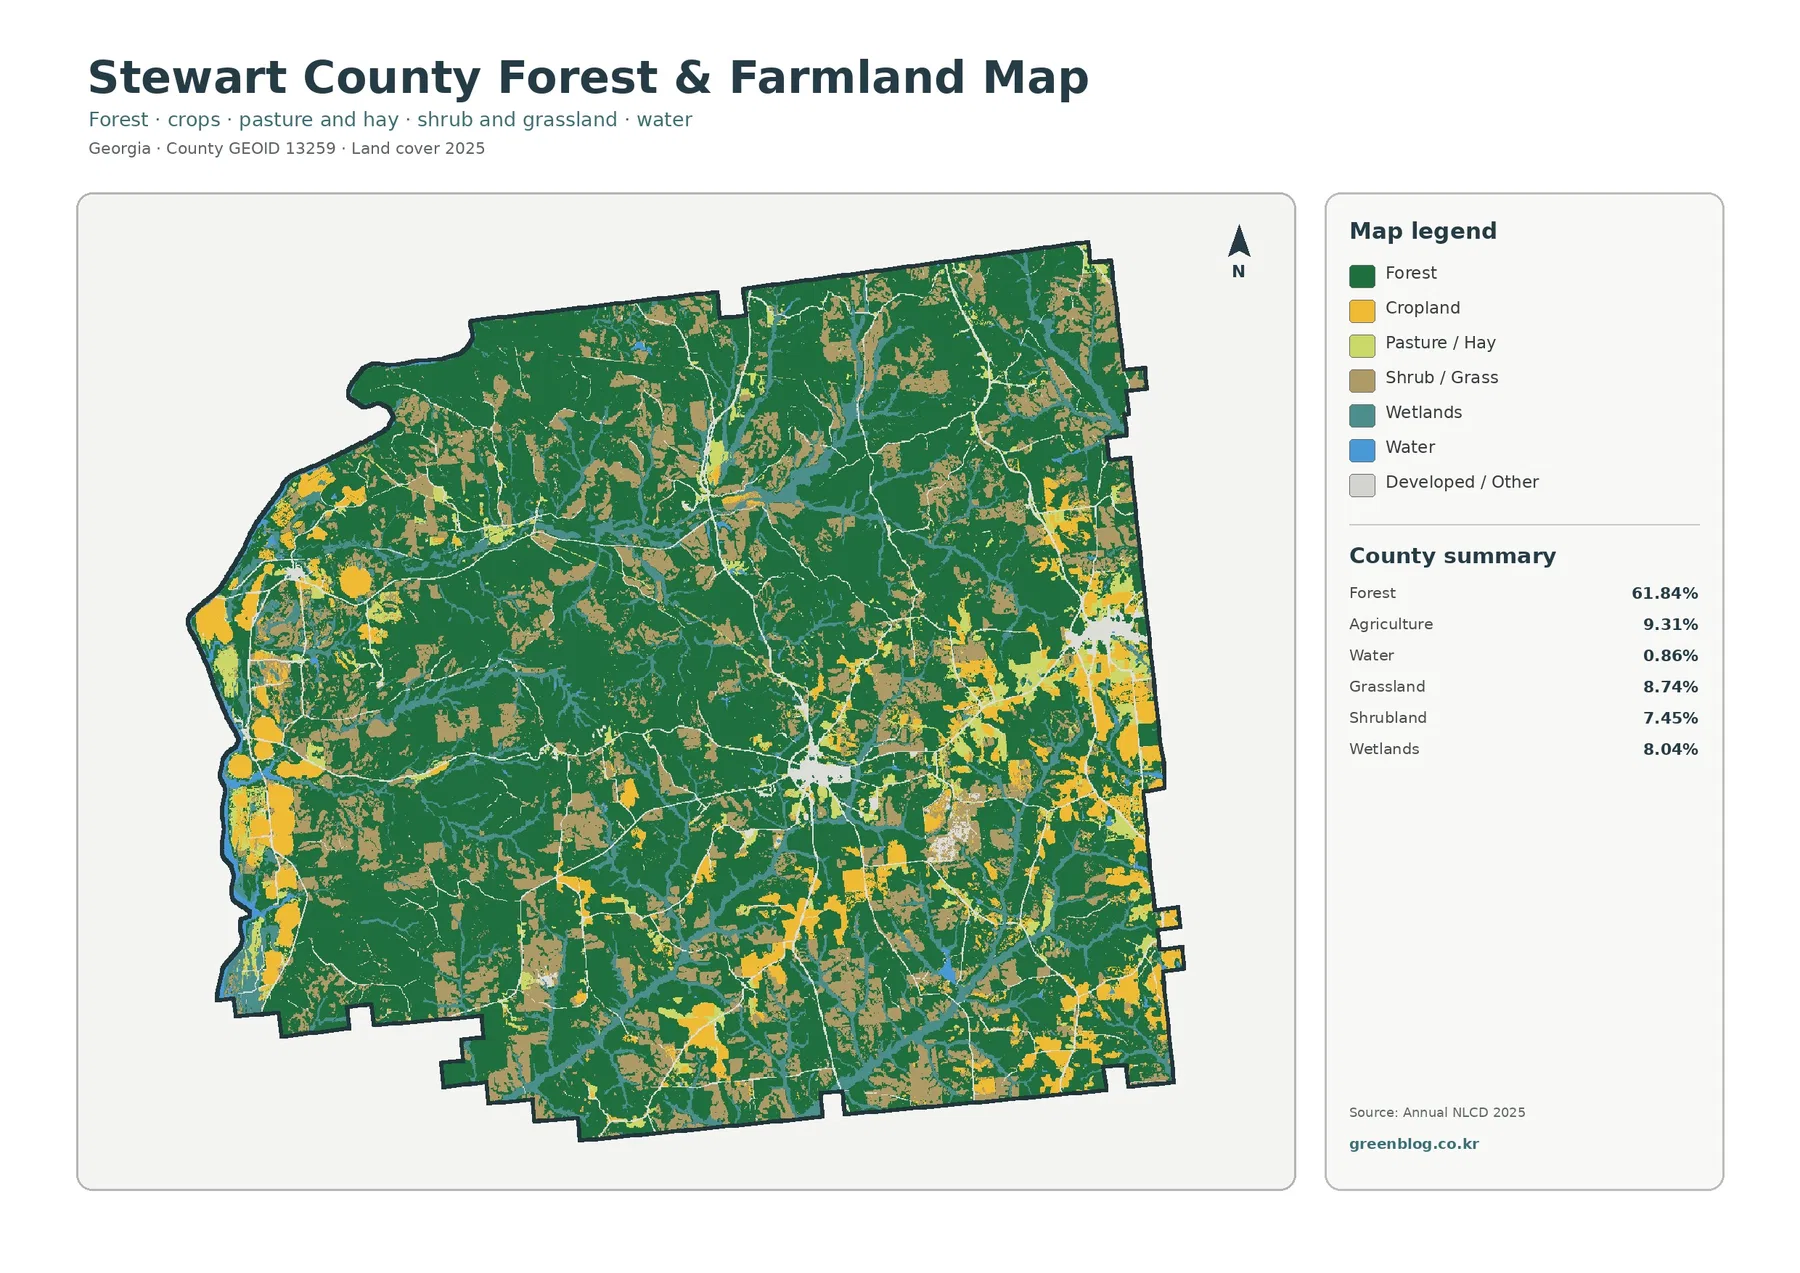
Agriculture is 9.31% in the county summary, but that number is only one part of the open landscape. Grassland reaches 8.74% and shrubland 7.45%, so a large light-colored patch should not automatically be called cropland. The legend is important because pasture, grassy openings, shrub cover, and cultivated fields can sit next to one another while representing different surface conditions.
The eastern half contains several conspicuous agricultural blocks, while western and southern sections also show fields mixed with forest and wet areas. No single agricultural belt dominates the county. This scattered pattern makes the layer useful for comparing working land with surrounding woodland, especially when a general-purpose map would let the developed category compete for attention.
For habitat or landscape comparisons, forest continuity can be as important as the total percentage. Some green areas connect across broad parts of the interior, while others are cut by fields, open cover, wetlands, and roads. The map can help identify where large wooded blocks remain or where cover becomes more fragmented, but it does not tell whether a forest is publicly owned, managed for timber, protected, or available for development.
Lumpkin and Richland become clearer when the map measures hard surface instead of development class
Impervious surface means roofs, pavement, parking areas, and other constructed surfaces that shed water rather than allowing it to soak directly into soil. The Stewart County layer divides cells into 0%, 1–19%, 20–49%, 50–79%, and 80–100% impervious fractions. The countywide mean is only 0.62%, and just 0.13% of the county falls above the 50% threshold.
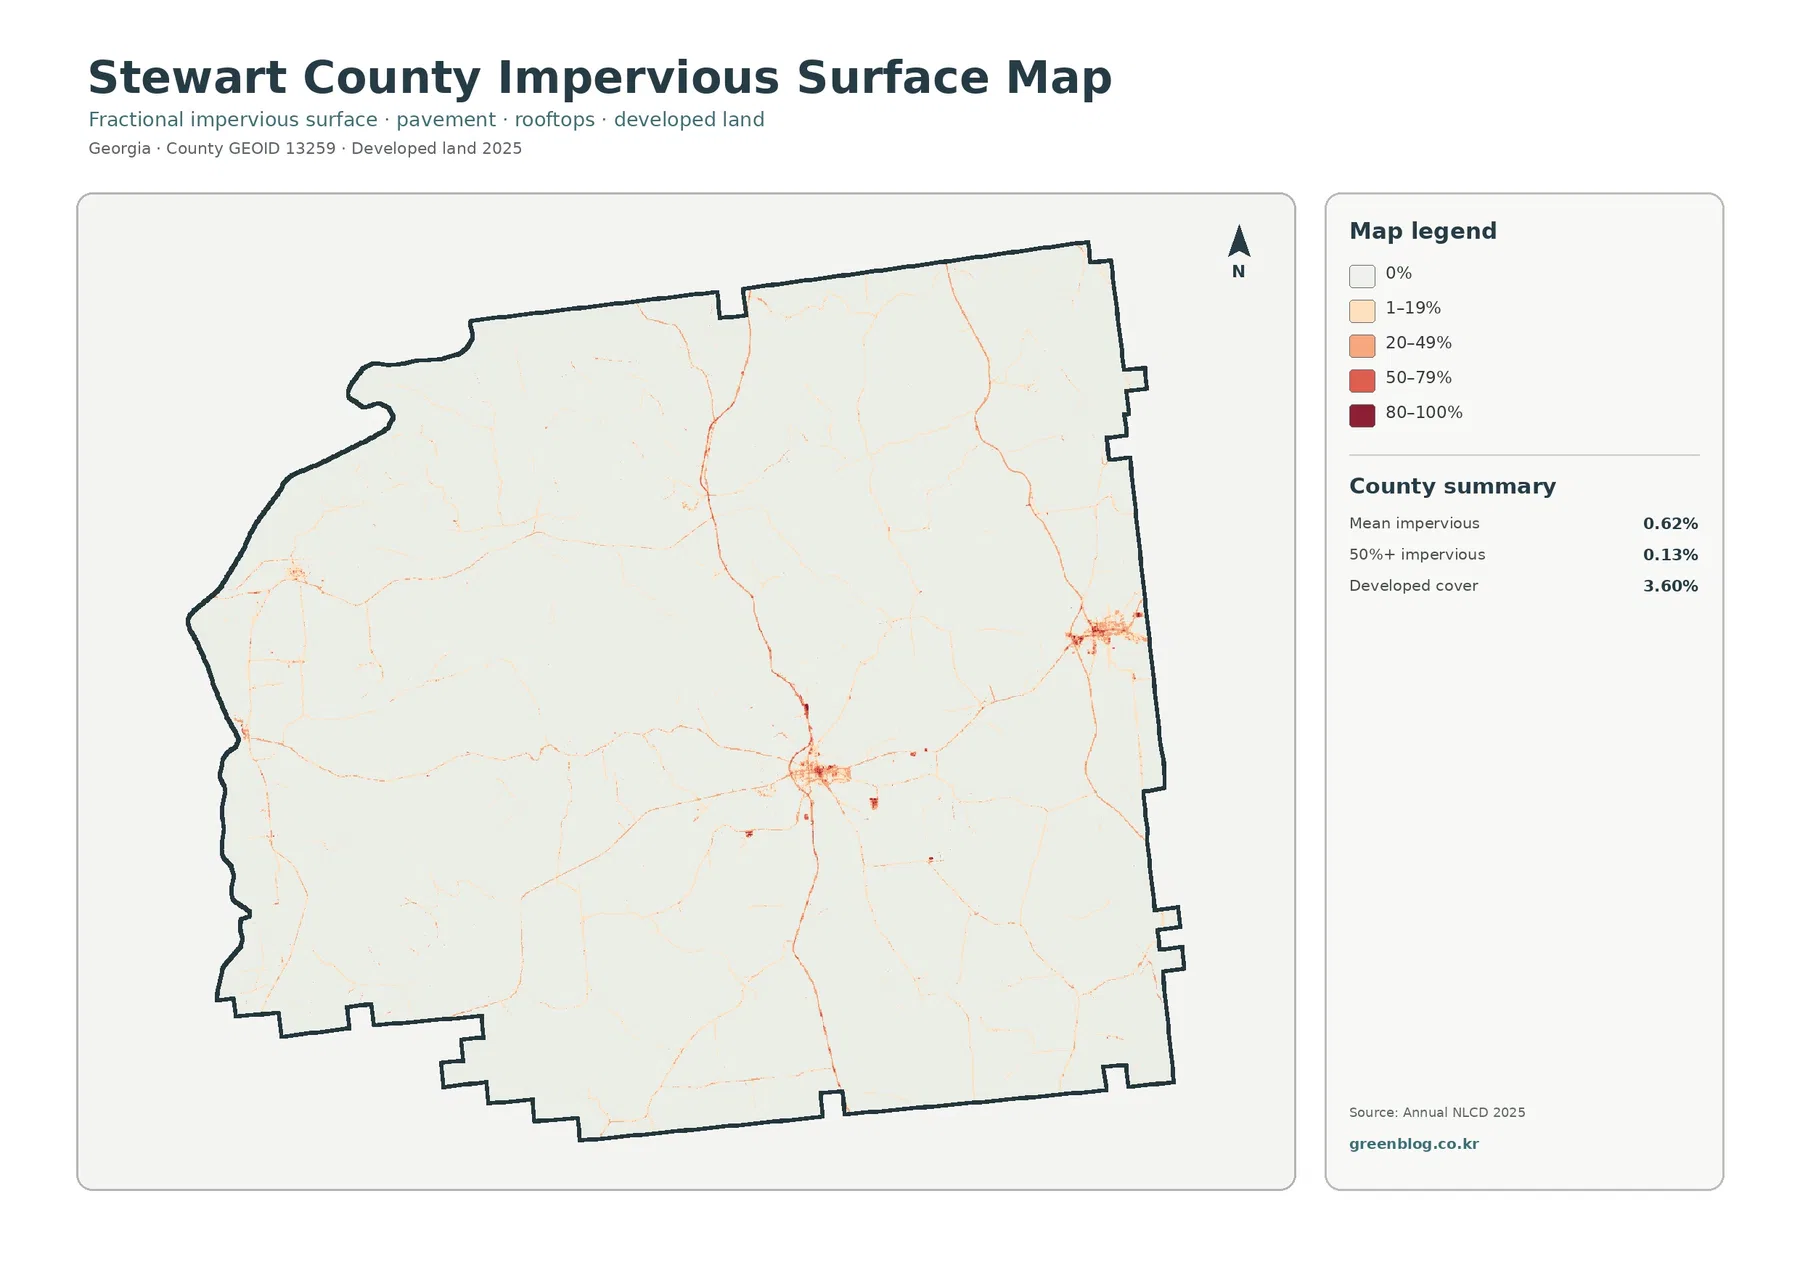
The dark values are concentrated in a few small places. A compact cluster near the central-southern part of the county aligns with Lumpkin, and another prominent group appears around the Richland area to the east. Between those centers, thin orange lines trace transportation corridors through otherwise pale rural land. A smaller concentration is visible toward the west, but it is far less extensive than the main two centers.
Developed cover at 3.60% is not supposed to match the 0.62% mean impervious value. A low-density developed cell can contain a house, lawn, trees, and a road, so only part of the cell is actually sealed. A commercial block can have the opposite pattern, with a small footprint but a high percentage of pavement and roof. The two layers therefore answer different questions: one classifies developed land cover, and the other estimates hard-surface intensity.
This distinction is especially useful in a rural county. The general map can make a thin road corridor look like part of a larger developed category, while the impervious layer reveals how narrow and discontinuous that constructed surface really is. For stormwater discussions or settlement comparisons, the fractional layer is often the better visual. It should still be treated as a county-scale estimate rather than a measurement of a specific driveway or building.
The 1985–2025 map is busy because most mapped differences are not new development
Stewart County’s change summary reports a class difference across 46.44% of the mapped area. That is a large number, but the “to developed” category is only 0.74%. Forest loss accounts for 13.56%, agricultural loss for 2.94%, and other class differences for 28.70%. Wetland difference is also shown as a separate legend category. The summary therefore cannot be described as 46.44% urbanization or construction.
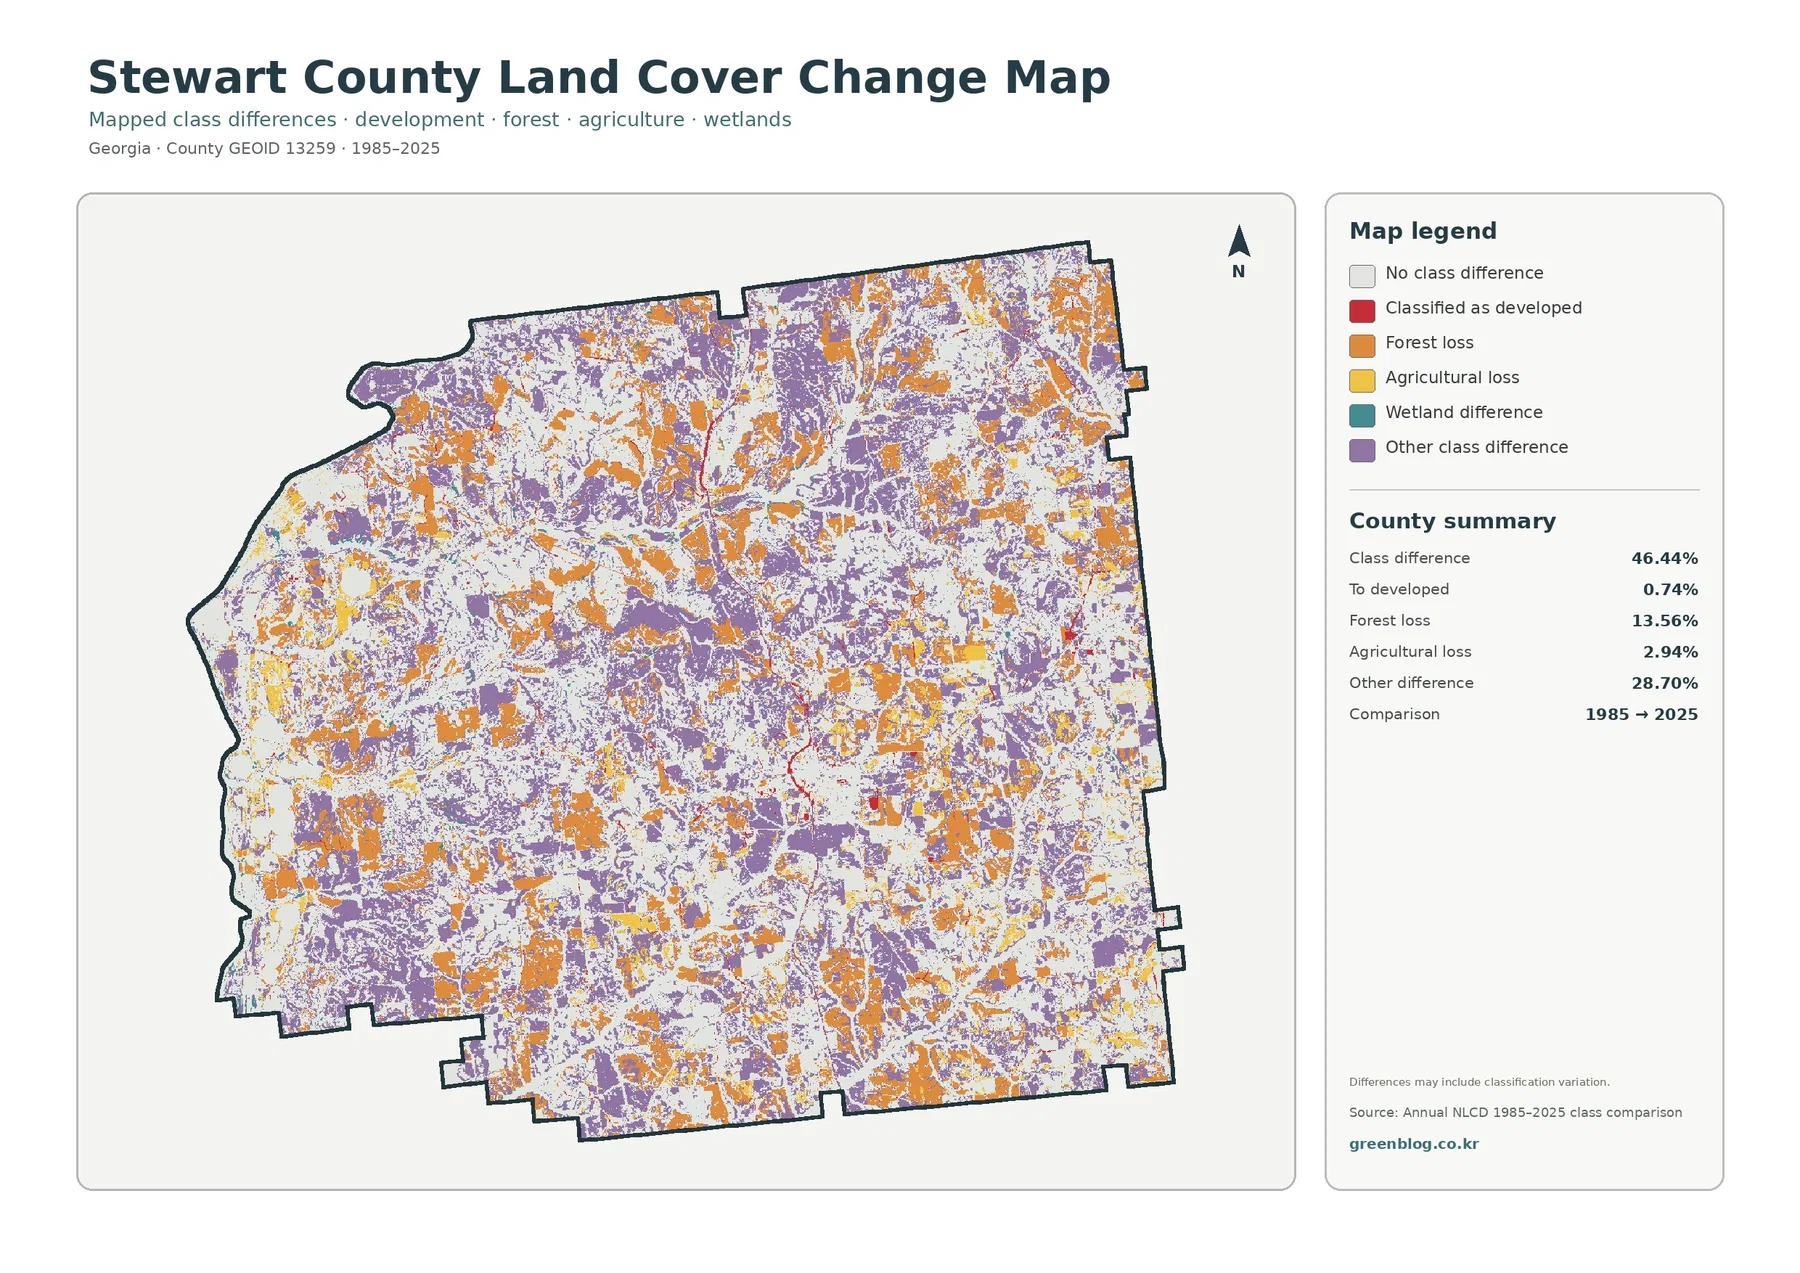
Purple other-class differences spread across nearly every part of the county. Orange forest-loss patches are also widely distributed, appearing as both small fragments and larger blocks. Red cells classified to developed are much more limited and tend to occur near present-day built centers or narrow corridors. The visual balance matches the summary: most changed classification is in categories other than development.
Forest loss at 13.56% deserves attention, yet a two-date classification does not explain the process behind every orange patch. Harvest and regrowth, conversion to open land, changes in moisture, image conditions, and classification methods can all affect the class assigned to a cell. The map itself warns that differences may include classification variation. A site-specific claim requires more dates or direct imagery.
A careful workflow is to use the change map as a screening layer. Mark an area with a large orange or purple concentration, then compare several aerial-photo years or annual land-cover products before describing a trend. That approach is especially important here because the 46.44% total difference is so much larger than the 0.74% mapped transition to developed land.
Providence Canyon is a reminder that land cover and landform are different kinds of information
Providence Canyon State Park is in Stewart County near Lumpkin. Georgia State Parks describes its deep gullies as an erosion landscape associated with poor farming practices in the 1800s and notes that the backcountry trail passes through mixed forest. That is useful local context, but the land-cover maps on this page do not show canyon depth, slope, soil color, or geology.
A forest-colored cell near a canyon still means surface vegetation, not elevation. Likewise, a bare or grassy cell would describe what covers the ground rather than why the landform exists. To study Providence Canyon itself, combine land cover with elevation, geology, detailed trails, or aerial imagery. The same rule applies to the Chattahoochee River: water and wetland classes describe surface cover, not channel hydraulics or legal shoreline boundaries.
This distinction makes the map useful for education. A class can compare a park photograph with the land-cover layer and ask why each source highlights different features. The photograph may emphasize steep walls and exposed soil, while the county raster emphasizes forest, grass, wetlands, or other cover. Neither replaces the other because they answer different geographic questions.
Choose a map according to the question, then keep the legends visible when you compare them
Start with the general 2025 map when the goal is orientation. It places forest, agriculture, development, wetlands, water, grassland, shrubland, and barren cover in one view, so it quickly establishes the forest-dominated interior and wetter west. Once that context is clear, a specialized layer can answer a narrower question without forcing the reader to learn four legends at once.
Use the forest-and-farmland version to discuss rural cover. It is particularly helpful when comparing the 9.31% agricultural share with grassland, shrub cover, wetlands, and the much larger forest area. Use the impervious surface layer for built intensity around Lumpkin, Richland, and road corridors. That layer makes the county’s low overall hard-surface level more obvious than the general developed class does.
Use the change layer only for time-based questions. A red cell means it was classified as developed in the comparison, not that every nearby developed cell is new. Orange marks mapped forest loss, and purple is a broader other-class difference. Keeping the change legend beside the image prevents the common mistake of treating every colored change cell as urban growth.
For a report, two-map comparisons are often clearer than a four-map grid. Pair current land cover with impervious surface to explain the difference between developed extent and hard-surface intensity. Pair forest-and-farmland with change to discuss where present rural cover overlaps areas that were classified differently in 1985. Always preserve the map title, legend, and summary panel when cropping or placing the image on a slide.
The downloadable files are 2480×1754 JPGs intended for practical screen and document use
The WebP images in the article are convenient previews, while the ZIP contains four original JPGs: general land cover, forest and farmland, impervious/developed land, and the 1985–2025 change comparison. Their matching page proportions make them easy to swap within the same presentation layout or place side by side in a document.
The asset manifest records each JPG at 2480×1754 pixels and does not mark the set as meeting its A3 high-resolution reference. The files are still useful for screens, ordinary documents, and moderate-size prints, but a large enlargement can soften small legend text and fine boundaries. Print one sample at the intended size before producing a full set for a display.
If the maps are used in a presentation, avoid removing the summary panel just to gain more space. The 61.84% forest figure, 0.62% mean impervious value, and 46.44% class-difference figure belong to different maps and are easy to confuse when the title or legend is missing. A slightly smaller complete map is often more informative than a large crop without its context.
Frequently Asked Questions
What is the largest land-cover class in Stewart County?
Forest is the largest 2025 class at 61.84%. The supplied map shows broad forest across the interior, while the western Chattahoochee River edge contains a more continuous mix of water and wetland cover.
Which map is best for seeing the built areas around Lumpkin and Richland?
Use the general land-cover layer to see the full developed class, then compare it with the impervious-surface map. Developed cover is 3.60%, but mean impervious surface is only 0.62%, so the fractional layer is better for locating the most concentrated pavement and rooftops.
Does the 46.44% 1985–2025 class difference mean that nearly half the county was developed?
No. Only 0.74% is summarized as classified to developed. The comparison also includes 13.56% forest loss, 2.94% agricultural loss, 28.70% other class differences, and a separate wetland-difference category, with classification variation potentially contributing to the total.
Map File Information
Download the four original Stewart County land-cover JPG maps in one ZIP: general land cover, forest and farmland, impervious/developed land, and 1985–2025 land-cover change.
- Printable Size: 2480×1754 pixels each
- Intended Use: screen reference, documents, classroom material, presentations, and map comparison
Related Maps
- Appling County Georgia Land Cover Map
- Atkinson County Georgia Land Cover Map
- Bacon County Georgia Land Cover Map
Sources and references
- MRLC Annual NLCD Data – official access to Annual NLCD land-cover products and supporting data.
- USGS Annual NLCD Land Cover Classification – official guidance for interpreting forest, agriculture, developed, wetland, and other land-cover classes.
- Stewart County Georgia Commission – the official county site, including the county description that identifies the Chattahoochee River along the entire western boundary.
- Providence Canyon State Park – Georgia State Parks information about the canyon landscape, erosion history, and forested backcountry near Lumpkin.
- U.S. Census Bureau TIGER/Line Shapefiles – official geographic boundary data for counties and related mapping work.
Green Map creates custom-edited map images using open geographic data sources such as geoBoundaries, Natural Earth, OpenStreetMap, and government open data.
These maps are edited visual materials, not raw data files, and are provided for education, documents, presentations, and graphic reference.