Meriwether County is mostly wooded, but its settlement pattern is more scattered than a single county-seat-centered map might suggest. Forest covers 58.65% of the supplied 2025 data, agriculture 17.45%, and developed land 7.01%. Several small built centers appear across the county rather than merging into one urban area. This Meriwether County Georgia Land Cover Map compares those town footprints with the surrounding forest, fields, wetlands, and open rural land.
The four WebP previews cover the current countywide classification, forest and farmland, fractional impervious surface, and the 1985–2025 endpoint comparison. The original 2480 × 1754 JPG maps are bundled in one ZIP for county profiles, lessons, reports, and presentations.
Table of Contents
Separate town centers are easier to recognize on the hard-surface map
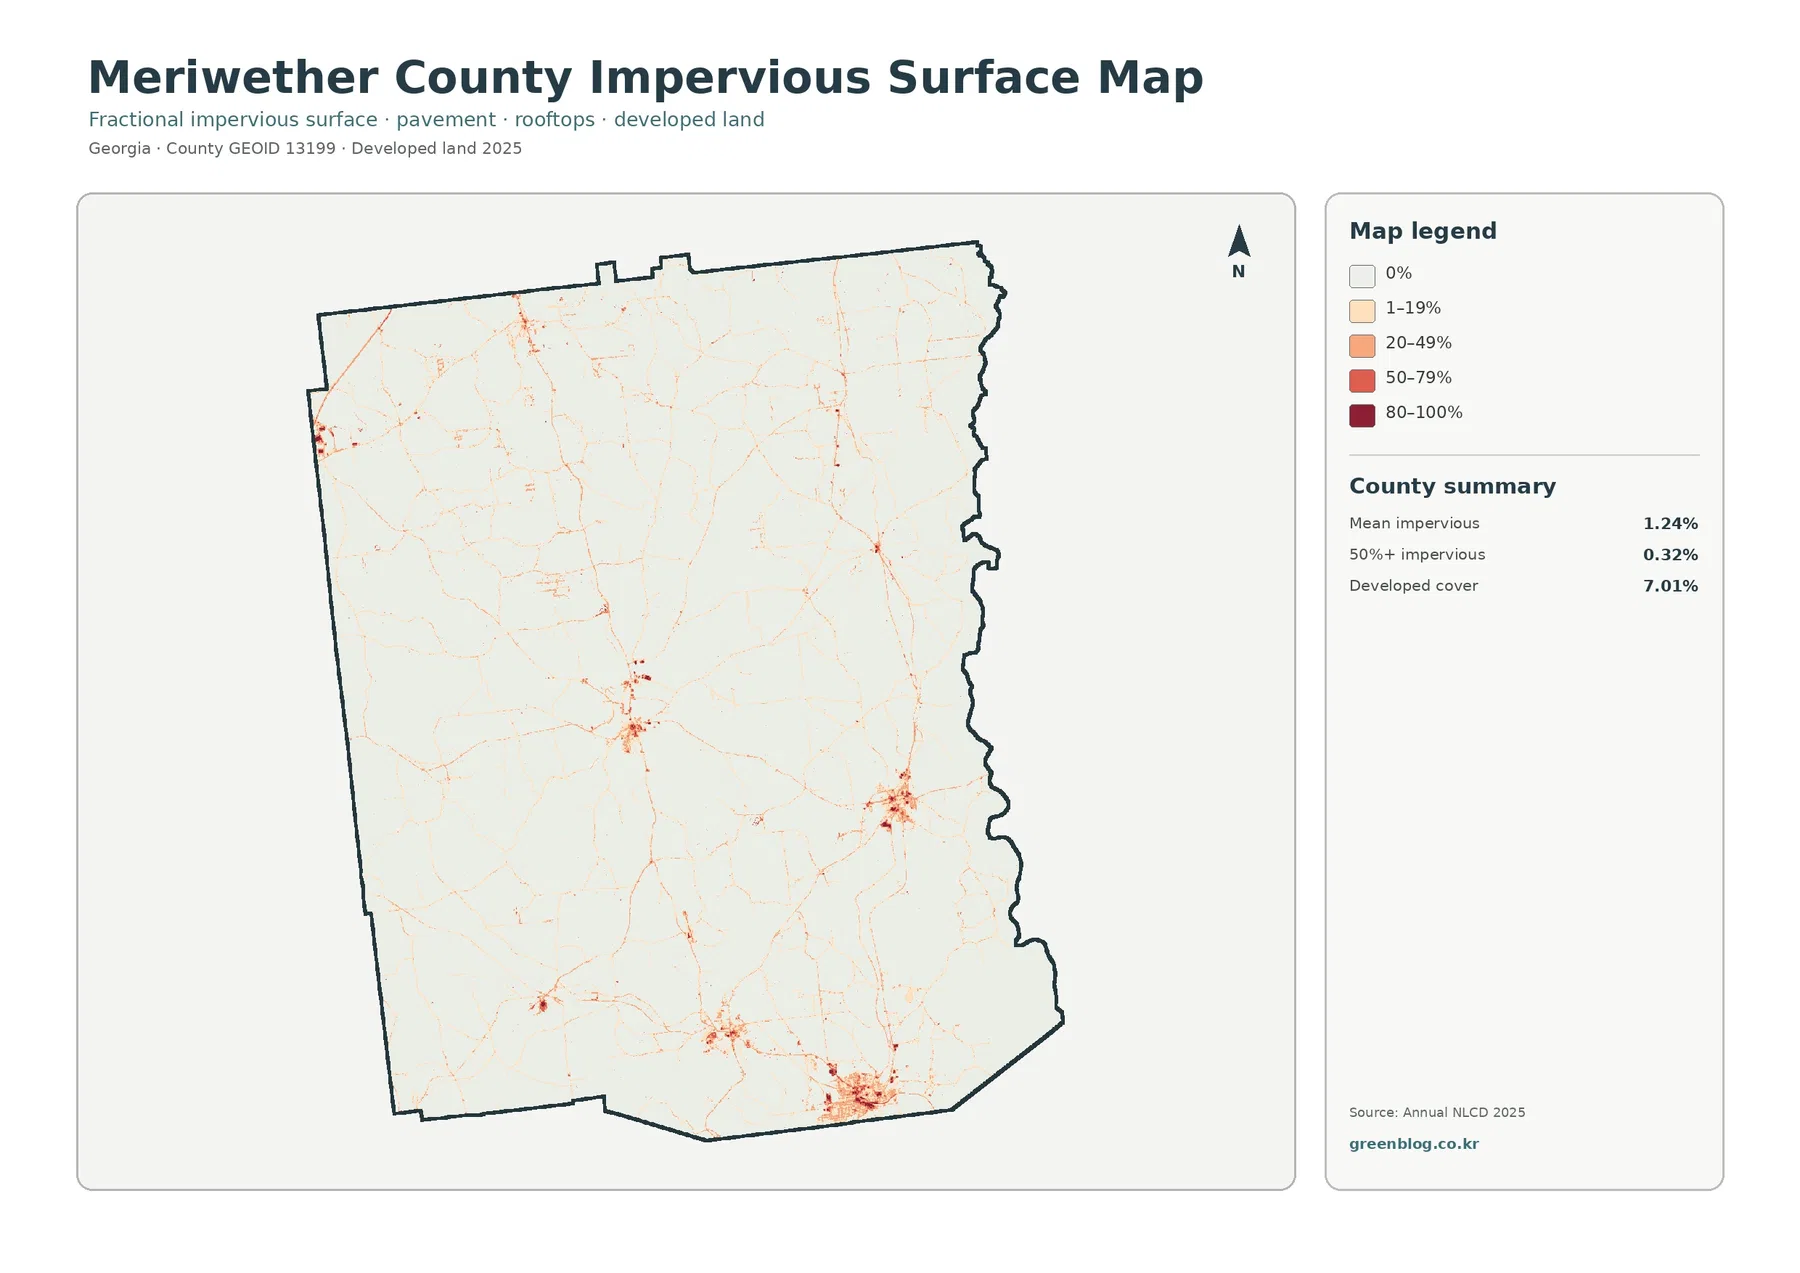
The strongest impervious values do not form one continuous urban field. A compact cluster appears near the middle, a larger group lies farther south, and additional concentrations sit toward the east and northwest. Thin low-intensity traces connect many of them. The broad spaces between these clusters remain almost entirely white or pale because hard surfaces occupy only a small fraction of the surrounding countryside.
Meriwether County’s official city information lists Greenville, Manchester, Warm Springs, Woodbury, Luthersville, Gay, and Lone Oak. The state comprehensive plan identifies Greenville as the county seat and Manchester as the county’s largest city. Those facts help explain why the raster contains several distinct built nodes instead of one dominant metropolitan footprint.
Forest covers 58.65%, but fields and open land repeatedly interrupt the green
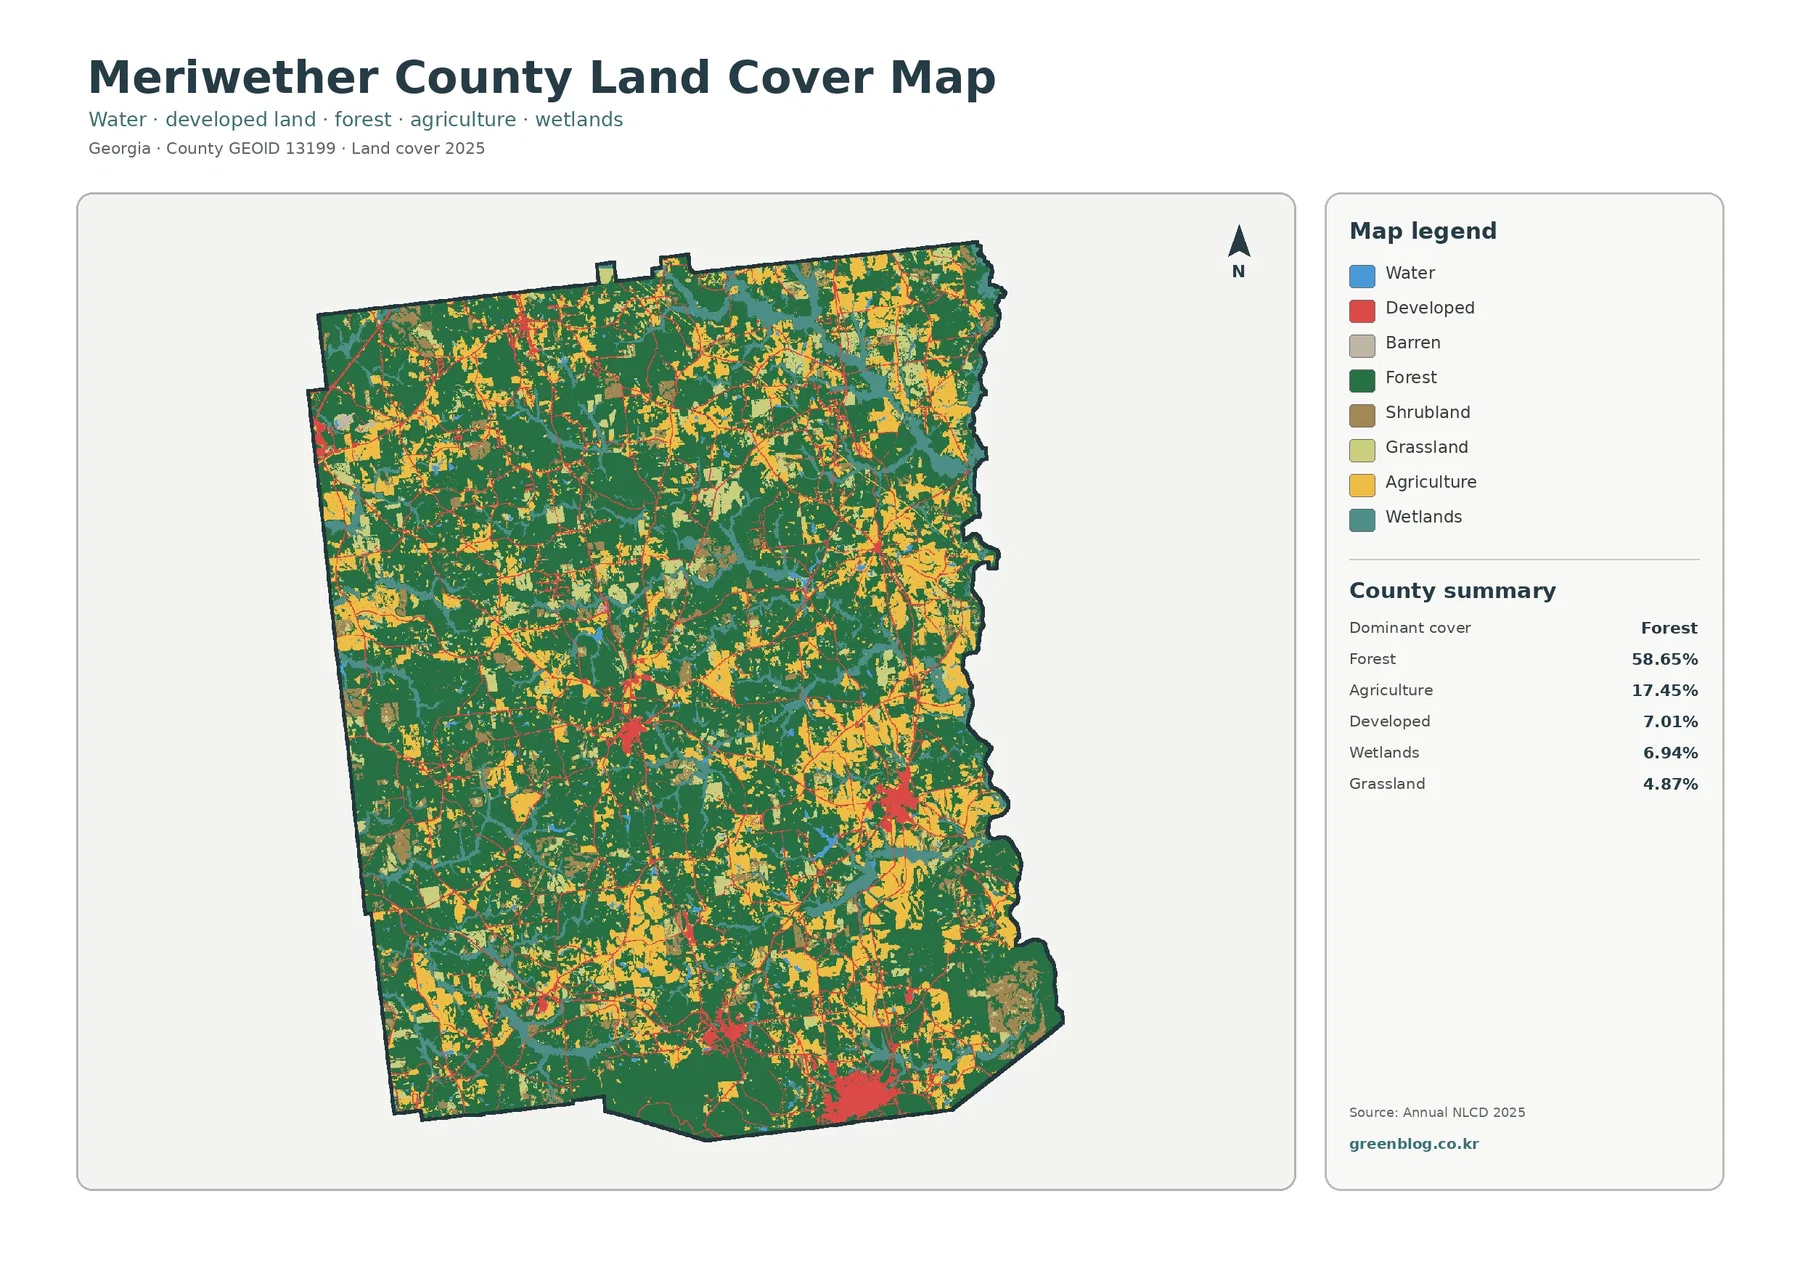
Dark green forest is the background across much of the county, especially through the northwest, west-central area, southwest, and large parts of the north. Even the eastern side contains substantial wooded blocks. The 58.65% share therefore represents a genuine countywide pattern rather than one isolated forest district.
Agriculture accounts for 17.45%. Yellow farm areas are more frequent in the east, northeast, and southeast, but they also occur in the center and west. The fields are repeatedly separated by woodland, grass, and settlement. Meriwether County looks less like a single farm belt than a wooded county with agricultural openings of many sizes.
Developed land is 7.01%, wetlands 6.94%, and grassland 4.87%. The vegetation summary also gives shrubland 4.06% and open water 0.92%. Wetlands form narrow bands and wider patches through the center and other low-lying areas, while blue open water is much less extensive. Teal wetland cover should not be treated as if it were all river or lake surface.
The vegetation view reveals a stronger farm presence in the east and southeast
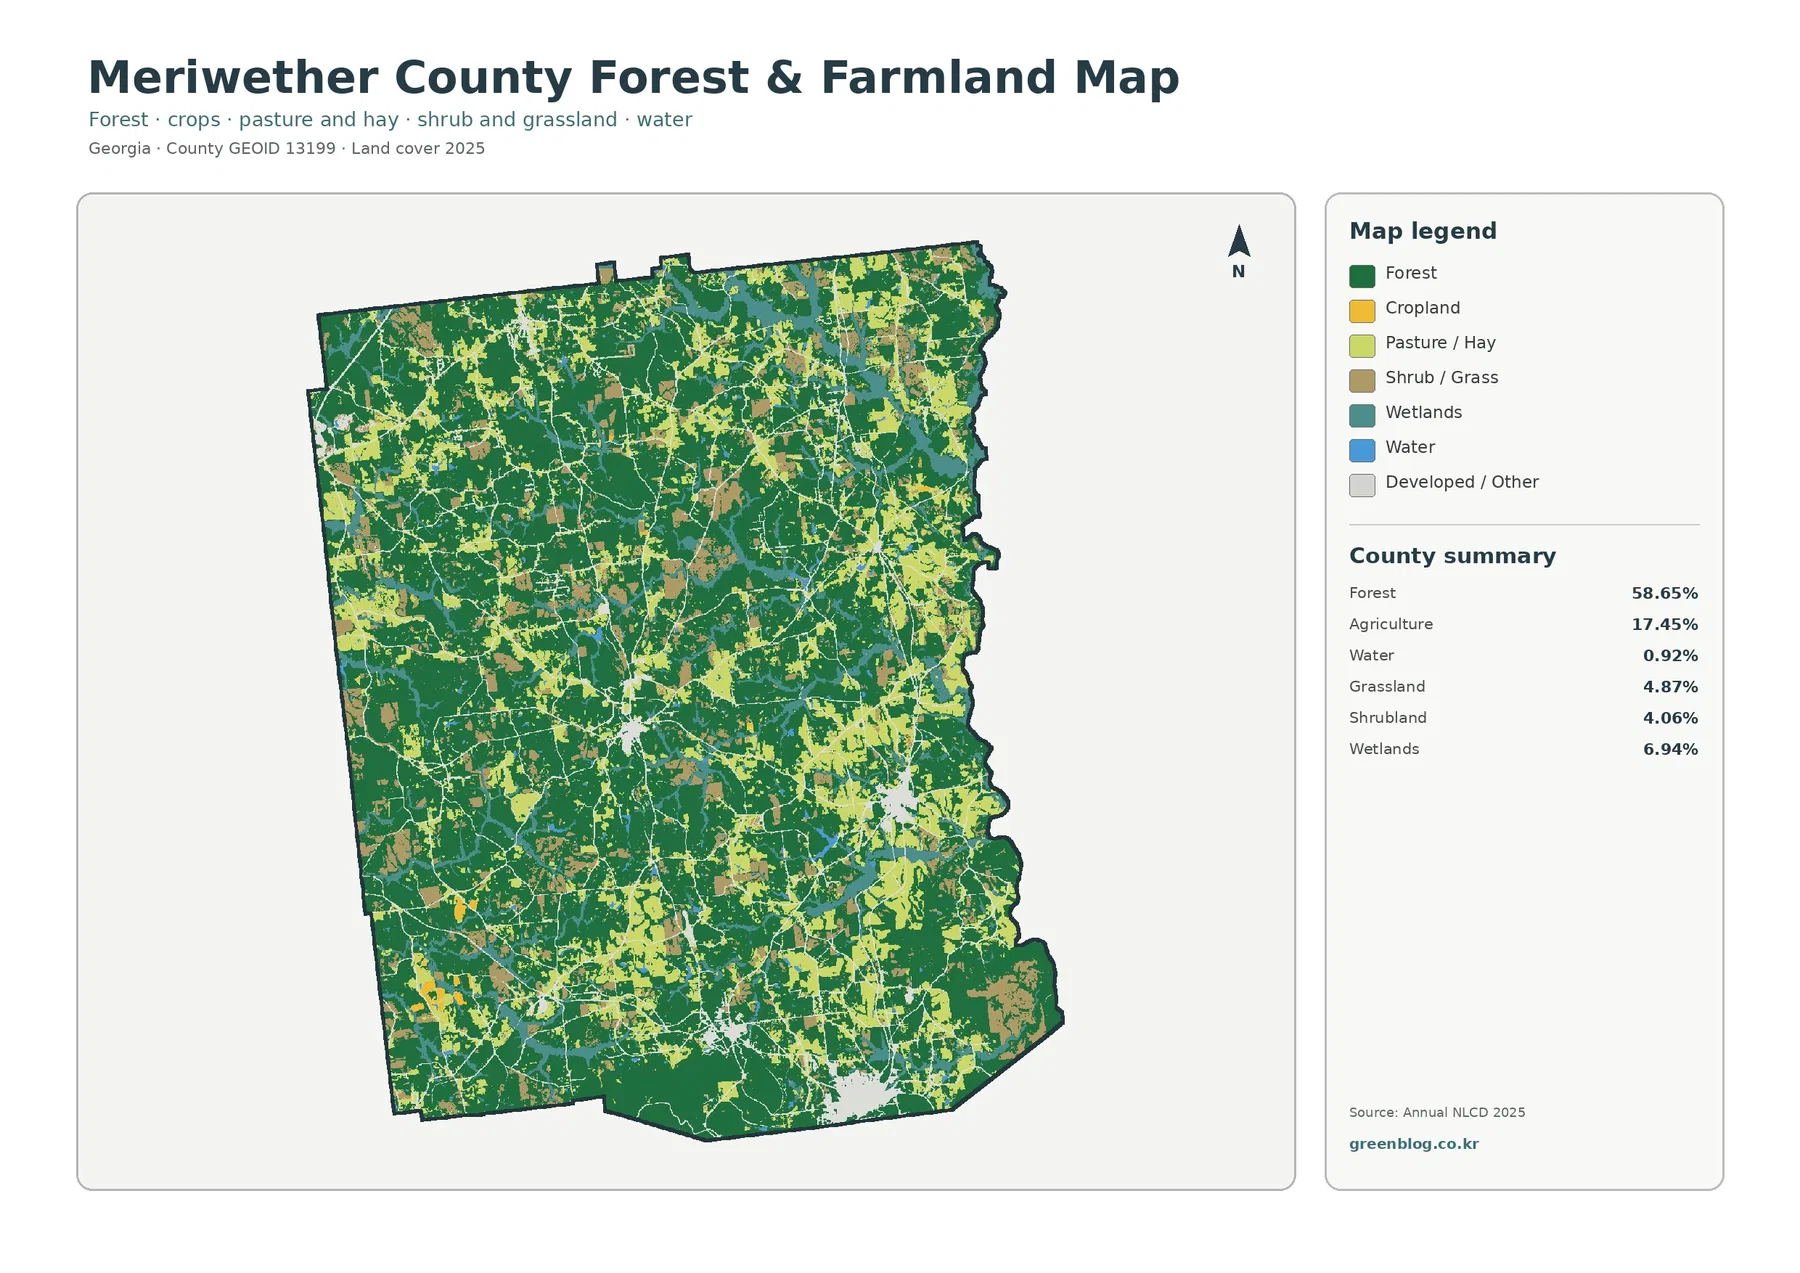
Without the strong developed color, differences within the rural landscape become clearer. Large green forest blocks dominate much of the west and center, while yellow cropland and lighter grass cover are more common toward the eastern and southeastern portions. The north remains wooded overall, but farm openings continue there as well.
Meriwether County Extension supports farmers and landowners with information on crops, livestock, fruits and vegetables, natural resources, and testing for soil, water, and forage. That local service context confirms that agriculture and land management remain practical county concerns. It does not mean that a yellow raster cell can be identified as a specific crop or farm operation.
Grassland at 4.87% and shrubland at 4.06% fill many of the transitions between forest and agriculture. These open surfaces appear in small and medium patches instead of one continuous zone. Their distribution helps explain why the countryside can look varied even where forest remains the largest statistical class.
A 1.24% impervious mean shows how small the truly hard-surface footprint remains
Countywide mean impervious cover is 1.24%, and only 0.32% of the county is mapped at 50% impervious surface or higher. Those values are far below the 7.01% developed-land share. Developed classes can include lawns, trees, yards, and bare soil around homes and roads, whereas the impervious product isolates roofs, pavement, parking areas, and other hard surfaces.
Road-shaped traces should not be turned into named highways from this image alone. Route names, rights-of-way, and traffic counts are not part of the impervious product. Census TIGER/Line or current local transportation data are better companions when the exact road network matters.
The 1985–2025 endpoint map is dominated by forest and other class differences, not development
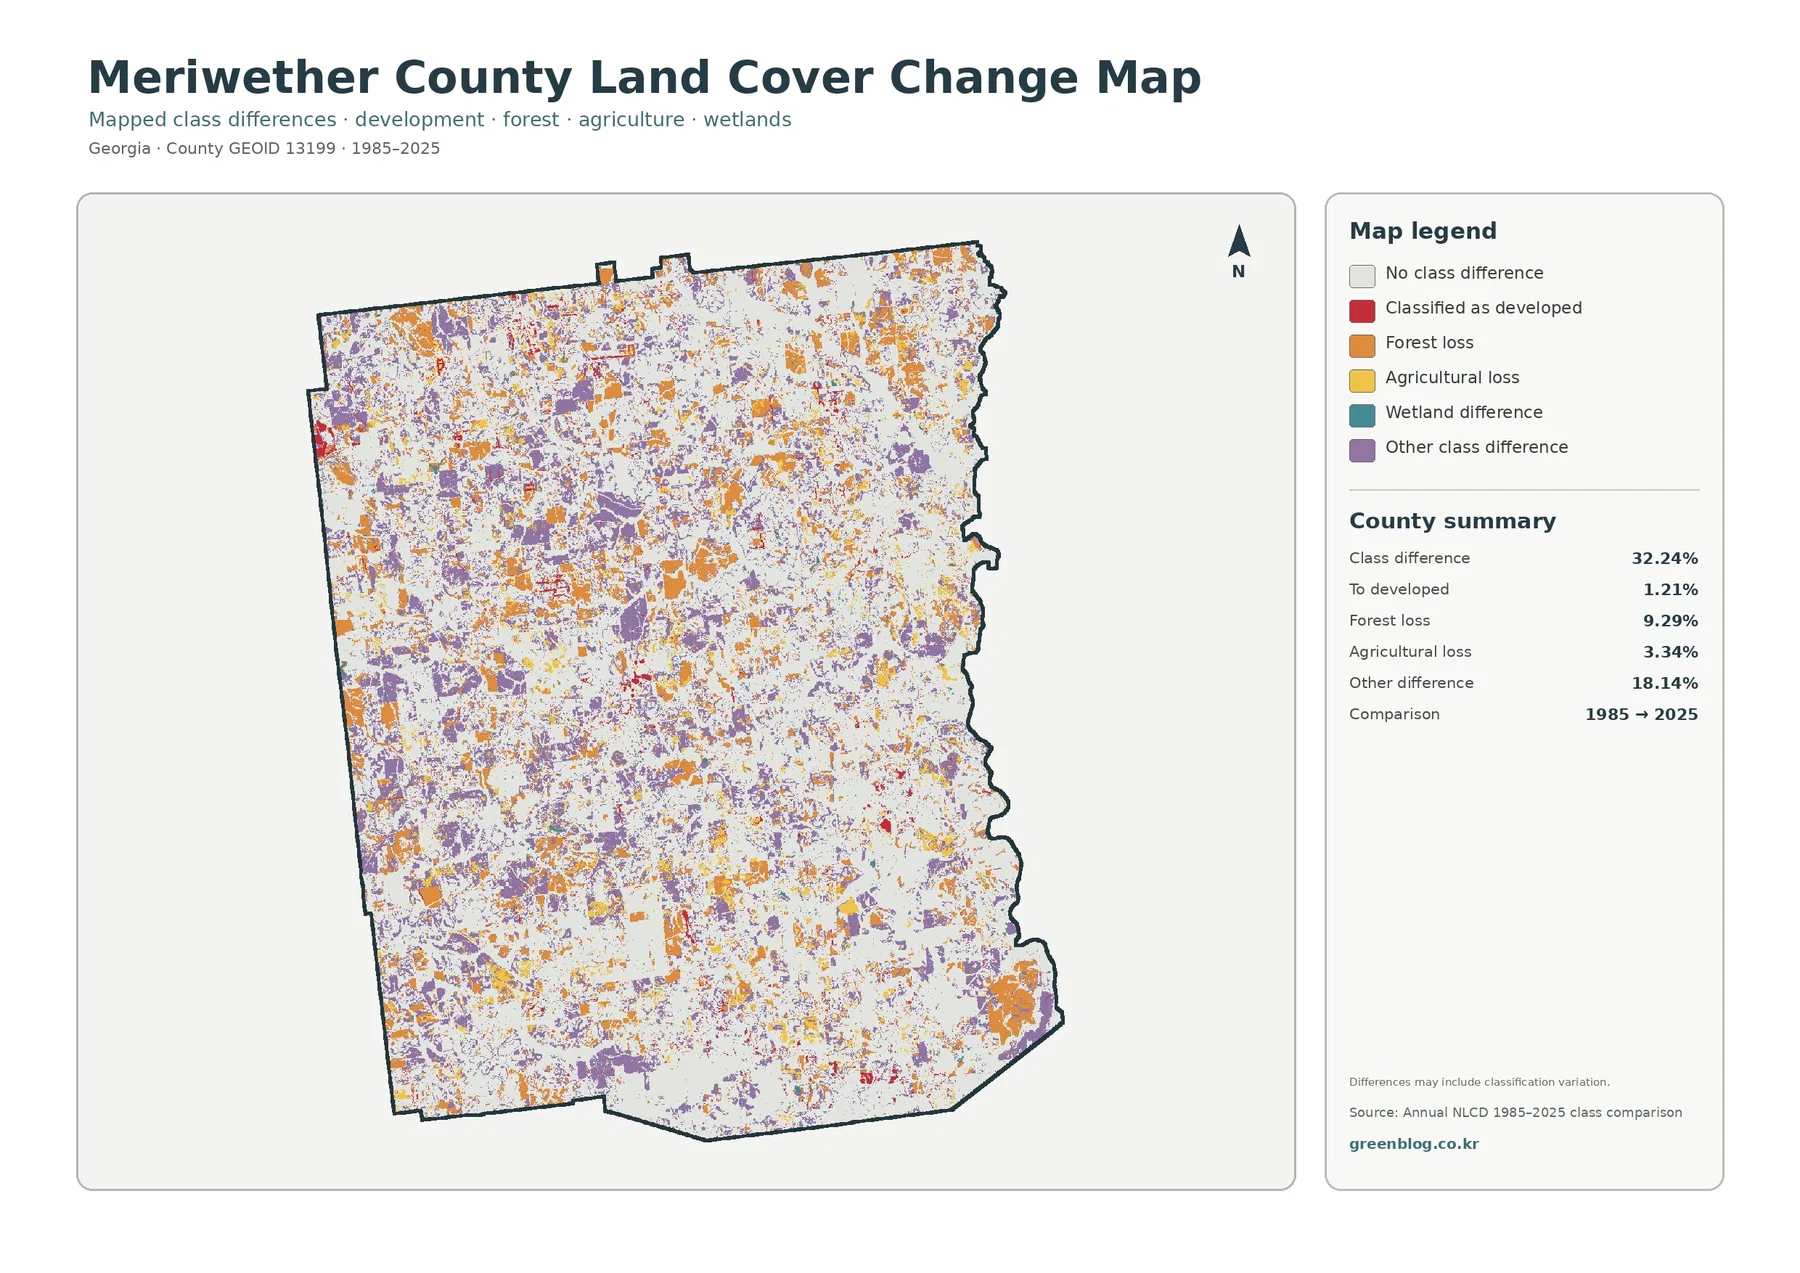
The total class difference between 1985 and 2025 is 32.24%. This is the share of raster cells whose category differs between the two endpoint years, not the portion of Meriwether County that was damaged or converted to urban land. The map itself notes that classification variation can be included in the result.
The printed summary lists 18.14% other difference, 9.29% forest loss, 3.34% agricultural loss, and 1.21% classified to developed. Red developed-change cells appear around the same separated settlement centers seen on the impervious map. Orange forest-loss and purple other-difference cells are much more widespread across every part of the county.
Wetland difference appears in the legend without a separately printed percentage. The missing rate should not be created by subtracting the listed categories from 32.24%. A forest-loss label also does not identify the cause. Timber activity, farming transitions, development, storms, regrowth, or classification variation require intermediate imagery and other evidence.
Local landmarks add context, but the land-cover raster does not map them directly
Annual NLCD uses 30-meter raster cells, so narrow streams, small ponds, field edges, and isolated buildings can be generalized. The maps are suitable for countywide comparison, not precise site boundaries.
Land cover is not zoning or ownership. Green does not mark protected forest, yellow does not define a farm parcel, and red does not specify a legal development district. Site decisions require current local records.
Choose a map based on the question, then use the JPG package as a reference set
The 2025 countywide map is the strongest starting point for explaining the forest majority, farm distribution, wetlands, and separate settlement centers. The vegetation view is better when agriculture and woodland are the main subject. Use the impervious surface for roofs and pavement around town centers, and the endpoint comparison only when discussing how class labels differ between 1985 and 2025.
Each original JPG measures 2480 × 1754 pixels and works well for reports, lessons, and presentations. The package does not identify the files as meeting an A3 high-resolution reference, so test a proof before using them for a large-format print.
Frequently Asked Questions
What is the largest land-cover class in Meriwether County?
Forest is the largest class in the supplied 2025 summary at 58.65%. Agriculture follows at 17.45%, while developed land is 7.01% and wetlands are 6.94%.
Why is developed land 7.01% while mean impervious cover is only 1.24%?
Developed classes include more than roofs and pavement. Lawns, trees, yards, and bare ground can be part of a developed cell, while fractional impervious cover measures the harder surfaces that resist infiltration.
Does the 32.24% endpoint difference mean nearly one-third of the county was damaged?
No. It is the share of cells with different class labels in 1985 and 2025. The summary separately lists 18.14% other difference, 9.29% forest loss, 3.34% agricultural loss, and 1.21% classified to developed.
Sources and Reference Data
- MRLC Annual NLCD Data – official access to annual land-cover and comparison products
- USGS Annual NLCD Land Cover Classification – definitions for forest, agriculture, developed land, wetlands, and related classes
- U.S. Census Bureau TIGER/Line Shapefiles – authoritative county, place, and transportation layers for comparison
- Meriwether County – Our Cities – official county descriptions of Greenville, Manchester, Warm Springs, Woodbury, and other municipalities
- Georgia DCA – Meriwether County Joint Comprehensive Plan – official planning context for the county’s towns and natural landmarks
- UGA Extension – Meriwether County Agriculture & Natural Resources – local crop, livestock, soil, water, forage, and natural-resource services
Map File Information
The ZIP contains four original JPG maps for comparing Meriwether County's 58.65% forest cover, agriculture, dispersed town centers, impervious surfaces, wetlands, and 1985–2025 class differences.
- Included Files: Use only the versions confirmed in the article and supplied images
- File Type: Use the confirmed download contents
- Intended Use: Printing, education, presentations, and map-based projects
Related Maps
- Appling County Georgia Land Cover Map
- Atkinson County Georgia Land Cover Map
- Bacon County Georgia Land Cover Map
Green Map creates custom-edited map images using open geographic data sources such as geoBoundaries, Natural Earth, OpenStreetMap, and government open data.
These maps are edited visual materials, not raw data files, and are provided for education, documents, presentations, and graphic reference.