Wetlands are the largest surface class in Long County’s supplied 2025 data, covering 43.87% of the county. Forest follows at 32.77%, while developed land is only 6.32% and agriculture 2.97%. The built footprint is concentrated in a few small centers rather than spread evenly across the county. This Long County Georgia Land Cover Map compares those developed areas with the broad wet and wooded landscape around them.
This page pairs the 2025 countywide map with three focused views: vegetation and farmland, hard-surface intensity, and the difference between the 1985 and 2025 classifications. The WebP previews can be compared as you read, while one download below contains all four original 2480 × 1754 JPG files for lessons, local profiles, reports, or presentation graphics.
Table of Contents
The impervious view isolates a few built centers inside a mostly low-hard-surface county
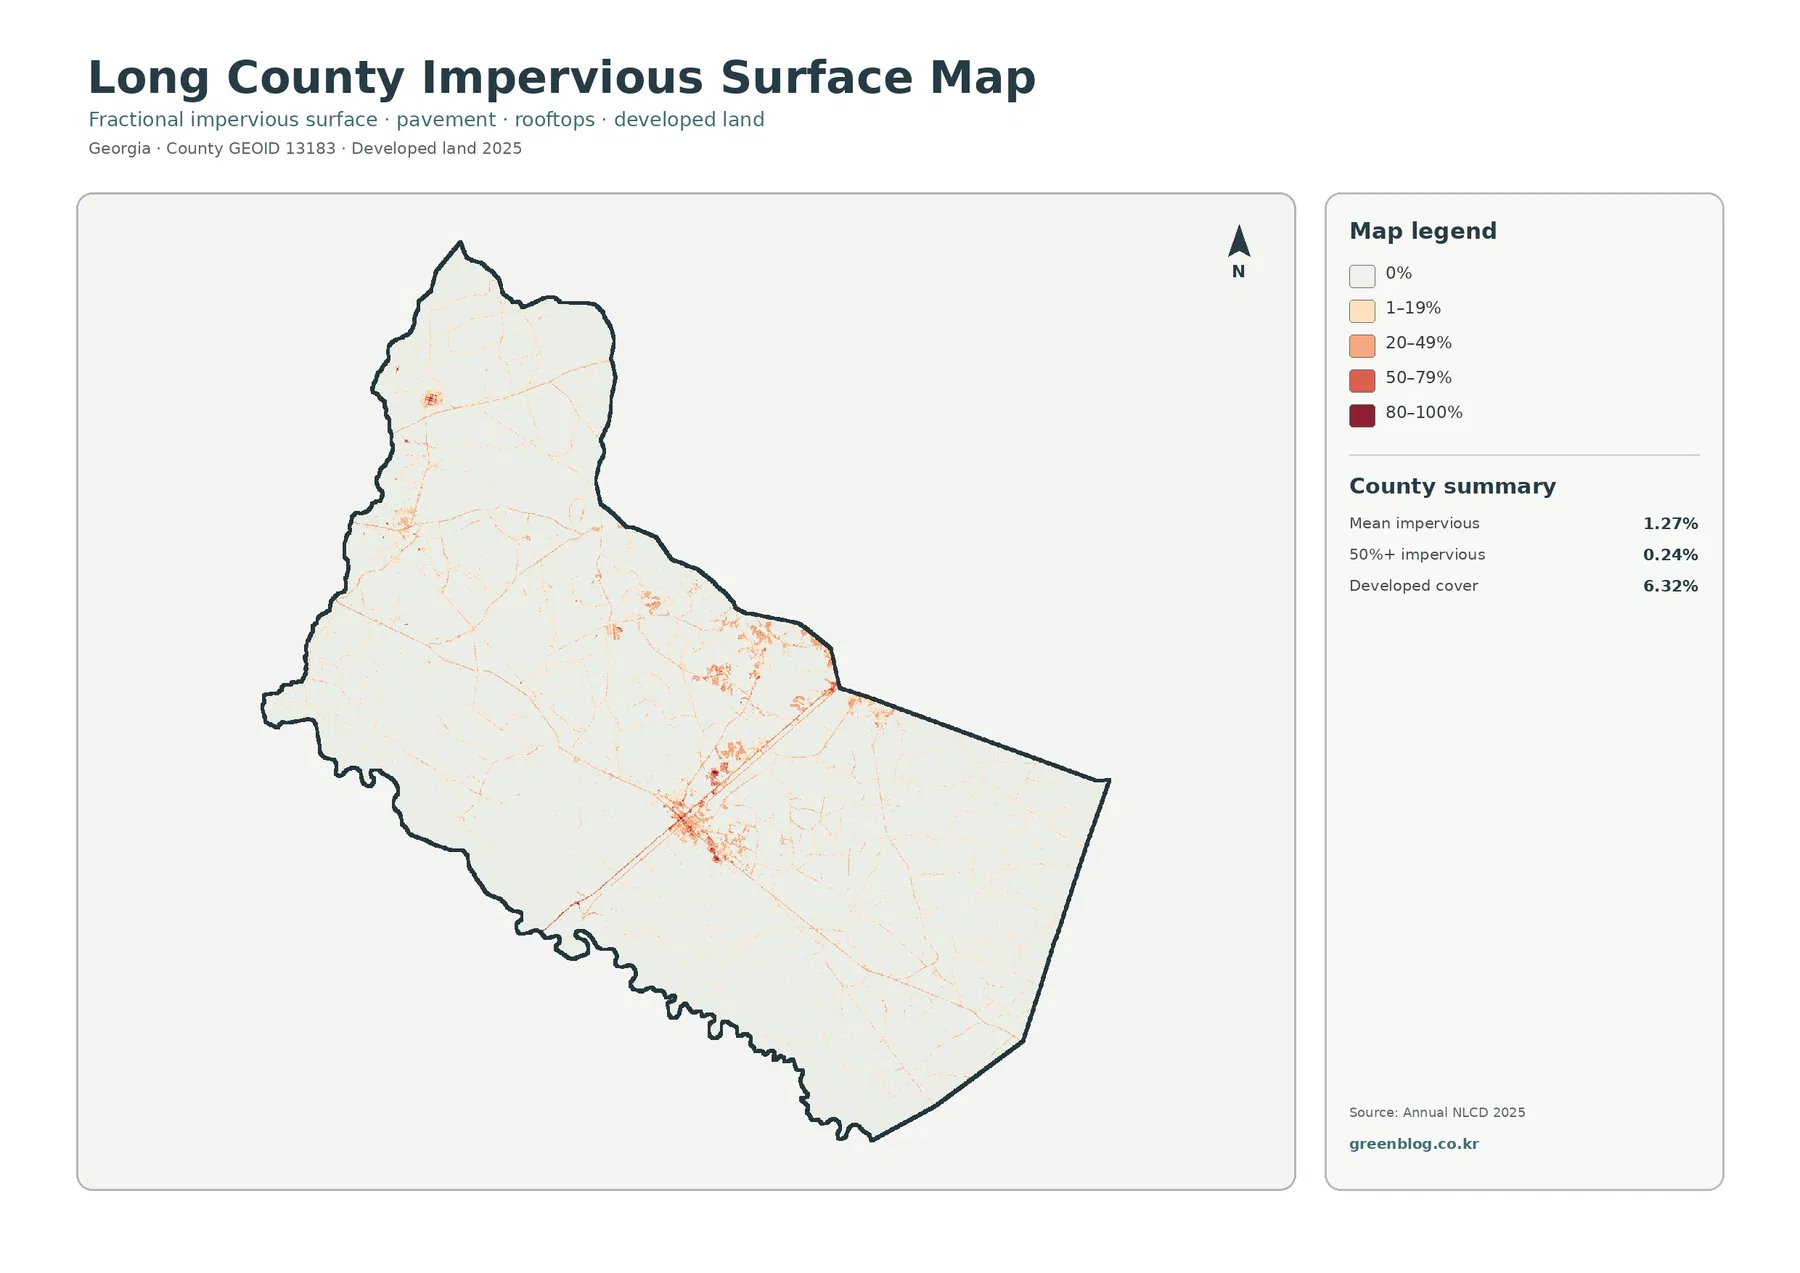
The strongest hard-surface concentration sits near the middle of the county, slightly toward the southern side. Long County government offices and the county Extension office are in Ludowici, which is the county seat, so the city provides useful context for this cluster. The raster itself does not print the city boundary, however. Individual orange or red cells should not be treated as a precise City of Ludowici outline.
Across Long County, the average impervious share is 1.27%, and just 0.24% of the county reaches an impervious level of 50% or more. Developed land covers 6.32%. The wider developed category also includes planted yards, trees, bare ground, and other surfaces that can still absorb water around buildings and roads. The impervious layer narrows the view to roofs, paved streets, parking areas, and other hard materials where water infiltration is limited.
Thin low-intensity lines extend outward from the main cluster, and smaller hard-surface groups occur in the north and northwest. They resemble road-oriented settlement, but the image contains no route names or traffic data. A specific highway or local road should be identified on a current transportation layer before it is named in a report based on this map.
Wetlands cover 43.87%, with forest filling many of the spaces between them
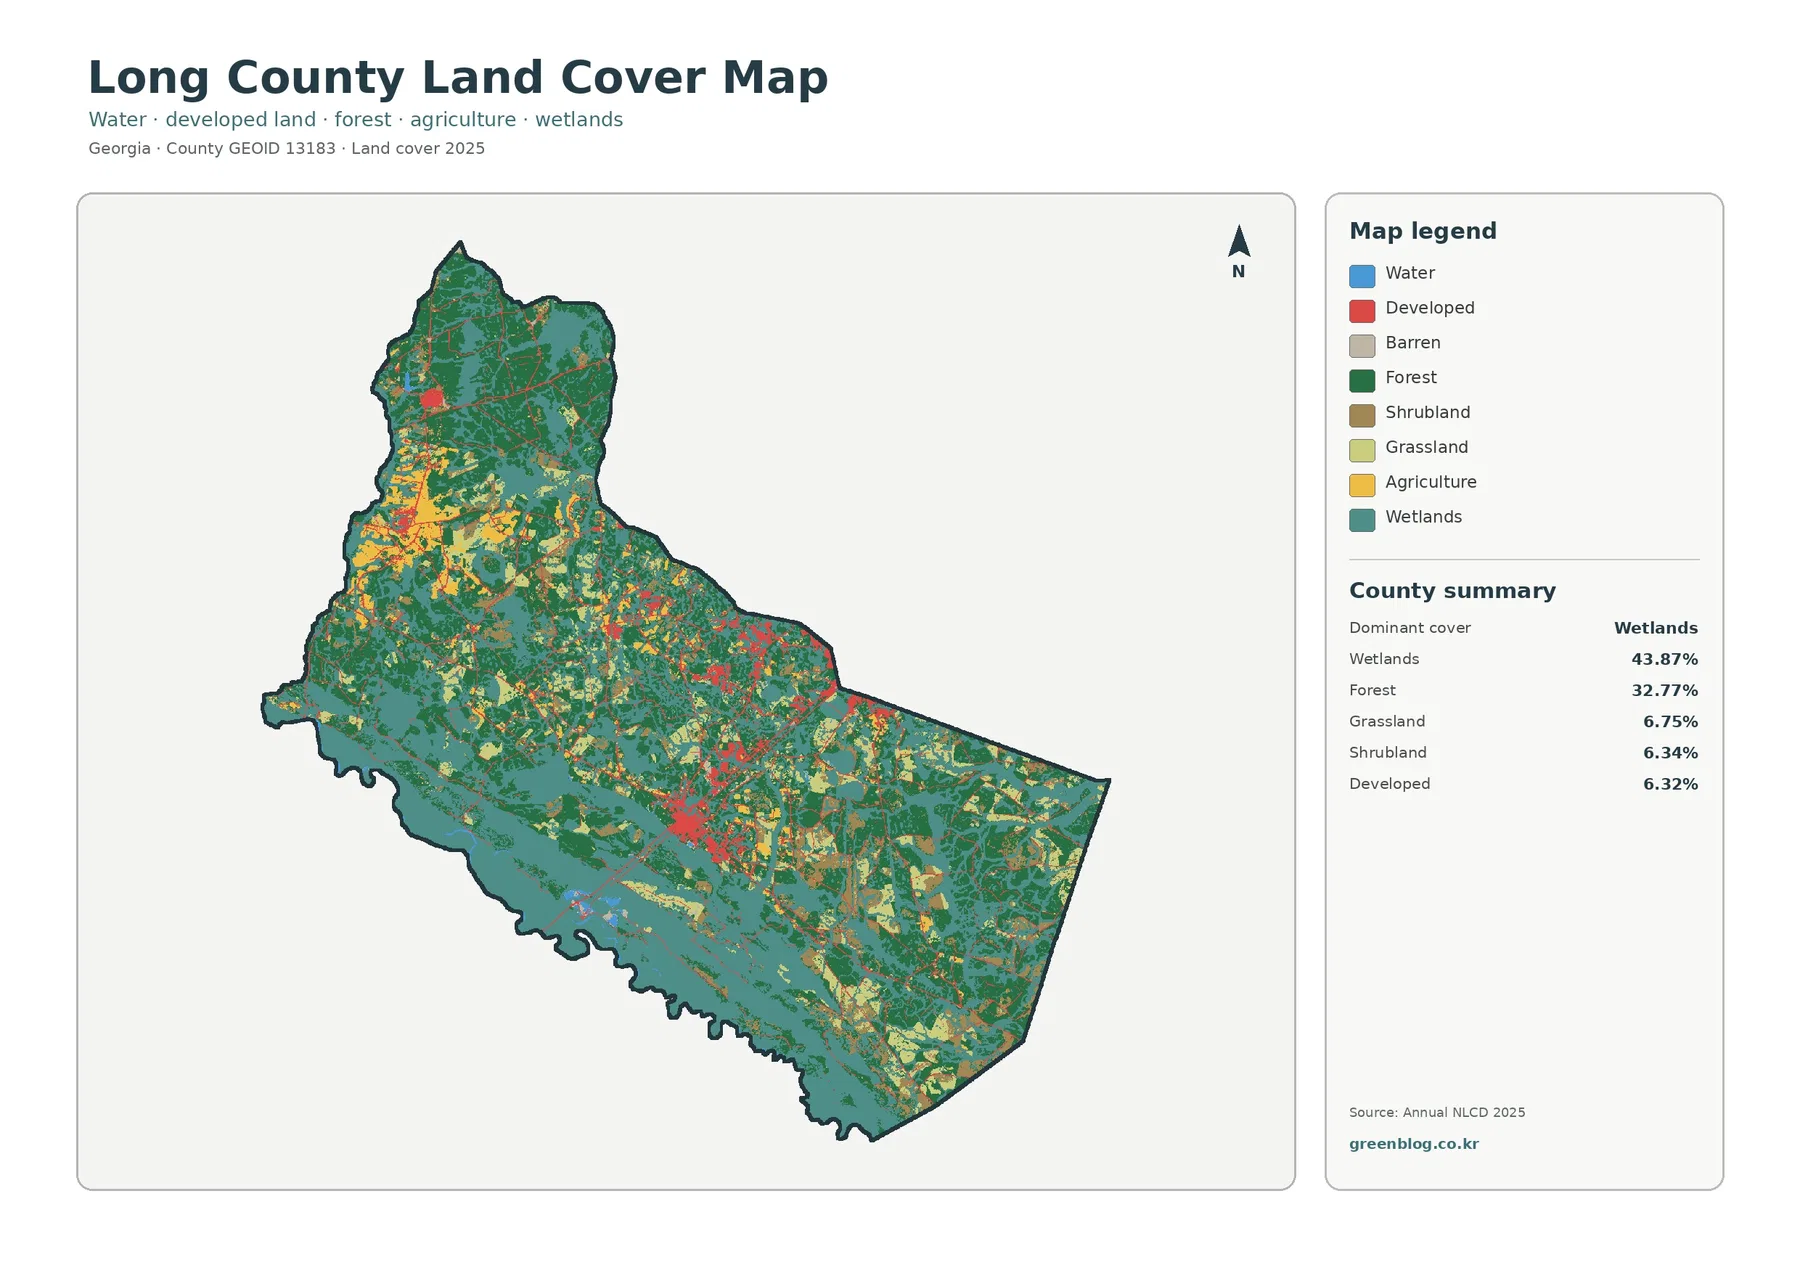
Teal wetland cells dominate the southwestern side and spread through the center and east in broad patches and branching bands. Additional wetlands reach into the northern portion. At 43.87%, the class occupies more than two-fifths of the county and is the first feature to establish when explaining the map. Long County is not simply a forested or agricultural county; wet ground is a major part of its mapped surface.
Forest accounts for 32.77%. Dark green areas are especially broad in the north and northeast, with other large blocks through the center and southeast. Forest frequently borders wetlands rather than occupying a separate zone. Together, the two classes cover most of the county, leaving developed, agricultural, grass, and shrub surfaces as smaller breaks within a predominantly natural landscape.
Grassland represents 6.75% and shrubland 6.34%, both close to the 6.32% developed share. Their lighter colors appear around forest edges, near some built areas, and across open portions of the central and eastern county. Agriculture is much smaller at 2.97%, and open water is 0.67%. These smaller classes are easier to understand after the wetland-forest majority has been established.
The Altamaha River boundary explains why the southwest deserves separate attention
Long County’s official history states that its entire southwestern boundary follows the Altamaha River. That geographic fact provides useful context for the broad wetland band and the limited open-water cells visible along the same side of the county. The land-cover image does not label the river or draw its channel centerline, so shape alone should not be used to identify a particular branch or water feature.
Open water covers only 0.67%, far below the wetland share, because blue cells represent exposed water while teal wetlands can include vegetation and saturated ground.
The northern tip has Fort Stewart context, but no installation boundary is drawn here
Long County government states that the northern tip of the county is occupied by Fort Stewart. That local fact matters because the northern map area contains broad forest and wetlands together with a small developed concentration. The supplied images, however, do not show a military-installation boundary, ownership, gates, training areas, or access restrictions.
The forest-and-farmland view emphasizes timber country more than cropland
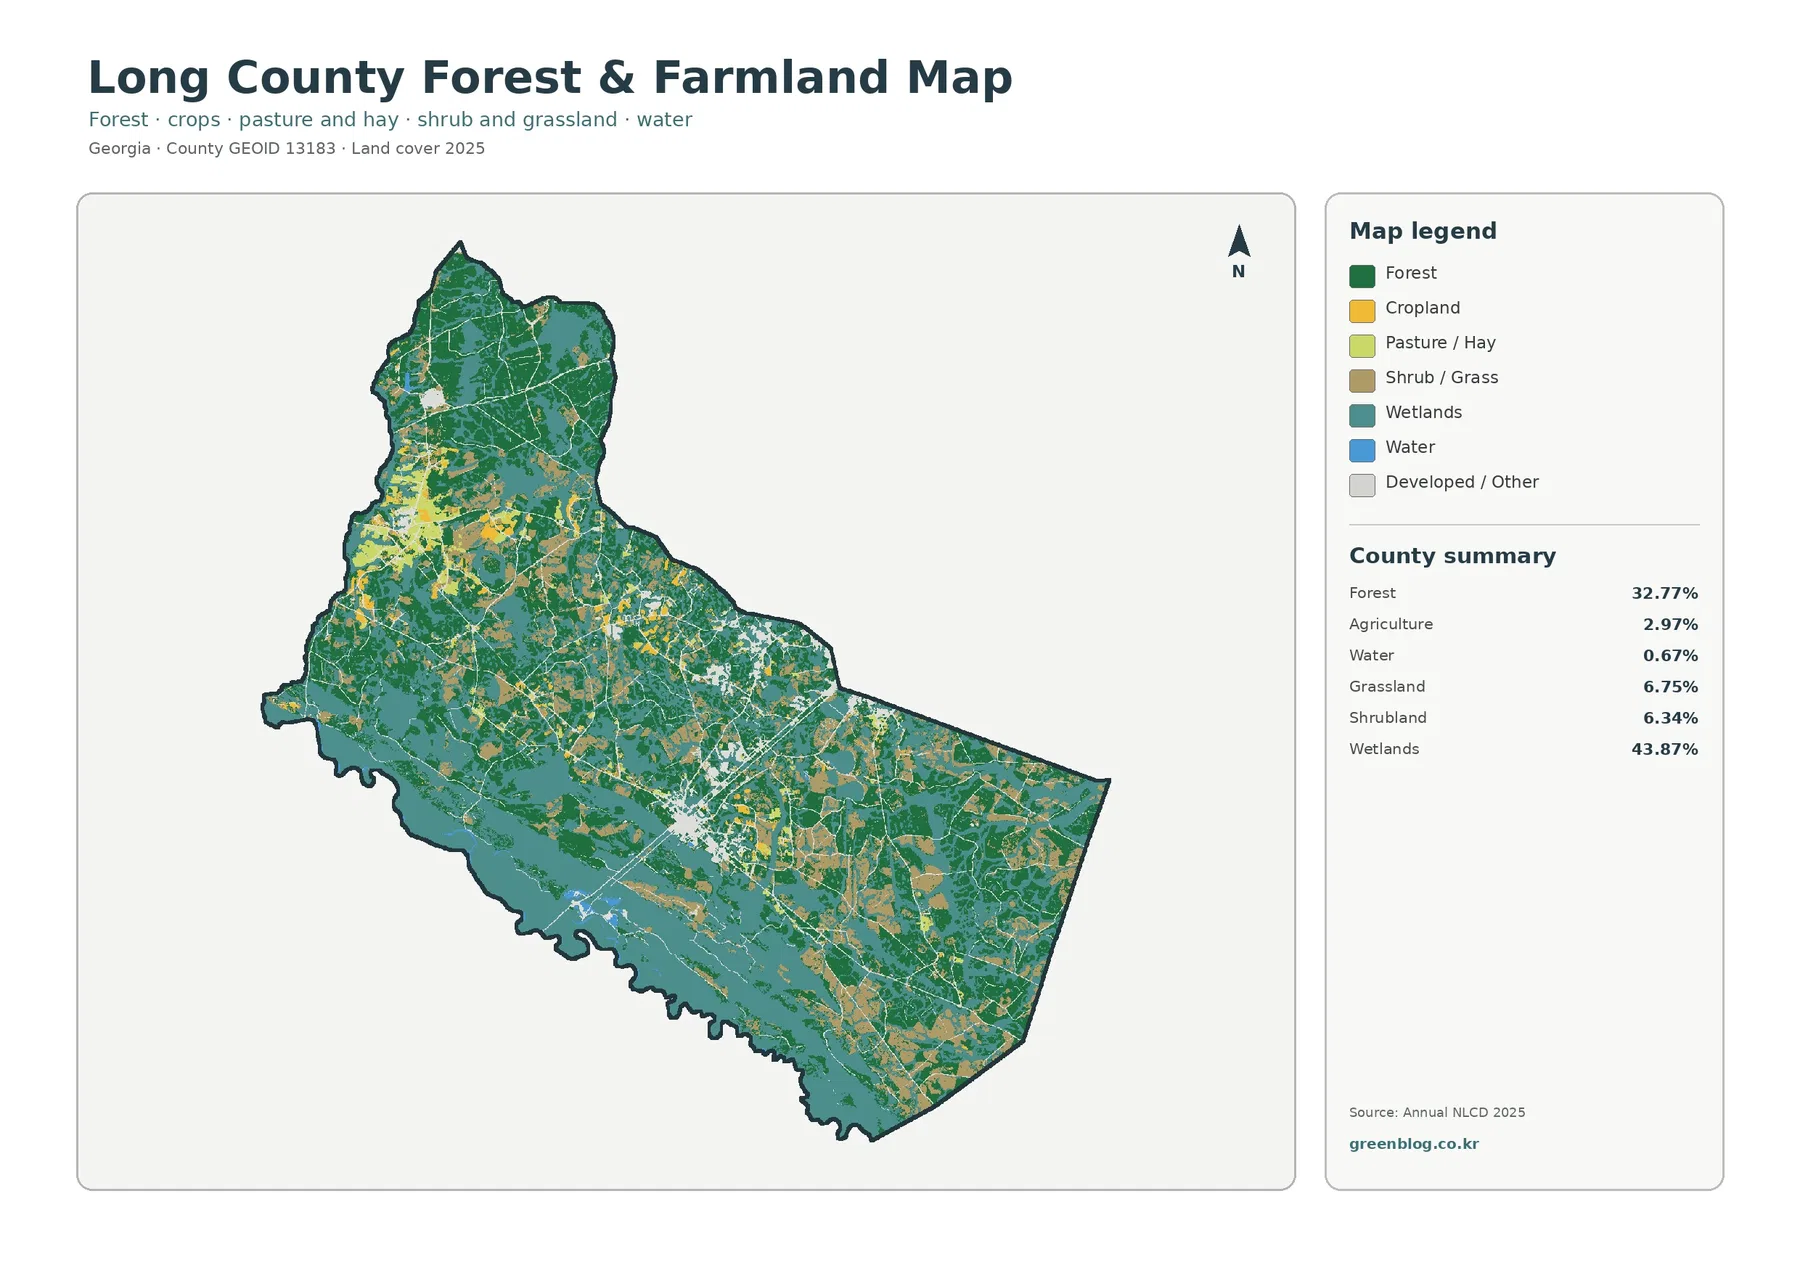
With the strong developed color reduced, the large northern forest blocks and the wetland-heavy southwest become easier to compare. Agriculture appears in relatively small yellow patches in the west-central, central, and eastern portions of the county. It never forms a broad continuous farm belt. Grass and shrub cover occupies more area and creates many of the open patches between forest, wetlands, and settlement.
Long County government describes pine forests as historically important to the local economy. UGA Extension’s county impact information likewise identifies timber as an influential commodity and provides assistance with forestry, forage, livestock, soil, water, and other natural-resource topics. This context supports discussing the county’s wooded character, but it does not make every green pixel commercial timberland.
The 1985–2025 difference map shows broad forest and other changes, not one simple trend
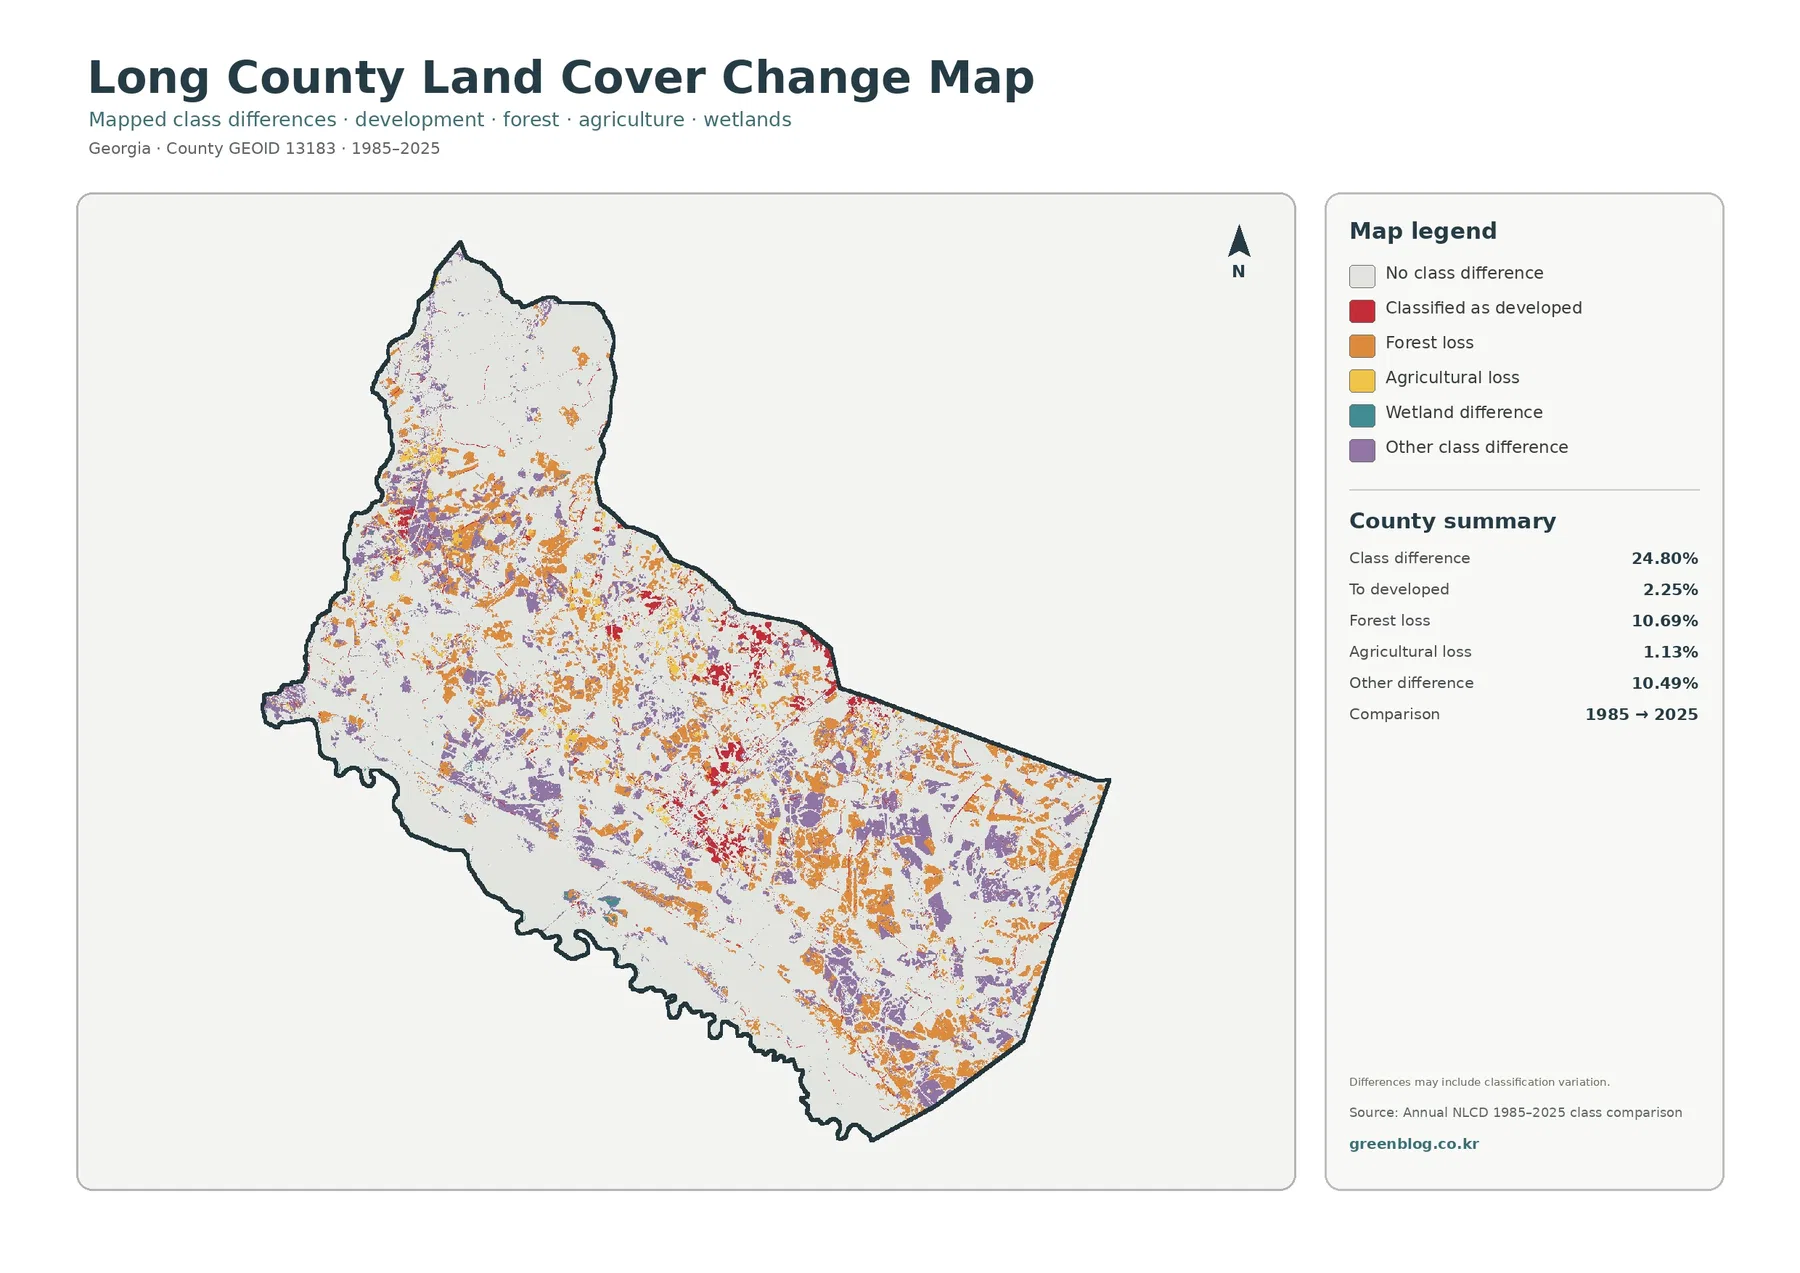
Comparing the two endpoint years, 24.80% of Long County’s mapped cells carry a different land-cover label in 2025 than they did in 1985. It measures disagreement between the two endpoint classifications rather than the acreage of one particular kind of change. Accordingly, the 24.80% figure should not be read as a countywide total for clearing, damage, or urban development. The figure also warns that some differences can come from classification variation, including changes in image timing, seasonal appearance, mixed 30-meter cells, or model assignment.
The printed summary lists 10.69% forest loss, 10.49% other difference, 2.25% classified to developed, and 1.13% agricultural loss. Orange forest-loss and purple other-difference cells are scattered across large parts of the county. Red developed-change cells form more localized groups around the central, northern, and eastern built areas. The pattern is too varied to describe as an urban-growth map alone.
Wetland-related differences have their own legend color, yet the summary does not publish a separate percentage for that category. Because that value is not supplied, deriving a remainder from the other categories would create a number that the source itself does not report. Here, “forest loss” only indicates that a cell labeled forest in 1985 belongs to a different mapped class at the 2025 endpoint. The endpoint comparison alone cannot tell whether that difference came from timber activity, development, storm effects, vegetation recovery, or classification uncertainty.
The four original JPG maps are available as one download
Use the 2025 land-cover map for a countywide introduction, the vegetation view for forest and open-land comparison, the impervious map for roofs and pavement, and the endpoint map for 1985–2025 class differences. Each JPG measures 2480 × 1754 pixels and works well for screens, reports, classroom handouts, and presentation graphics. The supplied package does not certify these images as high-resolution A3 output; make a test print before using one at a large physical size.
Frequently Asked Questions
What is the largest land-cover class in Long County?
Wetlands are the largest class in the supplied 2025 summary at 43.87%, followed by forest at 32.77%. Together they cover most of the county, while developed land, grassland, shrubland, agriculture, and open water occupy smaller shares.
Why is developed land 6.32% while mean impervious cover is only 1.27%?
Developed classes can include lawns, trees, yards, and open soil around roads and buildings. Fractional impervious cover isolates roofs, pavement, parking areas, and similar hard surfaces, so its countywide average is much lower.
Does the 24.80% class difference mean that much of Long County was damaged?
No. It is the share of cells assigned different classes at the 1985 and 2025 endpoints. The summary separately lists 10.69% forest loss, 10.49% other difference, 2.25% classified to developed, and 1.13% agricultural loss. Cause and timing require additional evidence.
Sources and Reference Data
- MRLC Annual NLCD Data – official access to annual land-cover and comparison products
- USGS Annual NLCD Land Cover Classification – definitions for wetlands, forest, developed land, agriculture, and related classes
- U.S. Census Bureau TIGER/Line Shapefiles – authoritative county, place, and transportation layers for comparison
- Long County Board of Commissioners – official county context on rural land, forests, and the northern Fort Stewart area
- Long County History – official background on Ludowici and the Altamaha River boundary
- UGA Extension – Long County Agriculture & Natural Resources – local forestry, agriculture, soil, water, and natural-resource information
Map File Information
The ZIP contains four original JPG maps for comparing Long County's 43.87% wetland cover, 32.77% forest, Ludowici-area development, impervious surfaces, and 1985–2025 class differences.
- Included Files: Use only the versions confirmed in the article and supplied images
- File Type: Use the confirmed download contents
- Intended Use: Printing, education, presentations, and map-based projects
Related Maps
- Appling County Georgia Land Cover Map
- Atkinson County Georgia Land Cover Map
- Bacon County Georgia Land Cover Map
Green Map creates custom-edited map images using open geographic data sources such as geoBoundaries, Natural Earth, OpenStreetMap, and government open data.
These maps are edited visual materials, not raw data files, and are provided for education, documents, presentations, and graphic reference.