Laurens County has no single land-cover class that overwhelms the rest of the 2025 map. Forest leads at 30.81%, wetlands cover 21.71%, agriculture adds 19.25%, and developed land accounts for 9.98%. The largest built concentration is near the middle of the county, while broad wetland areas and a patchwork of woods and farms extend around it. This Laurens County Georgia Land Cover Map is designed to make those contrasts easy to compare.
The article includes four views: current land cover, forest and farmland, fractional impervious surface, and a 1985–2025 endpoint comparison. WebP previews appear with the discussion, and the four original 2480 × 1754 JPG maps are available together in one ZIP. They can be used for county profiles, lessons, presentations, and broad environmental comparison when the limits of a 30-meter raster are kept in mind.
Table of Contents
Hard surfaces identify one main built center inside a mostly rural county
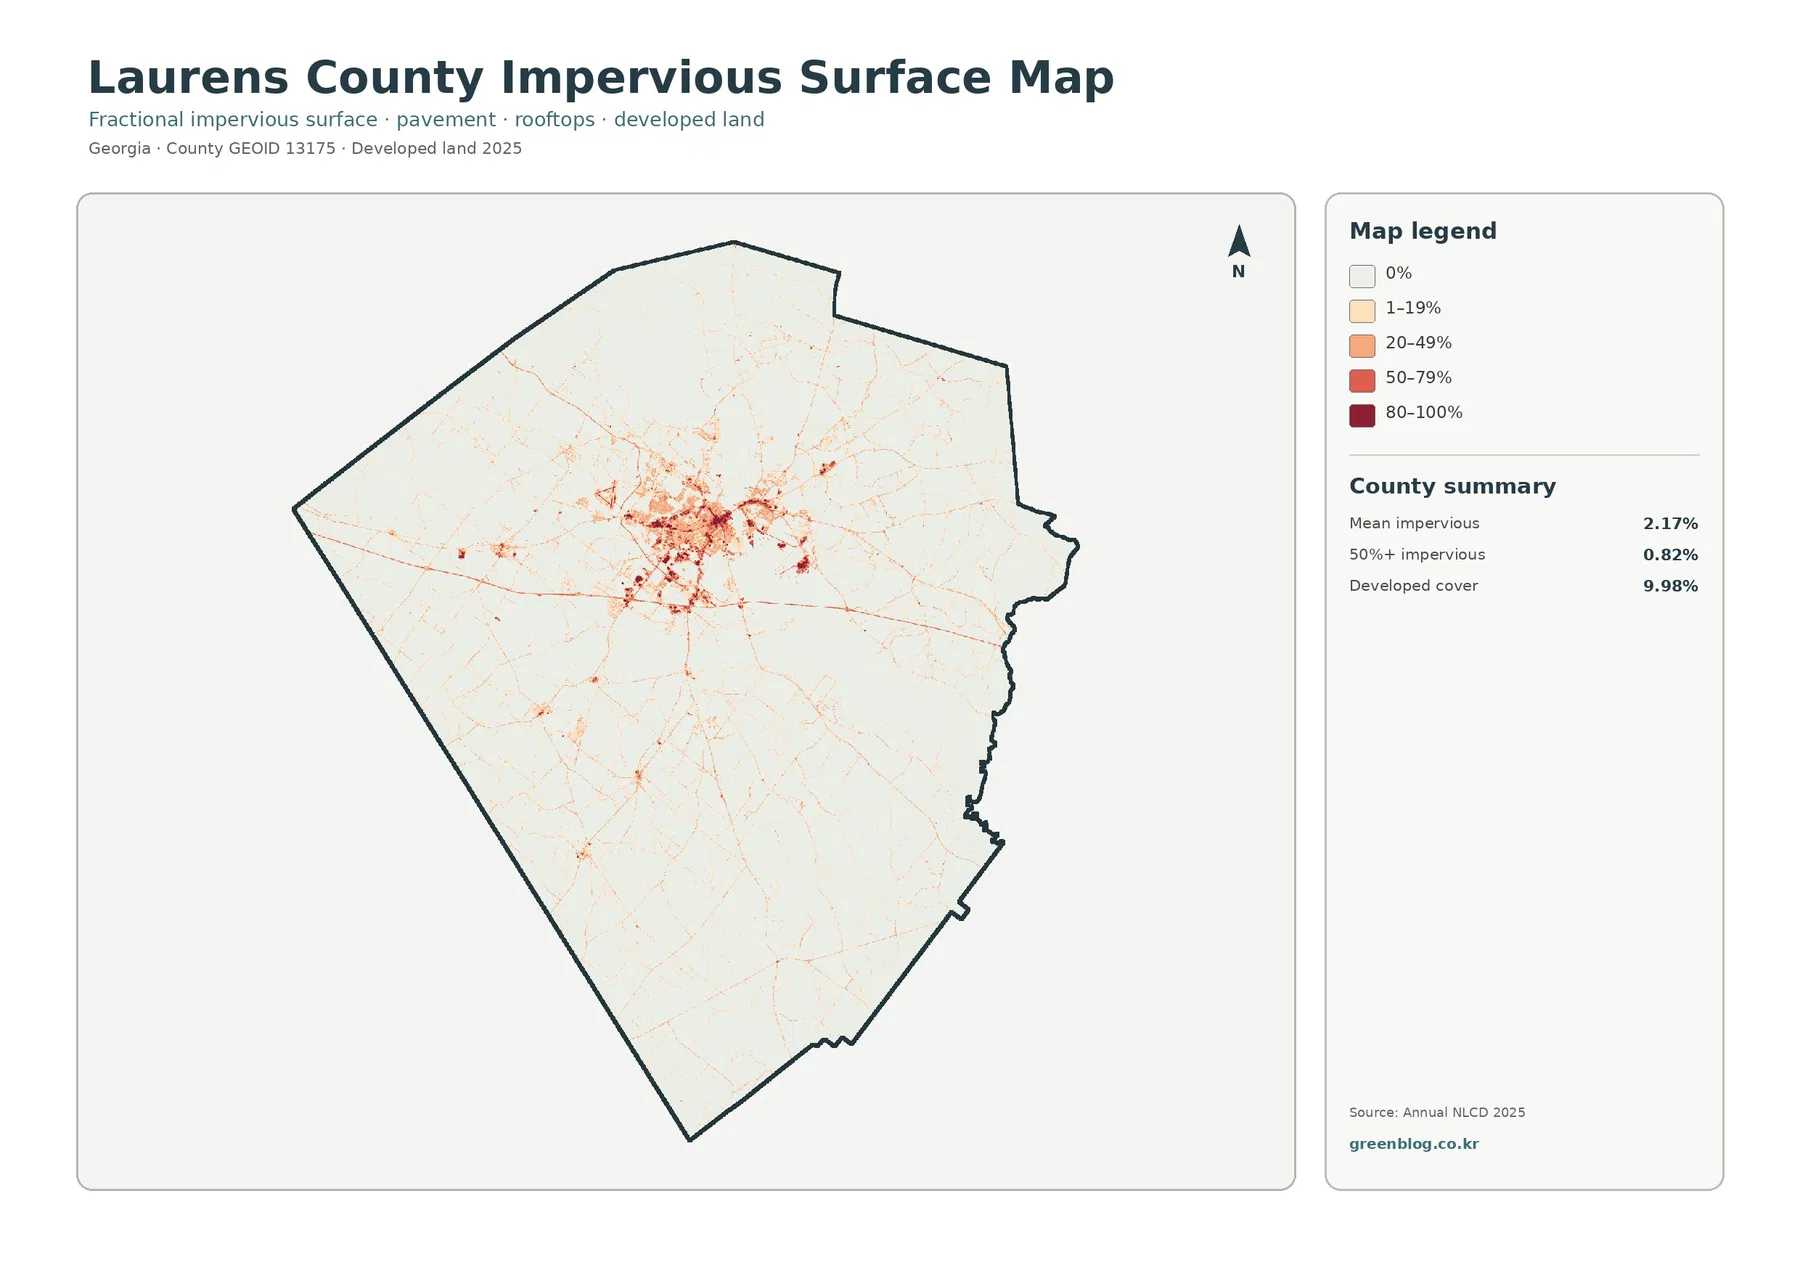
The impervious map makes the central built area stand out immediately. Darker values form a compact cluster near the middle of the county, surrounded by lighter developed surfaces. Thin lines extend outward in several directions, while most of the southern half and outer edges remain pale. The pattern is consistent with one principal urban area connected to smaller settlements and road-oriented development rather than a continuous metropolitan surface.
Laurens County’s mean impervious cover is 2.17%, and only 0.82% of the county is mapped at 50% impervious surface or higher. Those numbers are much smaller than the 9.98% developed-land share. Developed classes can include lawns, trees, yards, bare soil, and other permeable surfaces around buildings and roads. Fractional impervious cover isolates the roofs, pavement, parking areas, and similar materials that do not readily absorb water.
County history identifies Dublin as the county seat, selected at a site on the Oconee River in the early nineteenth century. That makes Dublin a useful geographic reference for the large central development cluster, although the supplied image does not label the city or draw municipal boundaries. A particular dark patch should therefore be assigned to Dublin only after checking a verified place or parcel layer.
Wetlands form a broad central-eastern belt beside the development cluster
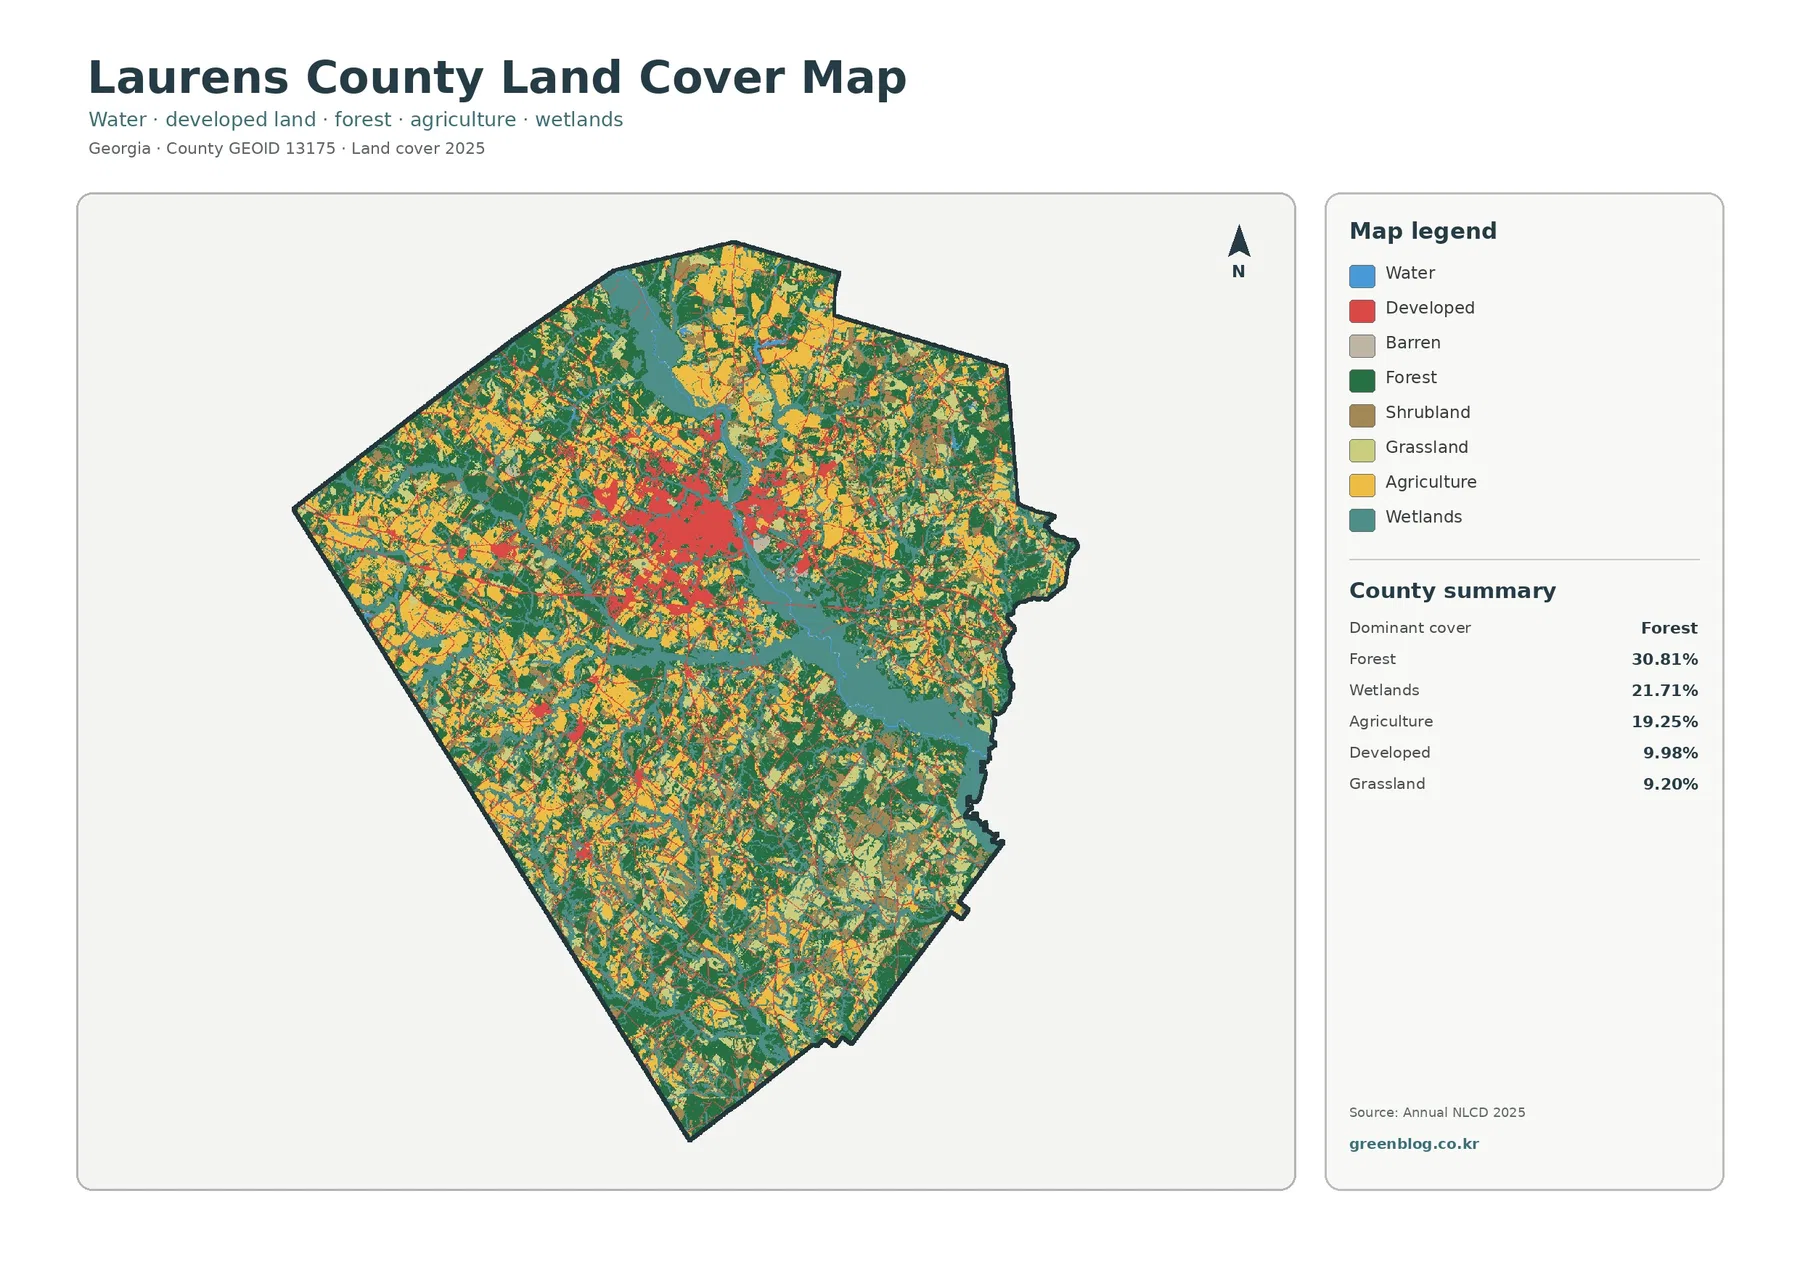
The full 2025 map shows why a single label such as “forest county” or “farm county” would be incomplete. Forest is the largest class at 30.81%, but wetlands at 21.71% and agriculture at 19.25% are not far behind. Dark green forest blocks occur throughout the county, yellow farm areas are frequent in the west and north, and teal wetlands form a conspicuous band through the central and eastern portions.
Laurens County’s official history places Dublin on the Oconee River, which provides useful context for the broad wetland and water-related pattern near the central built area. The land-cover map itself does not name the river, however, and its teal cells should not be treated as a precise river corridor. Wetland classifications can include wooded or herbaceous vegetation and saturated ground, not just open channels.
Open water covers only 0.80% in the focused vegetation summary, far below the wetland share. That difference is important for readers who might otherwise interpret every teal area as a lake or river. Blue water represents exposed water surfaces, while wetlands can remain heavily vegetated. Neither class establishes a legal wetland boundary, flood zone, property limit, or permit condition.
Forest and agriculture divide the rural landscape into many smaller blocks
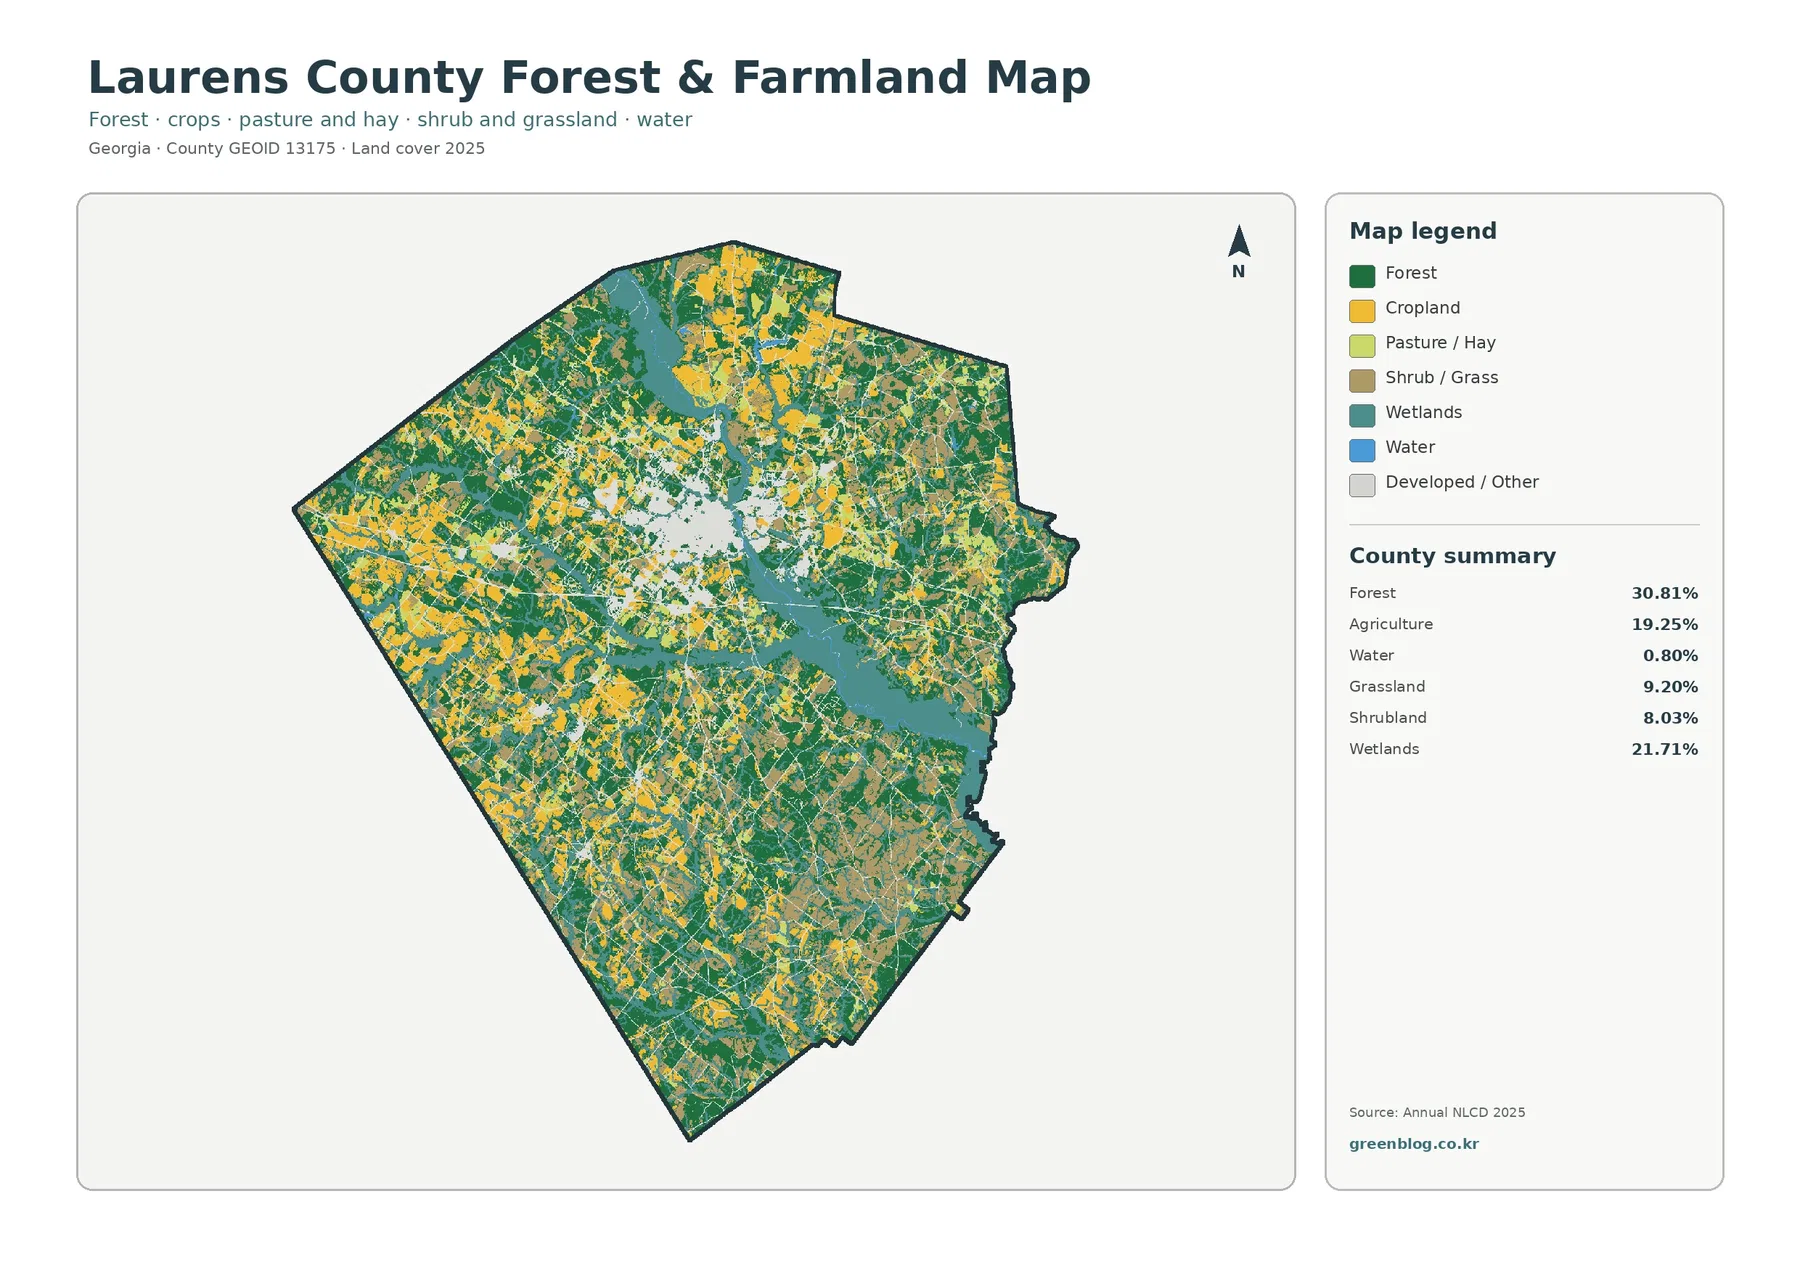
With developed colors reduced, the rural pattern is easier to follow. Agricultural blocks are especially frequent in the western and northern portions, but they are repeatedly interrupted by forest, wetland, grassland, and shrubland. The south and southeast contain more mixtures of forest, shrub or grass cover, and smaller agricultural openings. There is no single uninterrupted farm belt running across the county.
Grassland contributes 9.20% and shrubland 8.03%. Together they occupy a meaningful portion of the map and often appear along forest edges or between agricultural and developed areas. The labels describe broad surface cover rather than management history. A brown or light-green cell cannot by itself identify pasture ownership, recent clearing, timber harvest, or an abandoned field.
UGA Extension’s Laurens County office provides agricultural and natural-resource services including soil, water, forage, and production support. A recent county impact report also lists timber, cotton, and pine straw among leading commodities. Those sources help explain why forest and working agricultural land are important locally, but the map cannot locate a specific cotton field, timber tract, or pine-straw operation.
The 1985–2025 difference map is more complex than an urban-growth story
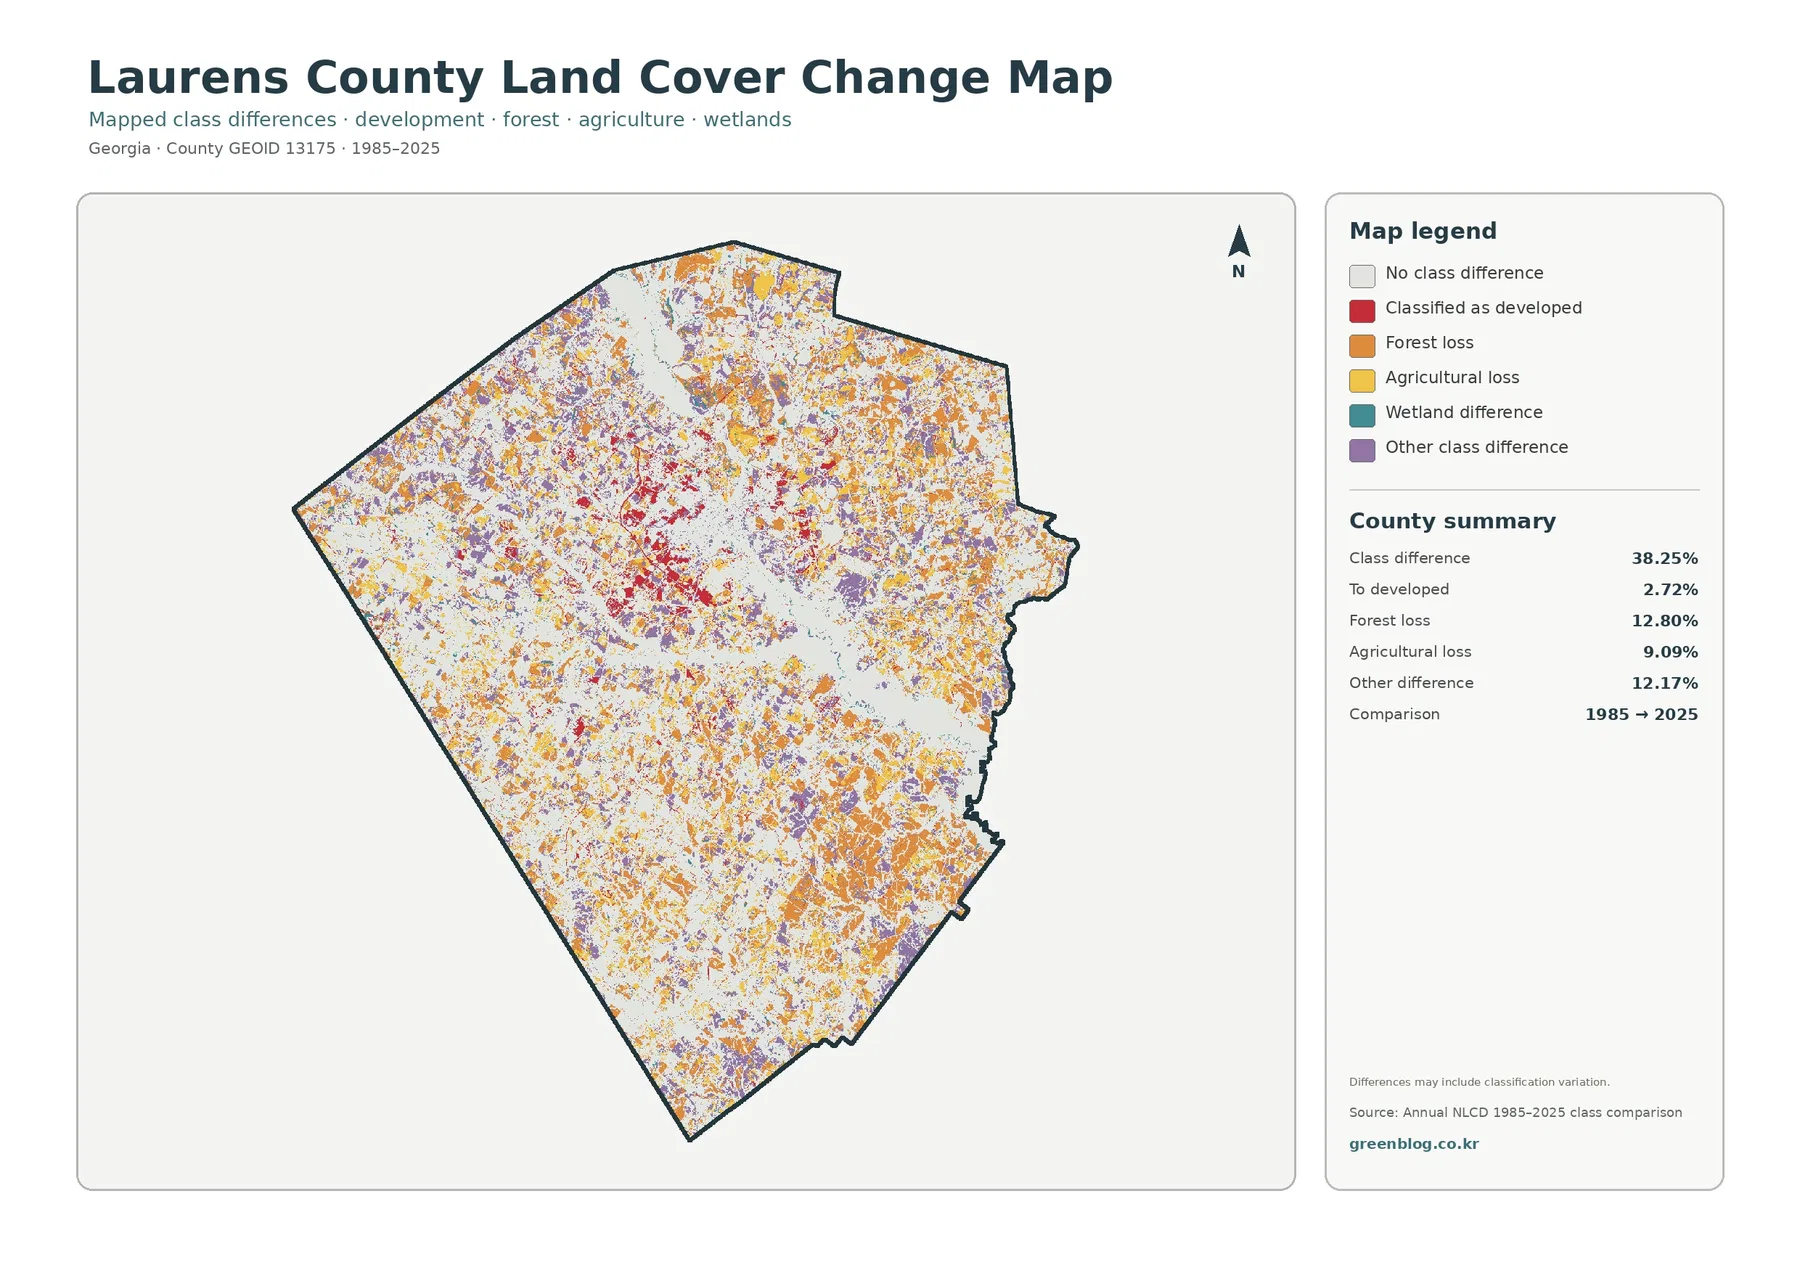
The total class difference between the 1985 and 2025 endpoints is 38.25%. This figure is the share of cells that received different classifications in the two endpoint years. It is not the percentage of Laurens County that was damaged, cleared, or urbanized. The map warns that classification variation may be included, which matters because imagery date, seasonal conditions, mixed pixels, and classification decisions can affect an endpoint comparison.
The printed summary lists 2.72% classified to developed, 12.80% forest loss, 9.09% agricultural loss, and 12.17% other difference. Red developed-change cells are most noticeable around the central built area. Orange forest-loss, yellow agricultural-loss, and purple other-difference cells are spread much more widely, including large sections of the north, east, and south. The visual result does not support describing the entire 38.25% as development.
Wetland difference appears in the legend, but the summary does not print a separate percentage for it. The missing figure should not be reconstructed by subtraction and presented as an official rate. Likewise, “forest loss” simply means that a cell classified as forest at the earlier endpoint received another class in 2025. Harvest, construction, agriculture, storms, vegetation recovery, or classification variation require additional evidence.
A useful sequence for profiles, lessons, and presentations
Annual NLCD is raster based at 30-meter resolution. Each square cell receives one predominant class even when trees, grass, water, pavement, and structures share the same space. Narrow streams, small ponds, thin forest strips, and scattered buildings can therefore appear broader, narrower, or less continuous than they are on the ground. This scale works well for county patterns, not for surveys or parcel decisions.
What the four-map JPG download contains
Each original JPG measures 2480 × 1754 pixels. The set is practical for screens, reports, classroom material, presentation graphics, and many ordinary print layouts. The package does not identify the files as meeting an A3 high-resolution reference, so a proof is advisable before producing a large poster. Keep the original proportions when resizing.
Frequently Asked Questions
Which land-cover class is largest in Laurens County?
Forest is the largest class in the supplied 2025 summary at 30.81%. Wetlands follow at 21.71% and agriculture at 19.25%, so the county has a mixed surface pattern rather than one overwhelmingly dominant class.
Why is developed land 9.98% while mean impervious cover is only 2.17%?
Developed land can include lawns, trees, yards, bare soil, and other permeable surfaces around buildings and roads. Fractional impervious cover isolates rooftops, pavement, parking areas, and similar hard surfaces, so its countywide average is much lower.
Does the 38.25% class difference mean that much of the county was damaged?
No. It is the share of cells assigned different classes in the 1985 and 2025 endpoints. The summary separately lists 2.72% classified to developed, 12.80% forest loss, 9.09% agricultural loss, and 12.17% other difference. Cause and timing require additional evidence.
Sources and Reference Data
- MRLC Annual NLCD Data – official access to annual land-cover and comparison products
- USGS Annual NLCD Land Cover Classification – definitions for forest, agriculture, wetlands, developed land, and related classes
- U.S. Census Bureau TIGER/Line Shapefiles – authoritative geographic layers for county boundaries, places, and transportation comparison
- Laurens County Government – History – official local history covering Dublin’s county-seat designation and its Oconee River location
- UGA Extension – Laurens County Agriculture & Natural Resources – local agricultural, soil, water, forage, and production services
- UGA Extension – Laurens County Impact Report – recent county agricultural value and leading-commodity context
Map File Information
The ZIP contains four original JPG maps for comparing Laurens County's forest, wetlands, agriculture, Dublin-area development, impervious surfaces, and 1985–2025 class differences.
- Included Files: Use only the versions confirmed in the article and supplied images
- File Type: Use the confirmed download contents
- Intended Use: Printing, education, presentations, and map-based projects
Related Maps
- Appling County Georgia Land Cover Map
- Atkinson County Georgia Land Cover Map
- Bacon County Georgia Land Cover Map
Green Map creates custom-edited map images using open geographic data sources such as geoBoundaries, Natural Earth, OpenStreetMap, and government open data.
These maps are edited visual materials, not raw data files, and are provided for education, documents, presentations, and graphic reference.