Jasper County, Georgia is strongly forested in the 2025 land-cover summary. Forest accounts for 66.72% of the county, while agriculture covers 14.31%, developed land 6.16%, wetlands 4.10%, and smaller shares are assigned to grassland, shrubland, and water. The four maps on this page let you compare that countywide mix with the places where farms, built surfaces, water, and long-term class differences are concentrated.
All four map views can be examined on the page, and the original JPG versions are packaged together in one ZIP. The set includes a general land-cover map, a forest-and-farmland view, an impervious-surface map, and a 1985–2025 change map. That makes it possible to start with the broad landscape and then switch to a more focused layer without trying to force one map to answer every question.
Table of Contents
A county where forest remains the dominant surface
The most important fact in the 2025 summary is the scale of forest cover. At 66.72%, it occupies roughly two thirds of Jasper County. The dark green areas are not confined to a single corner; broad wooded blocks appear through the north, east, south, and much of the western interior. Agriculture is the next major category at 14.31%, but it is divided into many smaller areas rather than forming one continuous farming belt. Developed cover, at 6.16%, is much more localized.
The specialized forest-and-farmland legend adds more detail to the remaining landscape. Wetlands account for 4.10%, grassland for 3.84%, shrubland for 3.55%, and water for 1.28%. These smaller classes matter because they break up the large forested areas and help explain why the county does not look uniform even with such a high forest percentage. Pasture-like areas, cropland, wet corridors, and small water bodies appear repeatedly between the larger wooded blocks.
County visitor material describes Jasper County as a landscape of rolling hills, pine forests, pasture, hay fields, farms, ponds, streams, a river, and a lake. It also identifies places such as Jackson Lake, the Ocmulgee River, Oconee National Forest, and Piedmont National Wildlife Refuge. Those names are useful local context, but the land-cover maps do not draw protected-area boundaries or label every water body. The colors should therefore be read as surface classifications, not as a substitute for a recreation, ownership, or management map.
The general map shows where the smaller classes interrupt the forest
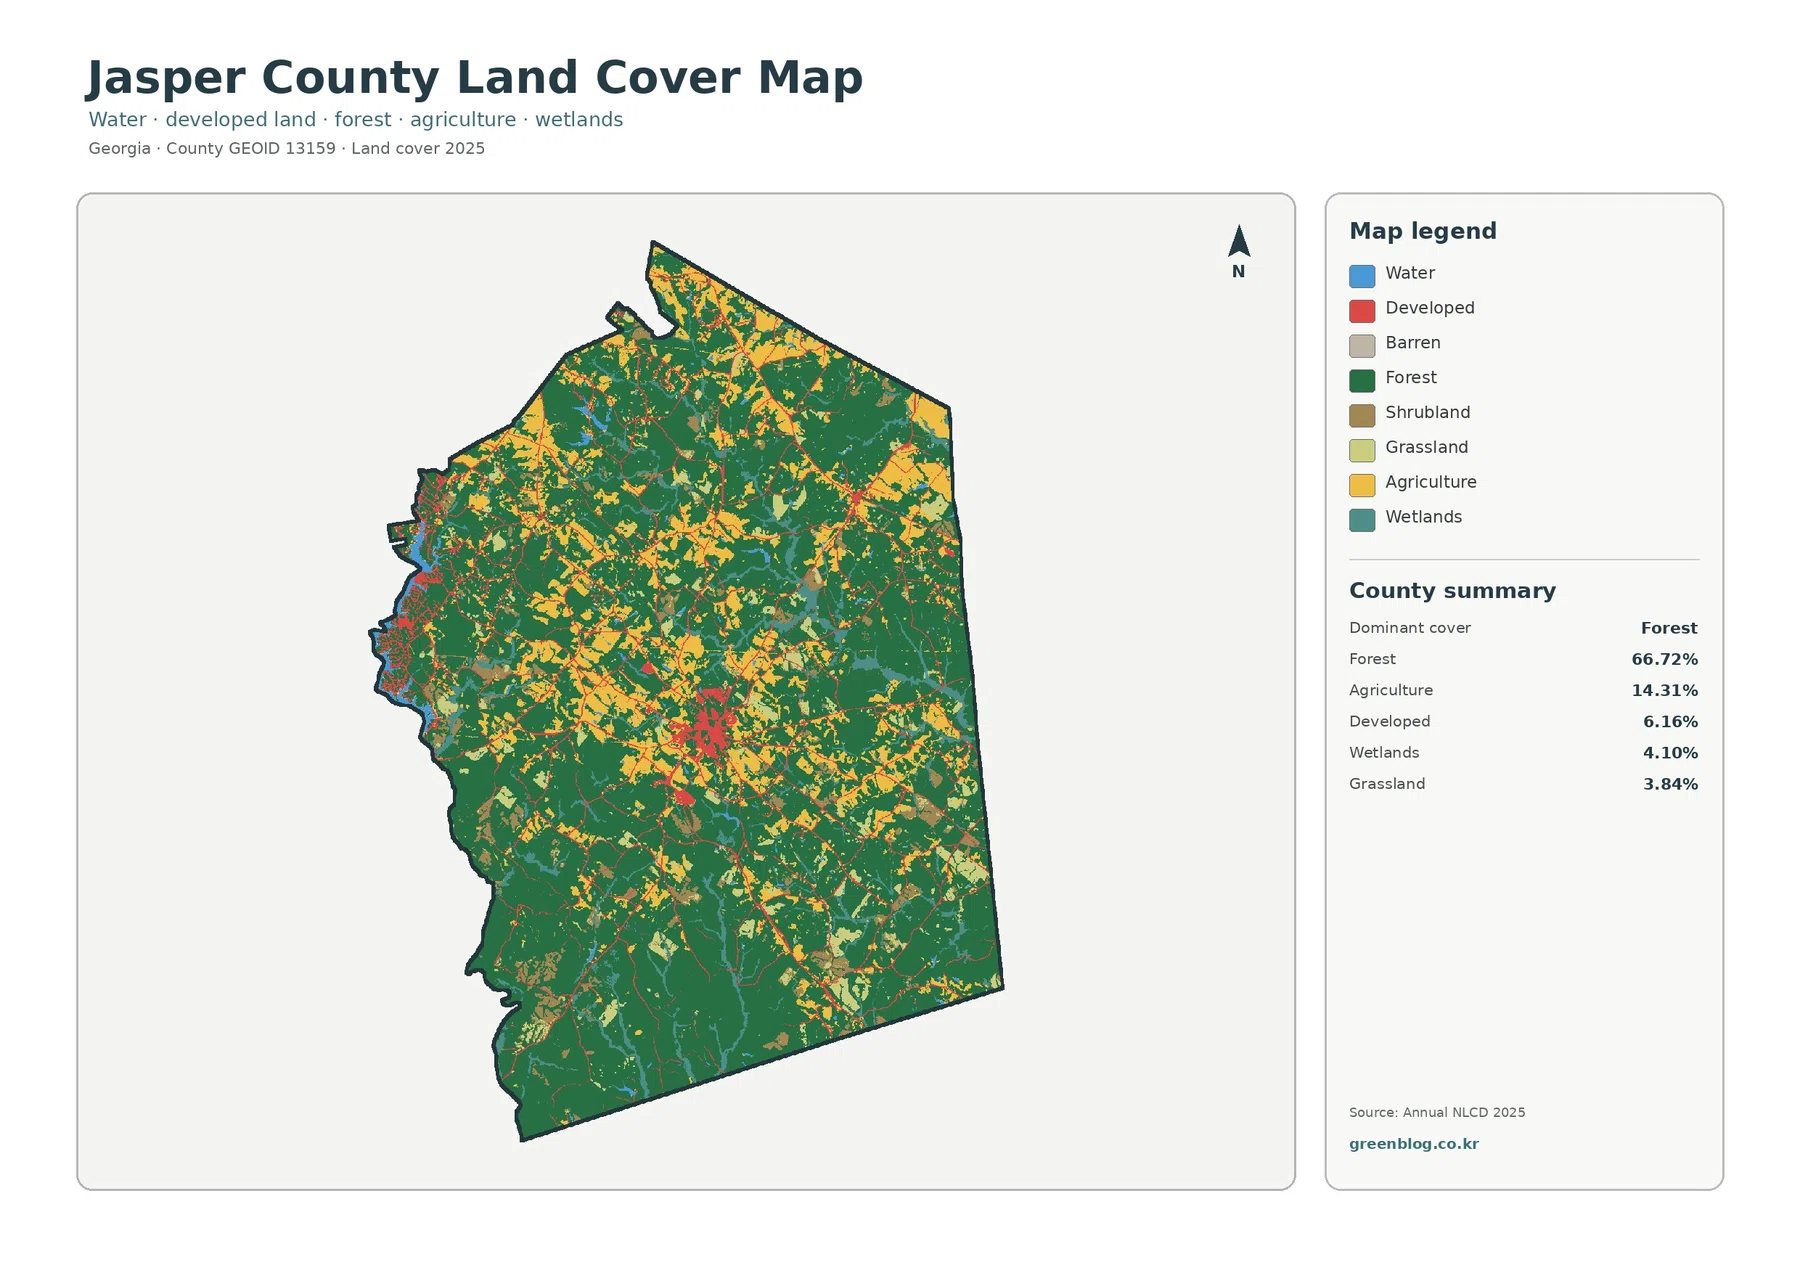
The general map is the best place to see how the county fits together. Forest forms large dark-green blocks across most of the outline, especially through the southern and eastern portions. Agriculture appears as yellow patches scattered through the interior and north, with additional fields along parts of the eastern and western sides. Grassland and shrubland are less dominant but add lighter green and brown areas that make the boundary between forest and open land more complex than the headline percentages suggest.
Developed land is easiest to notice around the compact cluster near the middle of the county. Thin red lines and smaller red patches extend outward from that center and also appear along the western edge. Jasper County’s joint comprehensive plan covers the county together with Monticello and Shady Dale, giving a useful official reference for the local settlement pattern. The land-cover layer itself, however, does not define municipal boundaries or zoning districts, so the red cells should be interpreted only as developed surface classes.
Water is limited in area but visually distinctive. Blue cells occur along the western side and in several smaller interior locations, while teal wetland areas often form narrow shapes within or beside forest. County information lists Jackson Lake and the Ocmulgee River among important local water features, but the preview does not label the individual blue areas. It is safer to use the map to compare water, wetland, forest, and developed cover around the county edge than to assign a name to every mapped cell.
Forest and farmland become easier to separate in the second view
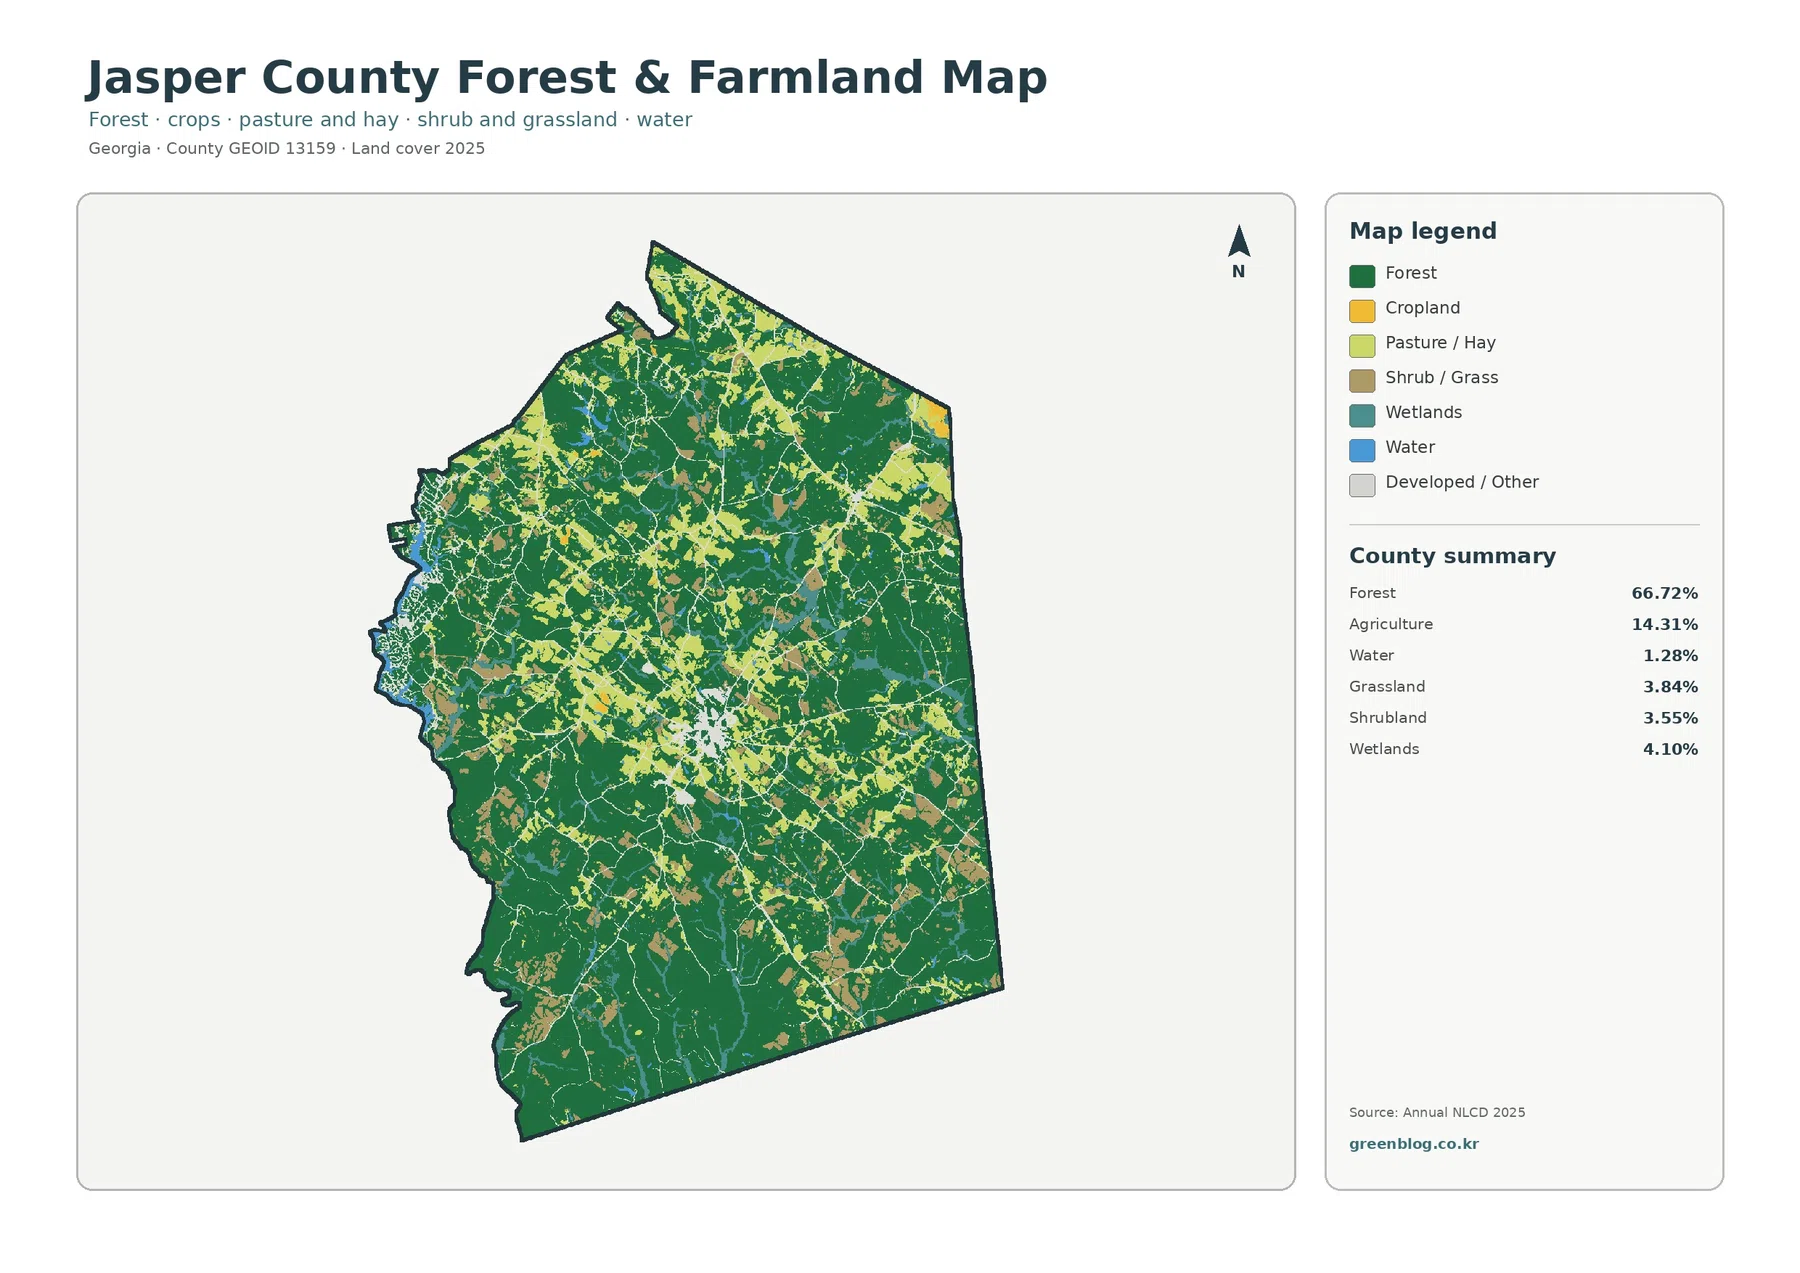
Removing most of the developed-color emphasis changes the way the landscape reads. The forest-and-farmland map makes the large southern woodland especially clear, while broad forest blocks continue through the east and north. Cropland appears in yellow, and pasture or hay is shown in a lighter green. Those agricultural classes are most useful when viewed as many separate pieces set among forest rather than as one large agricultural zone.
This distinction also prevents a common mistake. Agriculture at 14.31% is an aggregated summary, but the map separates cropland from pasture and hay. Grassland and shrubland have their own classes as well. A pale green patch is therefore not automatically a farm field, and a brownish area is not necessarily barren ground. Reading the legend before comparing locations is essential when several open-land classes sit next to each other.
The county’s published local description of pine forest, pasture, hay fields, farms, ponds, and streams matches the broad mix visible in this map. That agreement is useful as context, but the image cannot tell you which crop is grown on a particular field or whether a specific open parcel is actively grazed. Annual NLCD is designed for consistent land-cover classification across large areas, not for current farm inventories or parcel-level land-use records.
A 0.91% mean impervious value keeps the hard-surface footprint compact
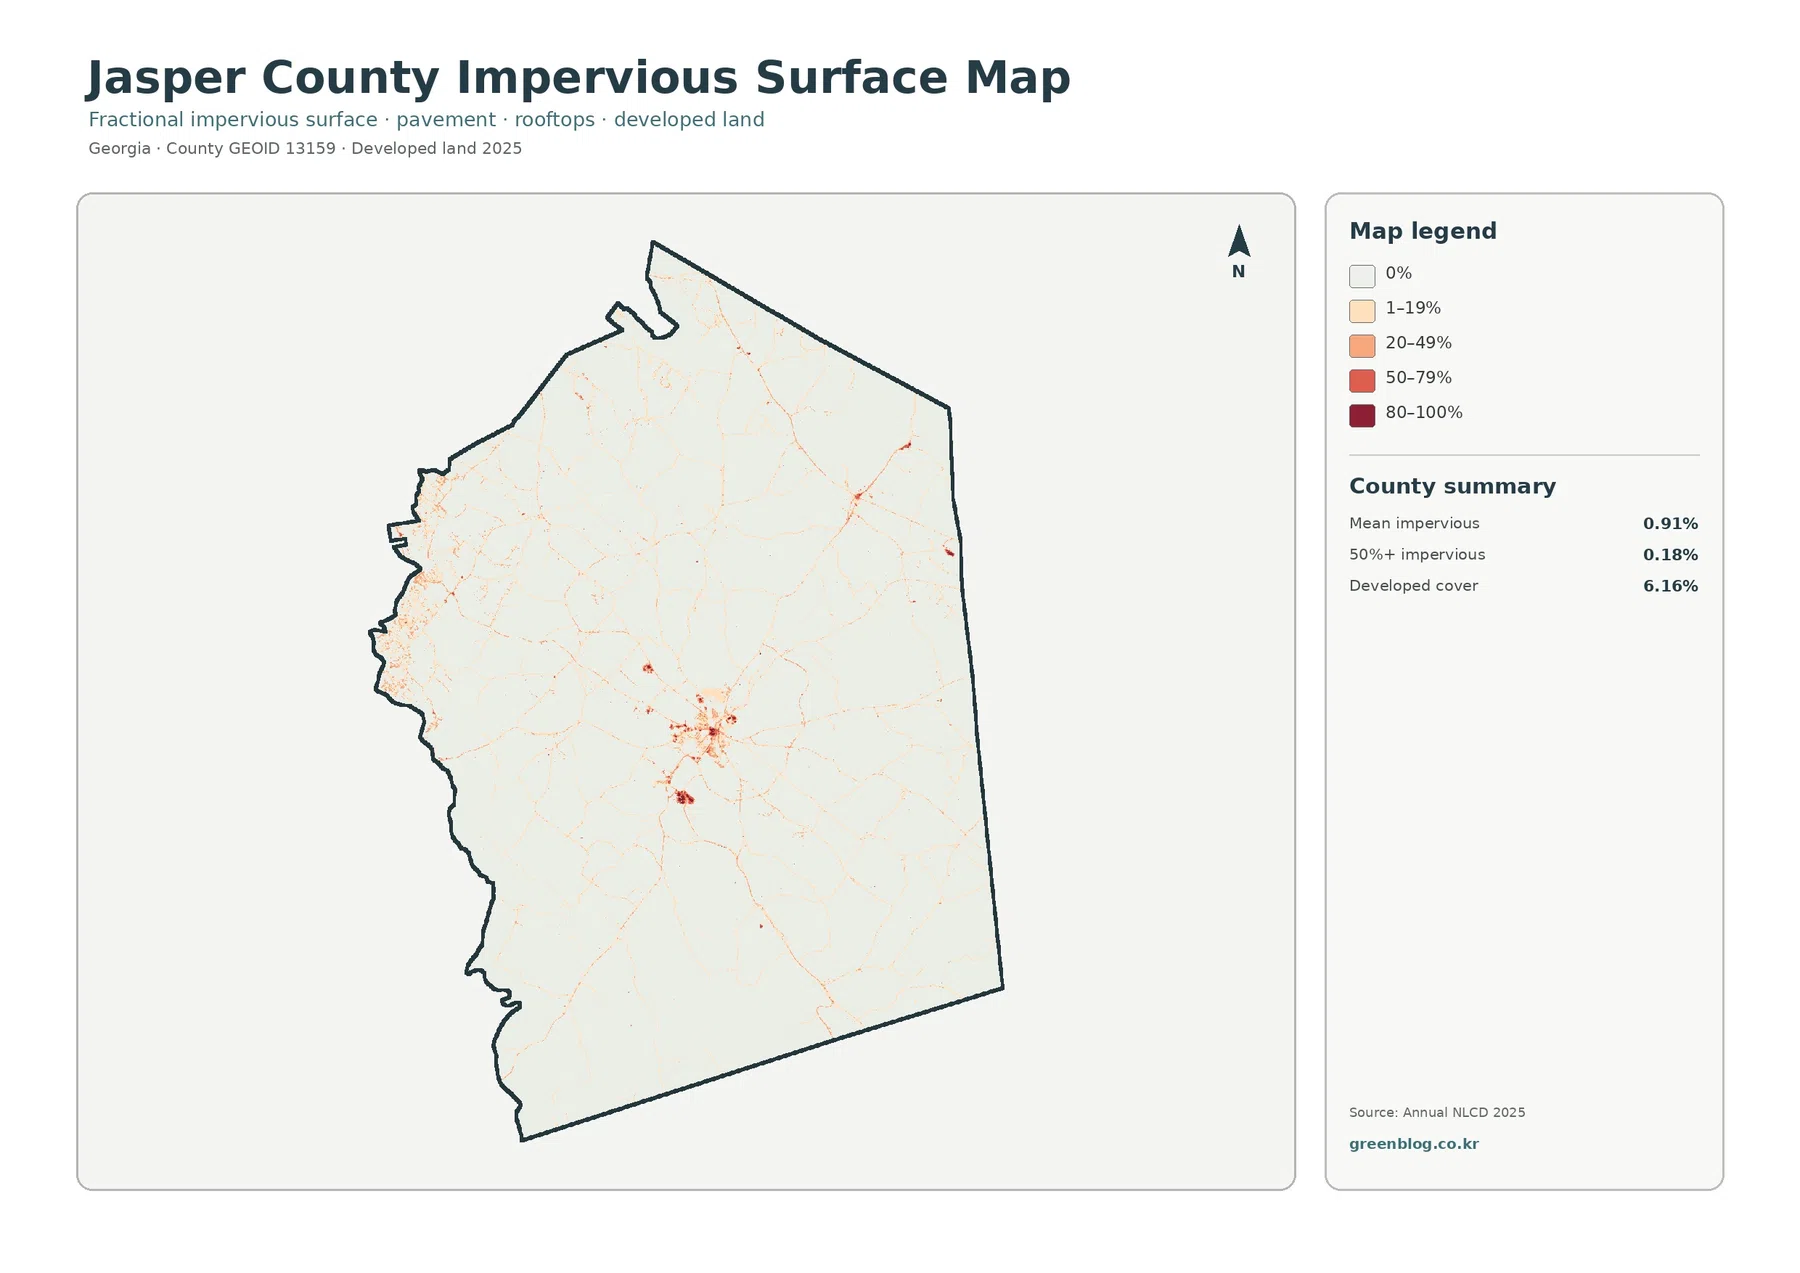
Impervious surface refers to hard materials such as pavement and rooftops that do not readily absorb rainfall. Jasper County has a mean impervious value of 0.91%, and only 0.18% of the mapped area falls in cells that are at least 50% impervious. Those numbers are not supposed to match the 6.16% developed-cover share. A developed land-cover cell can still contain lawns, trees, exposed soil, and other permeable surfaces.
The map makes that low countywide intensity visible. Most of the county is almost white, while the strongest oranges and reds form a compact concentration near the center. Narrow lines extend from that cluster along transportation routes, and another noticeable group of small hard-surface cells appears near the western side. Eastern and southern areas contain far fewer high-intensity cells, even though small roads and scattered development are still present.
For presentations or classroom work, this layer is often more useful than the general land-cover map when the topic is built intensity. The general layer answers where land is classified as developed; the impervious layer answers where pavement and rooftops occupy a larger share of each cell. It can support a broad discussion of runoff or development patterns, but it is not a stormwater model and should not be used to determine site drainage, flood risk, or engineering requirements.
The 1985–2025 map records class differences, not a complete land history
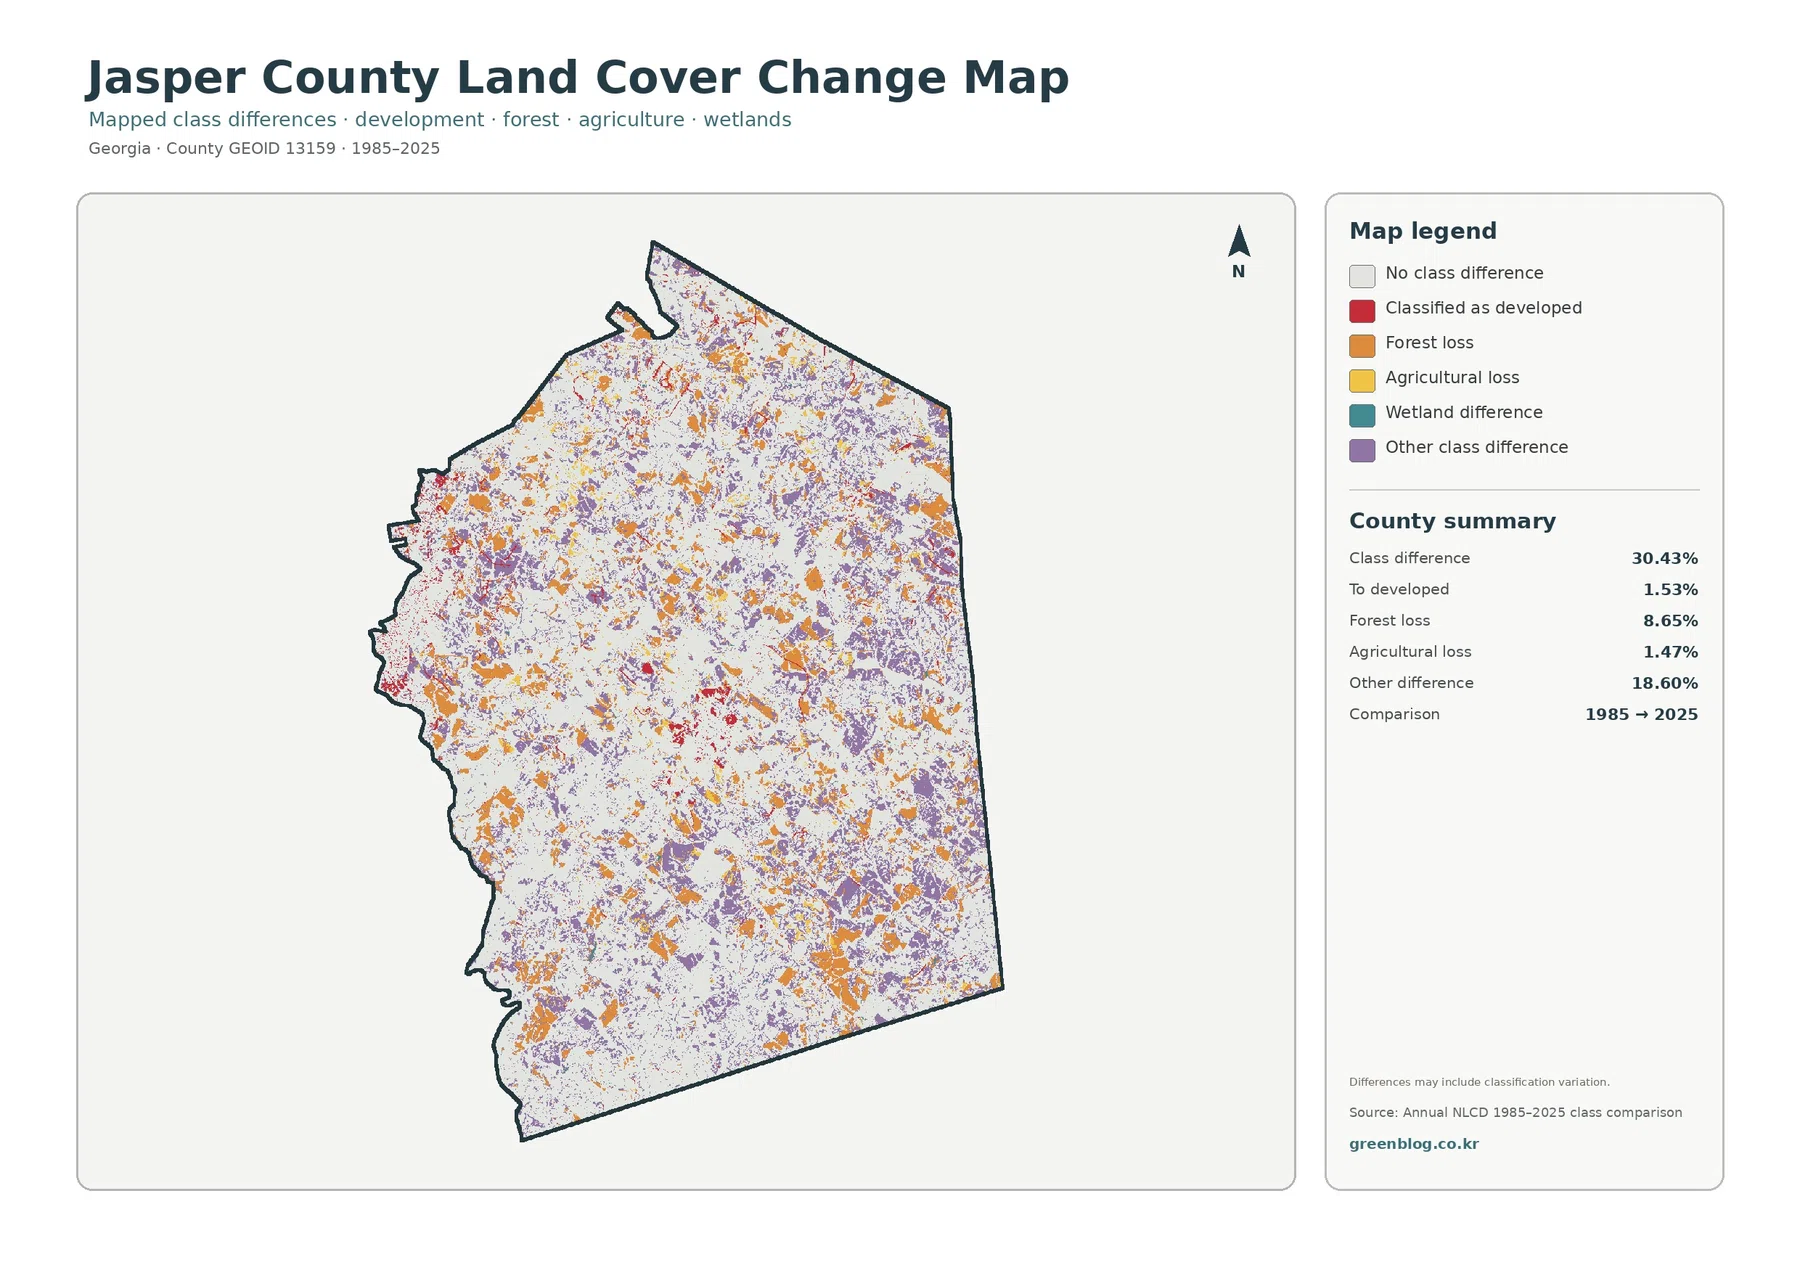
The change map compares Annual NLCD classifications for 1985 and 2025. Its county summary reports class differences across 30.43% of Jasper County. Within the listed categories, 1.53% is mapped as a change to developed, 8.65% as forest loss, 1.47% as agricultural loss, and 18.60% as other class difference. Wetland difference is also included in the legend. These values compare two classification endpoints and should not be read as a complete record of everything that happened during the forty-year period.
Orange forest-loss patches are dispersed across the county rather than confined to one small growth area. Red cells classified as a change to developed are less extensive and are easier to notice around the central built cluster and parts of the western side. Purple other-class differences are widespread and make up the largest listed change category. That broad purple pattern is one reason the map should not be summarized simply as a development or deforestation map.
Some apparent change can come from differences in classification as well as physical change on the ground. The map itself notes that class differences may include classification variation. A field can move among agricultural, grass, shrub, or forest-related classes as vegetation and management change, and narrow edge cells can be sensitive to how the classification is assigned. A parcel history therefore requires additional annual imagery, local records, and field evidence rather than a single two-date comparison.
Water and wetlands matter even though their area shares are small
Water covers 1.28% of the county and wetlands 4.10%, both far below the forest share. Their position is still useful. Blue water cells are most noticeable along the western side and in a few interior locations, while wetlands often follow narrow shapes through forest or around water. These thin features can disappear in a simple percentage table even though they help break the county into distinct natural corridors on the map.
Jasper County materials identify Jackson Lake, the Ocmulgee River, ponds, and streams as part of the local landscape, and they also highlight Oconee National Forest and Piedmont National Wildlife Refuge. Those references help explain why a forest-and-water comparison is relevant here. They do not mean that every forest cell is protected or that every wetland cell is regulated. NLCD wetlands are land-cover classifications, not legal wetland determinations.
How to compare the four maps without mixing their meanings
A practical sequence is to begin with the general land-cover map and identify the large forest blocks, scattered agricultural areas, central development, water, and wetlands. Next, use the forest-and-farmland map to separate cropland from pasture or hay and to see how open land is divided among the wooded areas. Then switch to the impervious layer to isolate the hardest built surfaces. Finish with the change map to compare today’s pattern with places where the 1985 and 2025 classifications differ.
This order works well when the maps are printed or placed in a presentation because each view adds a different question rather than repeating the same one. Keep each legend with its map. A dark red cell on the impervious map means a high hard-surface fraction, while red on the change map marks a class mapped as changing to developed. The same general color family can represent a different concept from one image to the next.
The ZIP contains the original JPG versions specified by the package rather than only the smaller web previews. All four images use the same Jasper County outline, making side-by-side comparison straightforward. Because the legends differ, keeping the full map and legend together is preferable when sharing the images. This is especially important for the percentage bins on the impervious map and the change categories on the 1985–2025 comparison.
Important limits before using the maps for a site-specific decision
Annual NLCD is a raster dataset. In simple terms, the landscape is divided into grid cells and each cell receives a class or value. Real ground surfaces are often more complicated than one label. A narrow road, forest edge, pond shoreline, or low-density residential area can contain several kinds of surface within the same cell. The mapped boundary is therefore generalized and is not equivalent to a surveyed parcel line.
The observation year is another limit. The 2025 maps describe the classification for that data year, so later construction, clearing, farming changes, or vegetation recovery may not appear. The 1985–2025 comparison looks at the two selected endpoints. A location could change several times between those years and still finish in a class similar to where it began. Anyone studying a detailed timeline should consult additional Annual NLCD years and other imagery.
Land cover must also be kept separate from zoning, ownership, and legal land use. A forest-colored cell does not automatically identify public or protected land. An agriculture-colored cell does not prove that a particular crop is being grown now, and developed cover does not distinguish residential, commercial, or industrial zoning. Property boundaries, permits, wetland jurisdiction, and development rights require current county and agency records.
Frequently Asked Questions
What is the largest land-cover class in Jasper County?
Forest is the largest 2025 class at 66.72%. Agriculture follows at 14.31%, developed land at 6.16%, and wetlands at 4.10%. The map supports that summary visually because large forest blocks occur across most parts of the county rather than being restricted to a single edge or protected area.
Which map best shows the compact built area near central Jasper County?
Use the impervious-surface map when the goal is to see where rooftops and pavement are most concentrated. Its strongest cells form a clear central cluster against a mostly light county background. Use the general land-cover map alongside it when you also need the surrounding forest and agricultural classes for context.
Does the 30.43% class-difference value mean exactly 30.43% of the land physically changed?
No. The value summarizes cells whose 1985 and 2025 classifications differ, and the map notes that classification variation may be included. The 8.65% forest-loss and 1.53% change-to-developed categories are useful for locating broad patterns, but they do not provide a parcel-level explanation of cause, timing, or every intermediate change.
Map File Information
The four original Jasper County land-cover maps are packaged together so the JPG files can be used outside the web page.
- Included Versions: land cover, forest and farmland, impervious/developed land, and land-cover change
- Printable Size: each JPG is 2480×1754 pixels
- File Type: one ZIP containing four JPG images
- Intended Use: printing, classroom material, county comparison, presentations, and personal reference
Related Maps
- Appling County Georgia Land Cover Map
- Atkinson County Georgia Land Cover Map
- Bacon County Georgia Land Cover Map
Sources and references
- MRLC Annual NLCD Data – official access to Annual NLCD land-cover data and related products
- USGS Annual NLCD Land Cover Classification – official class definitions and interpretation guidance for Annual NLCD
- Georgia DCA – Jasper County Joint Comprehensive Plan – official planning documents for Jasper County, Monticello, and Shady Dale
- Jasper County – Things to See & Do – county material describing local forests, farms, water features, and outdoor areas
- U.S. Census Bureau TIGER/Line Shapefiles – official geographic boundary data for U.S. counties
Green Map creates custom-edited map images using open geographic data sources such as geoBoundaries, Natural Earth, OpenStreetMap, and government open data.
These maps are edited visual materials, not raw data files, and are provided for education, documents, presentations, and graphic reference.