Minnesota’s statewide average does not look much like the state’s actual settlement pattern. The 2024 ACS 5-year estimate places the population at 5,739,445, and the county-density map lists about 79,632 square miles of land with an average density near 72 people per square mile. On the map, however, the Twin Cities region forms a compact, dark concentration while large parts of northern and northwestern Minnesota remain in the lowest density classes.
The most useful comparison is not one ranking but three different questions. Hennepin County has the largest current population, Ramsey County has the highest county-average density, and Carver County recorded the fastest percentage growth from 2010 to 2020. Those measures describe size, crowding, and change respectively. The five supplied maps move from census-tract density to major places, county totals, county density, and decennial change so that those ideas stay separate.
Table of Contents
Census tracts turn the Twin Cities into a broad high-density footprint
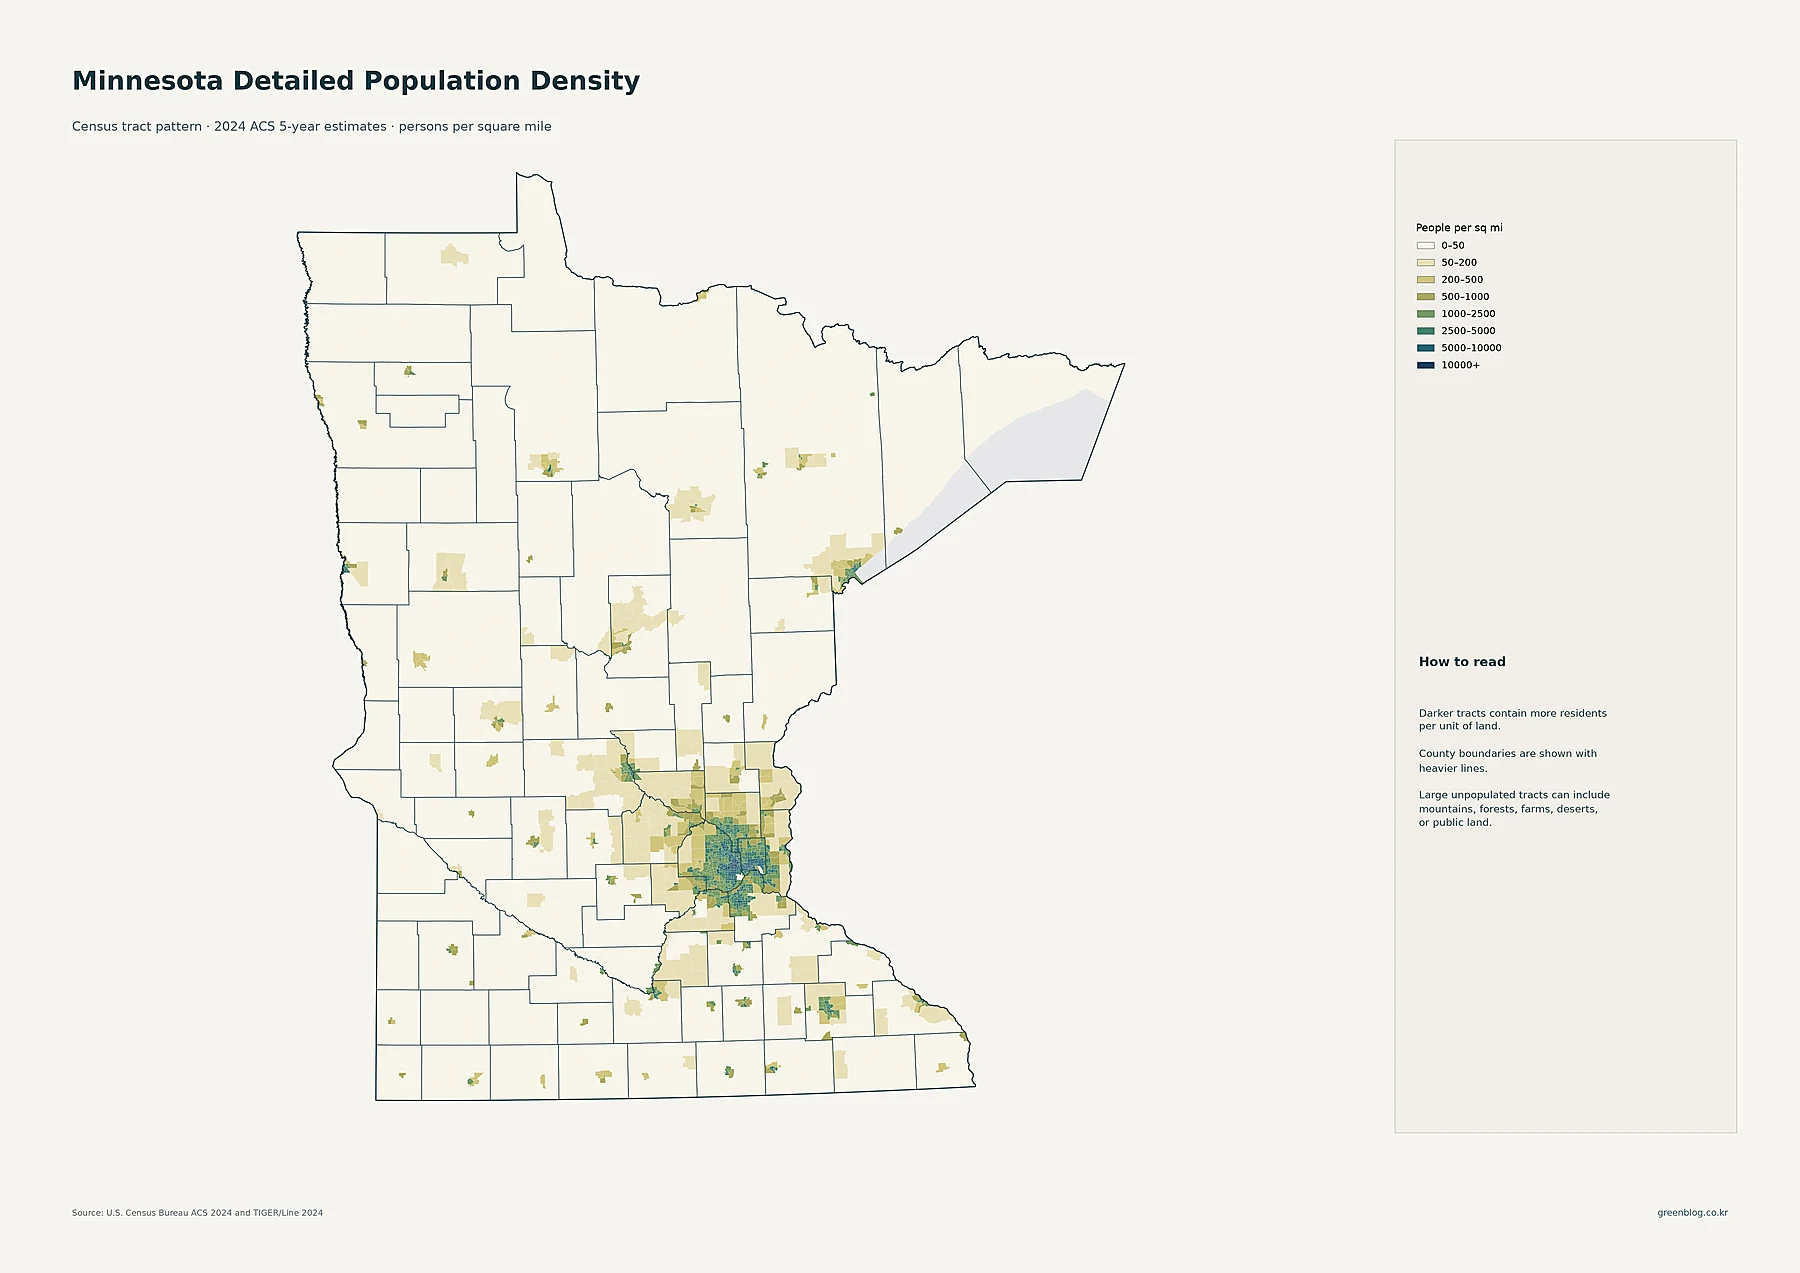
The darkest and most continuous tract pattern surrounds Minneapolis and St. Paul. Dense tracts spread beyond the two central cities into suburban parts of Hennepin, Ramsey, Anoka, Dakota, Washington, Scott, and Carver counties. The result is a metropolitan footprint rather than two isolated urban dots. The map also makes an important point about averages: a county can include both very dense urban tracts and much lighter outer tracts, so a single countywide density number can hide substantial internal variation.
Outside the Twin Cities, Rochester is the clearest concentration in southeastern Minnesota. St. Cloud forms another cluster in the center of the state, and Duluth stands out near Lake Superior. Smaller localized concentrations appear around other regional centers, including the Moorhead area on the western border. Much of northern Minnesota remains pale, with only small settlement clusters interrupting large low-density areas. The tract map is therefore the best view for seeing where people occupy land at a neighborhood-scale geography.
Place populations show a multi-city Twin Cities region plus several independent regional centers
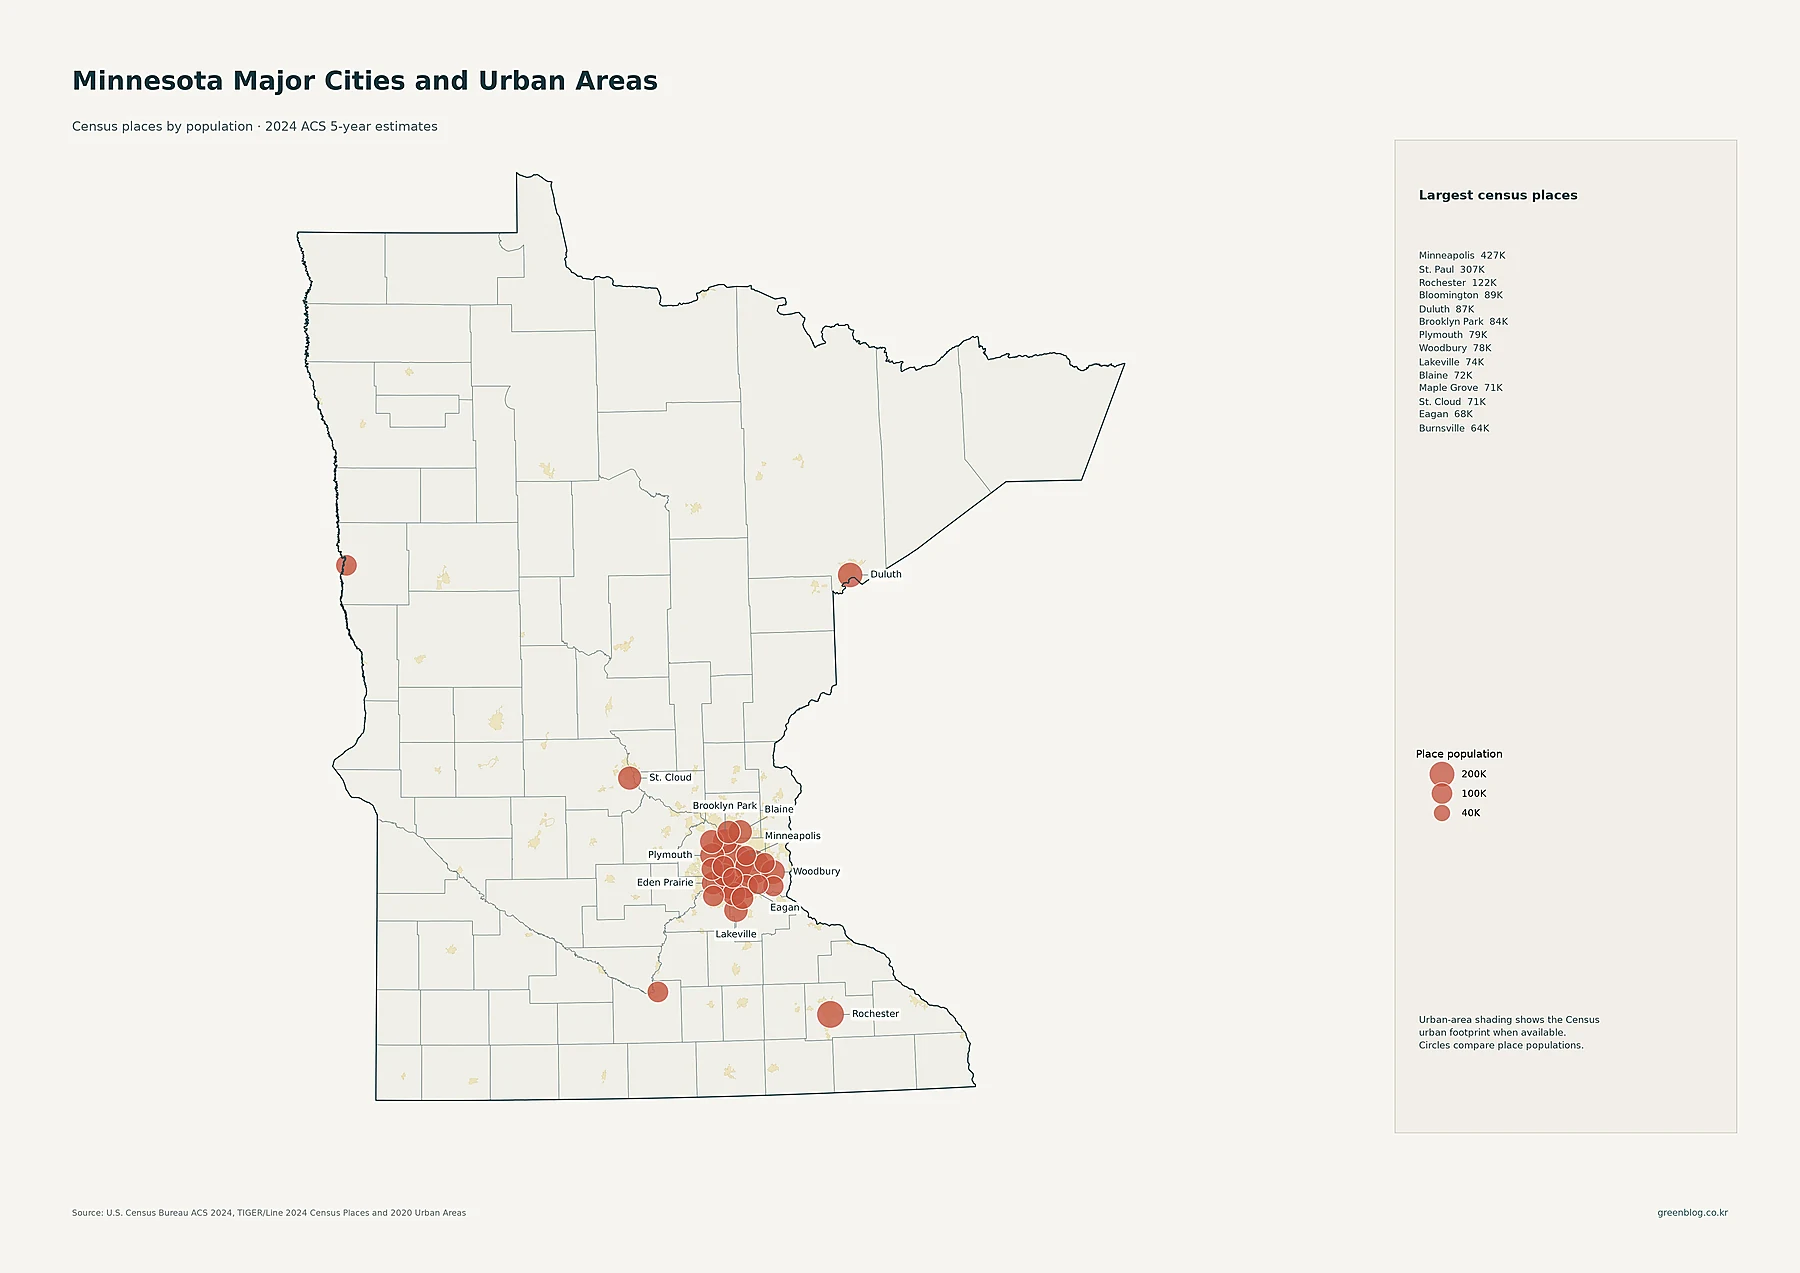
Minneapolis is the largest census place at 427,246 residents, followed by St. Paul at 307,284. Rochester has 122,330 residents, Bloomington 88,665, and Duluth 87,093. Brooklyn Park has 83,876, Plymouth 79,220, Woodbury 78,305, Lakeville 74,354, Blaine 72,488, Maple Grove 71,173, and St. Cloud 70,629. These are place totals, so the circle sizes compare how many residents live in each place rather than how tightly those residents occupy land.
The spatial arrangement of the circles explains the broad tract-density cluster. Minneapolis and St. Paul are surrounded by substantial places such as Bloomington, Brooklyn Park, Plymouth, Woodbury, Lakeville, Blaine, Maple Grove, Eagan, and Burnsville. That creates a metropolitan system with multiple large municipalities packed close together. Rochester, Duluth, and St. Cloud are different: each appears as a more distinct regional center with fewer similarly large places immediately around it.
Hennepin leads county population, with four more large Twin Cities counties close by
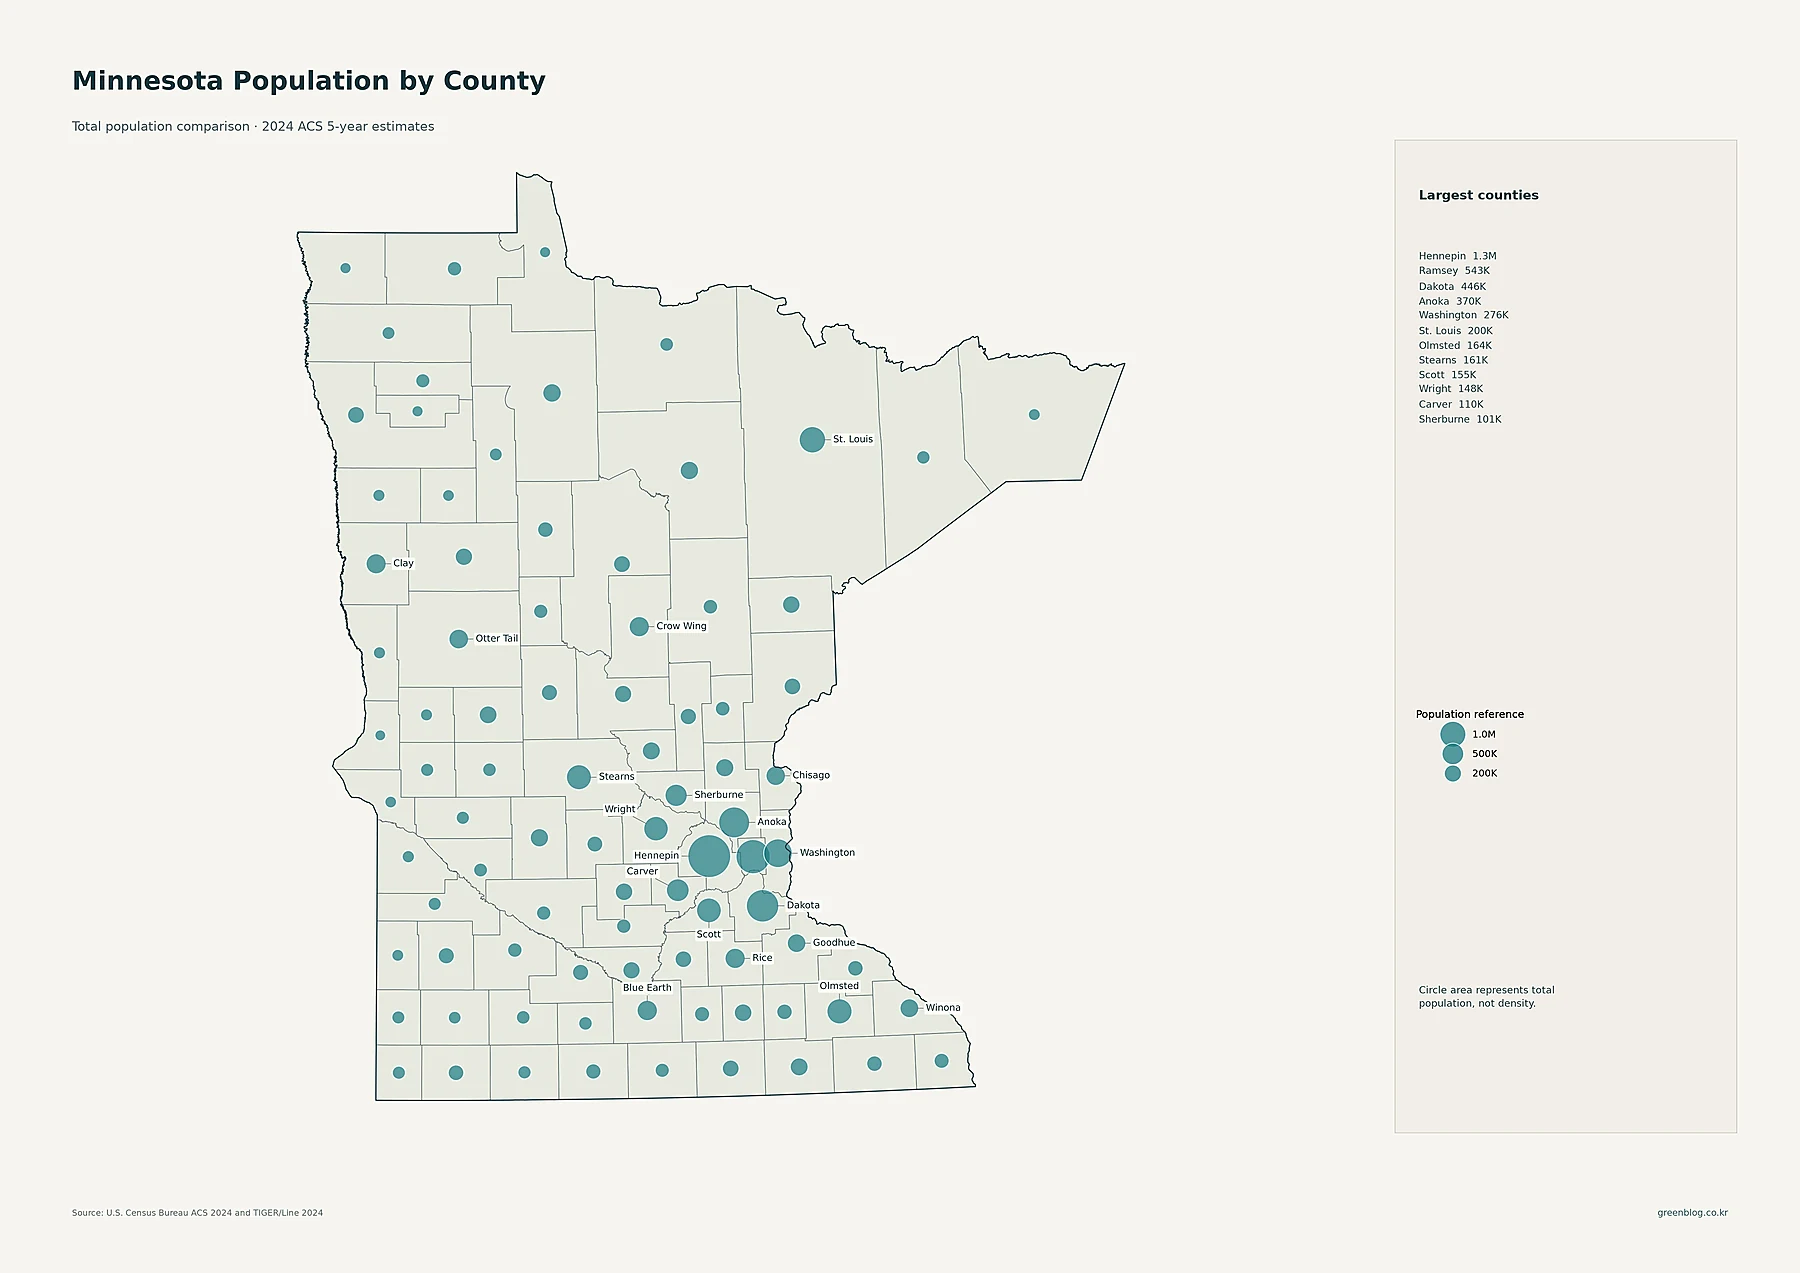
Hennepin County has 1,269,496 residents, by far the largest county total in Minnesota. Ramsey County follows with 542,945, Dakota with 445,771, Anoka with 370,349, and Washington with 276,238. All five belong to the Twin Cities region, so the largest proportional circles are tightly grouped in the east-central part of the state. St. Louis County has 200,123 residents, Olmsted 164,498, Stearns 160,865, Scott 154,557, Wright 148,269, Carver 110,041, and Sherburne 100,560.
St. Louis County illustrates why total population must be separated from density. Its population is large enough to rank sixth, yet its very large land area produces an average density of only about 32 people per square mile. Ramsey County shows the opposite effect: it has fewer residents than Hennepin but a much smaller land area, giving it the state’s highest county density. Proportional circles answer “how many people,” while the shaded density map answers “how many people per unit of land.”
Ramsey, not Hennepin, has Minnesota’s highest county-average density
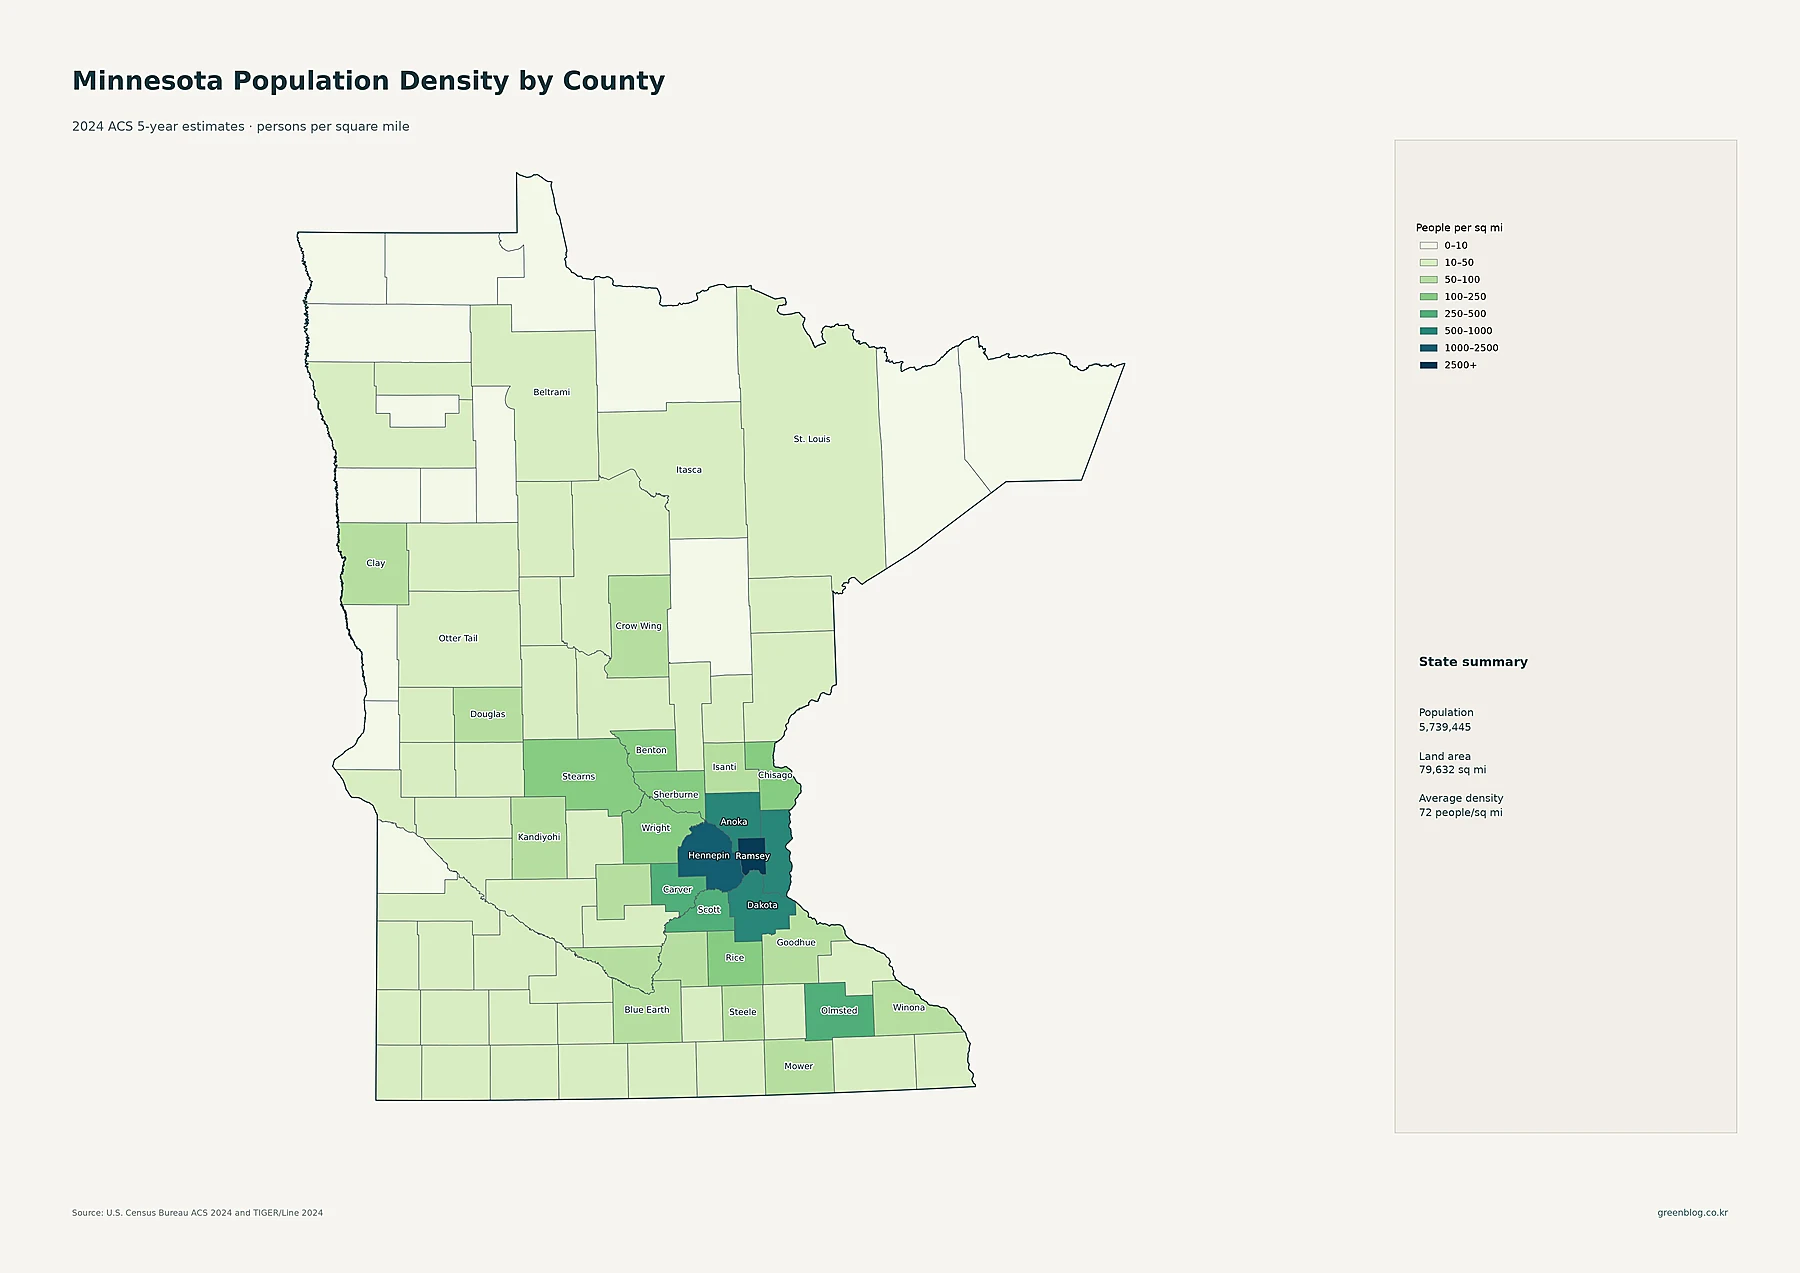
Ramsey County averages about 3,566 people per square mile, the highest county value in the state. Hennepin County is next at about 2,291. Anoka averages roughly 878, Dakota 792, Washington 718, Scott 434, and Carver 311. Olmsted County, home to Rochester, averages about 252. The darkest county classes therefore form a compact Twin Cities cluster that closely matches the broad concentration visible on the tract map, while Rochester appears as a secondary high-density county outside the metro.
The low-density end is concentrated in the north and northwest. Lake of the Woods County averages about 2.9 people per square mile, Kittson about 3.7, and Koochiching about 3.8. St. Louis County, despite its comparatively large population total, averages about 32. These extremes show why the statewide average of 72 is only a summary statistic. It describes neither the dense Twin Cities core nor the sparsest northern counties particularly well.
| Measure | Standout area | Value in the supplied data |
|---|---|---|
| State population | Minnesota | 5,739,445 |
| Largest county population | Hennepin County | 1,269,496 |
| Highest county density | Ramsey County | about 3,566/sq mi |
| Fastest 2010–2020 growth | Carver County | +17.4% |
| Largest 2010–2020 decline | Koochiching County | -9.4% |
The 2010–2020 map highlights faster growth around the Twin Cities fringe
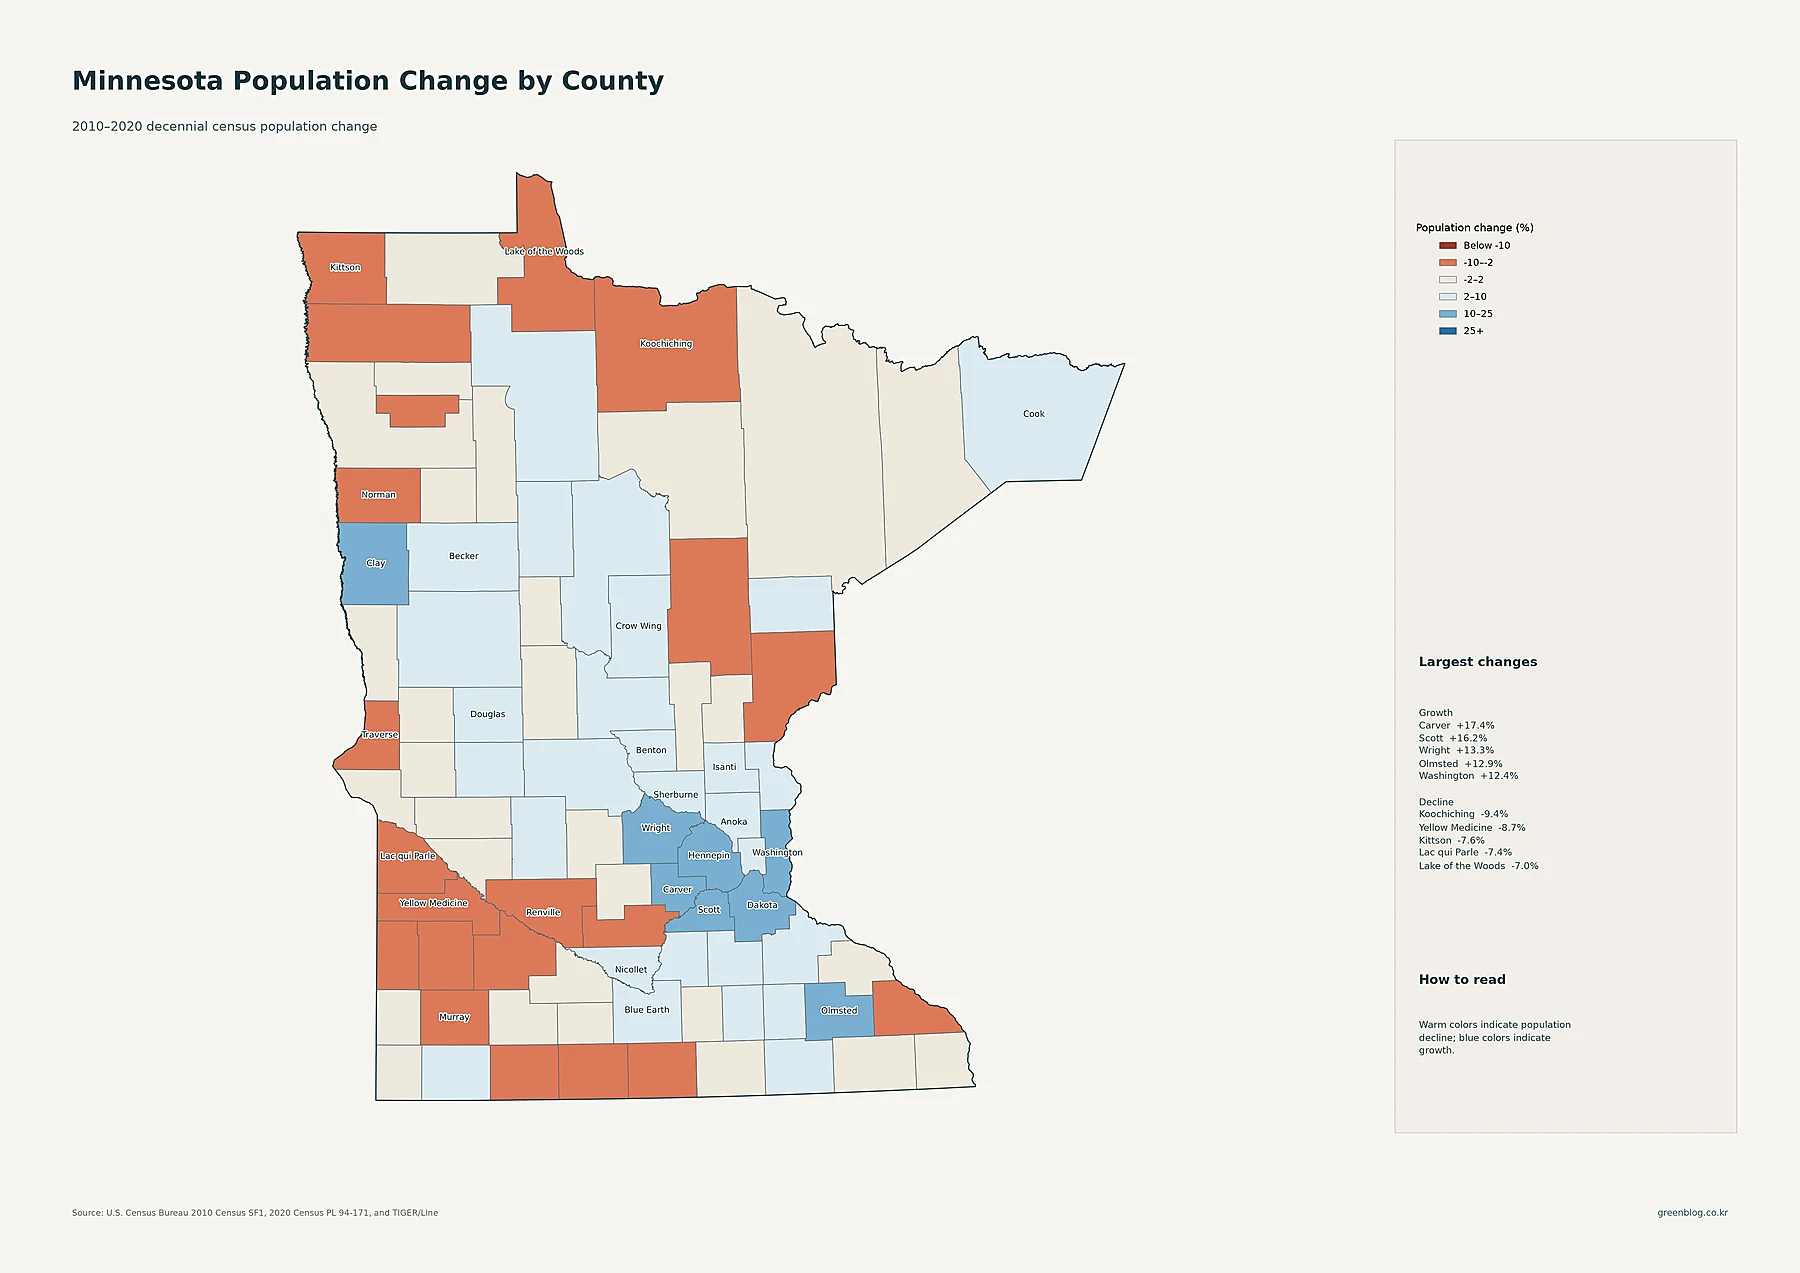
Carver County grew from 91,042 residents in 2010 to 106,922 in 2020, an increase of about 17.4%. Scott County increased 16.2%, Wright 13.3%, Olmsted 12.9%, and Washington 12.4%. Hennepin grew 11.2%, Clay 10.7%, Dakota 10.4%, Anoka 10.0%, and Sherburne 9.8%. The map shifts attention from the densest central counties toward several outer metropolitan counties and toward Olmsted County in the Rochester area.
Koochiching County had the largest decline, falling from 13,311 residents in 2010 to 12,062 in 2020, or about -9.4%. Yellow Medicine declined 8.7%, Kittson 7.6%, Lac qui Parle 7.4%, and Lake of the Woods 7.0%. The warm colors are scattered across parts of the northern border and western Minnesota rather than forming a single continuous region. The map shows the direction and magnitude of population change; it does not establish why a county grew or declined, which would require separate migration, housing, economic, and vital-statistics evidence.
Three different rankings explain Minnesota better than one statewide average
The map set becomes much clearer when size, density, and change are treated as separate dimensions. Hennepin is the largest county by current population, Ramsey is the densest, and Carver grew the fastest between the two decennial censuses. At the place level, Minneapolis and St. Paul anchor a cluster of several large municipalities, while Rochester, Duluth, and St. Cloud form distinct regional centers. At the tract level, the Twin Cities concentration expands beyond municipal boundaries and reveals where population is actually packed most tightly.
That combination produces Minnesota’s strongest geographic contrast. The Twin Cities metro contains the state’s largest county totals, highest county densities, and broadest continuous high-density tract pattern. Several outer metro counties also posted some of the fastest 2010–2020 growth. Northern Minnesota, meanwhile, contains vast low-density counties and several of the largest percentage declines. Reading the maps in sequence avoids the common mistake of treating a large population circle, a dark density shade, and a strong growth color as if they represented the same thing.
Download the Minnesota population map collection
The ZIP collection includes detailed census-tract density, major cities and urban areas, county population totals, 2010–2020 population change, and county population density.
FAQ
Which Minnesota county has the largest population?
Hennepin County is largest in the supplied 2024 ACS data with 1,269,496 residents. Ramsey County is second at 542,945, followed by Dakota County at 445,771.
Is Hennepin County also the densest county in Minnesota?
No. Ramsey County has the highest county-average density at about 3,566 people per square mile, compared with about 2,291 in Hennepin County. Total population and population density measure different things.
Which Minnesota county grew fastest from 2010 to 2020?
Carver County had the largest percentage increase at about 17.4%, followed by Scott County at 16.2% and Wright County at 13.3%. These figures compare the 2010 and 2020 decennial censuses.
Related Maps
Sources
- U.S. Census Bureau — American Community Survey (ACS): 2024 5-year population and density estimates
- U.S. Census Bureau — TIGER/Line Shapefiles: 2024 state, county, census tract, and place geography
- U.S. Census Bureau — Decennial Census: 2010 and 2020 county population comparison
Green Map creates custom-edited map images using open geographic data sources such as geoBoundaries, Natural Earth, OpenStreetMap, and government open data.
These maps are edited visual materials, not raw data files, and are provided for education, documents, presentations, and graphic reference.