Fayette County does not fit a simple urban-or-rural label when viewed through land cover. The 2025 summary lists developed cover at 37.78% and forest at 36.01%, leaving less than two percentage points between the two largest classes. Agriculture accounts for 13.96%, wetlands for 8.26%, and water for 2.43%. On the map, broad developed areas in the west and north sit close to forest, farmland, wetlands, and several visible reservoirs.
This page compares four views of the same county: general land cover, forest and farmland, impervious surface, and mapped class differences from 1985 to 2025. The WebP versions are placed in the article for quick viewing, while the four original JPG maps are available together in one download below. These are land-cover maps, not parcel, ownership, or zoning maps.
Table of Contents
A county split almost evenly between developed cover and forest
The general map is striking because neither development nor forest dominates the entire county. Red developed classes form large connected areas across the western side, continue through parts of the north, and appear in several central clusters. Dark green forest is stronger through much of the south-central and eastern interior, with additional patches inside developed areas. Yellow agricultural cover becomes more common toward the south and southeast. The result is a closely interwoven landscape rather than a single continuous urban core surrounded by one rural edge.
The percentages help explain that visual balance. Developed cover leads at 37.78%, but forest follows at 36.01%. Agriculture adds another 13.96%, wetlands 8.26%, water 2.43%, grassland 0.93%, and shrubland 0.24%. These values describe how the ground surface was classified in the 2025 dataset. They should not be read as percentages of residential, commercial, industrial, or protected land because those are different legal and planning categories.
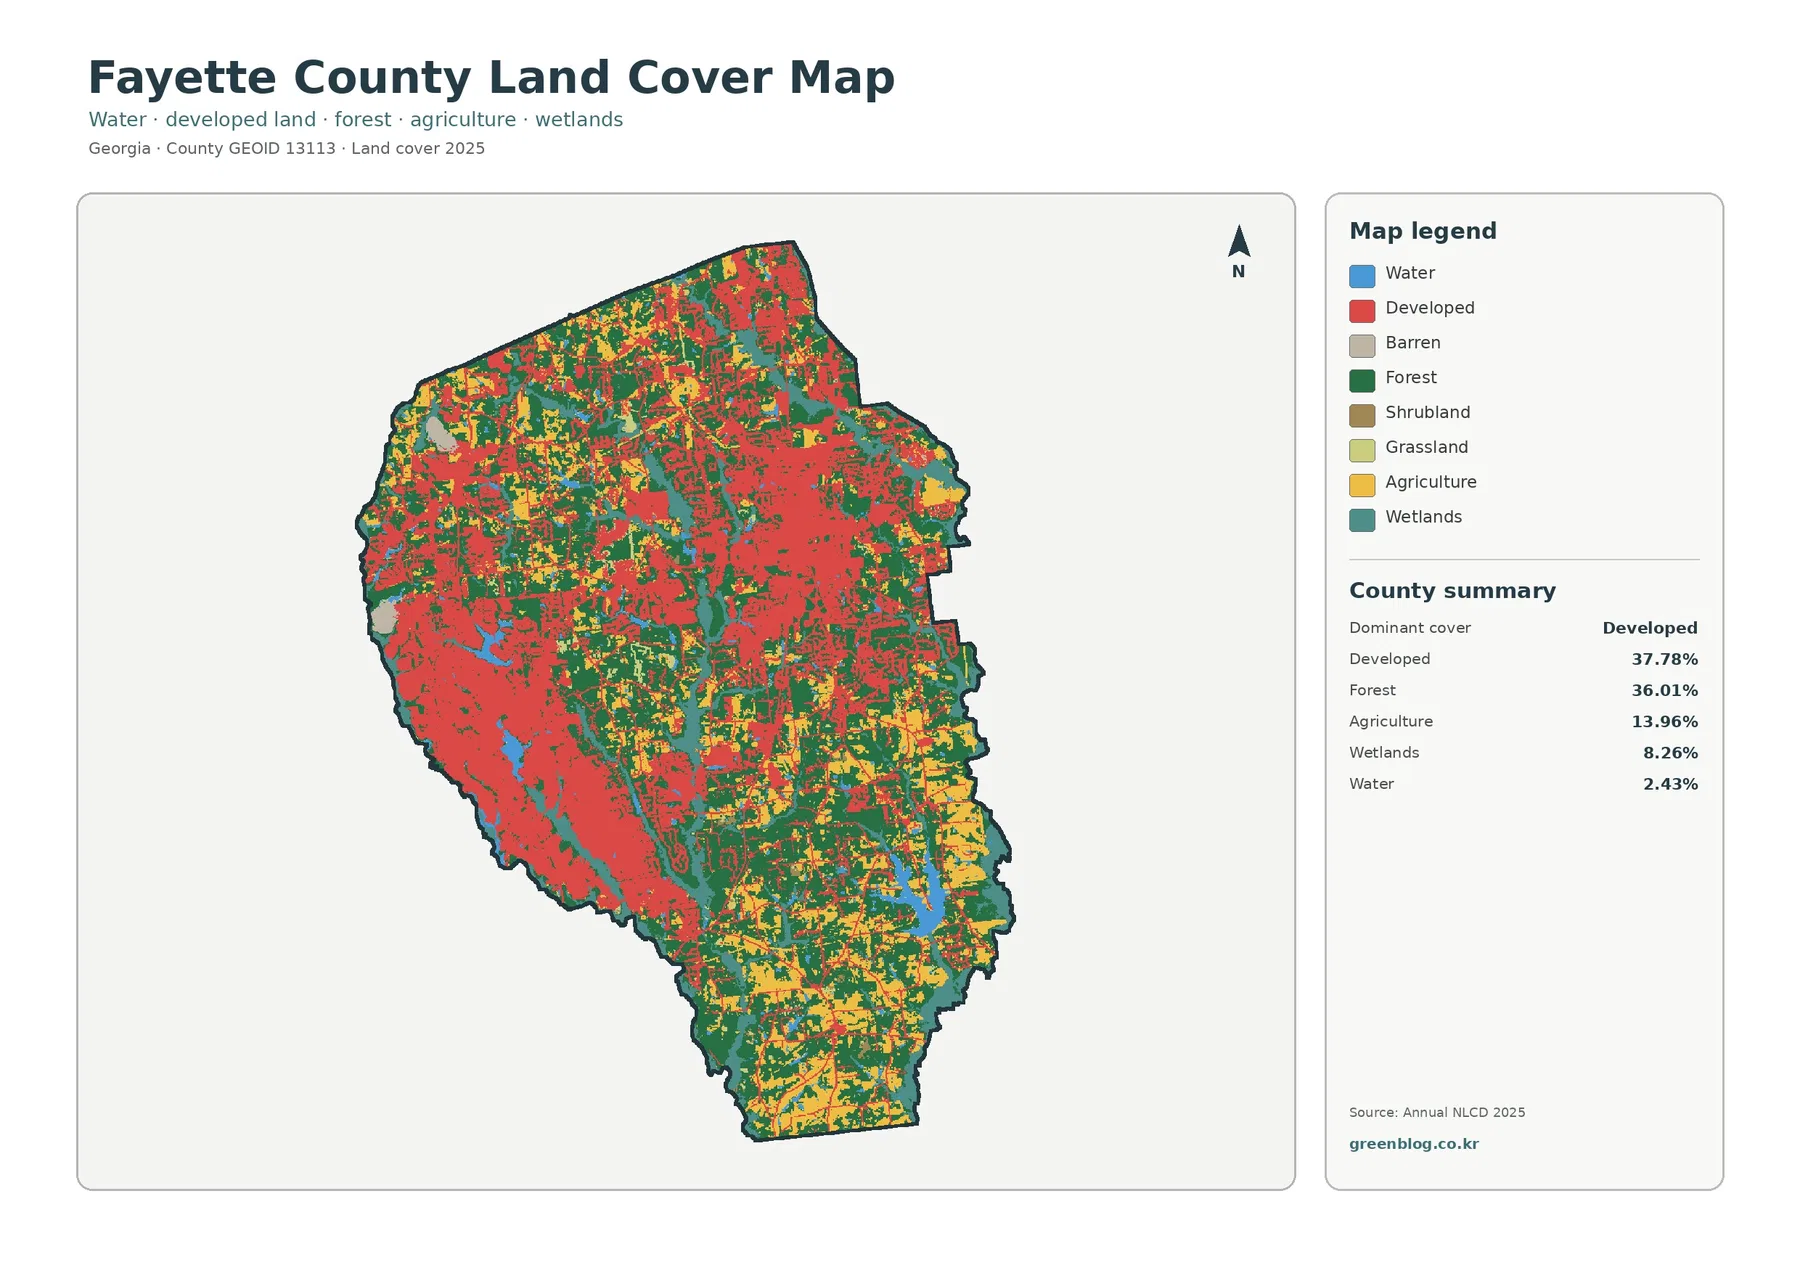
Looking from west to east makes the contrast easier to follow. The west contains some of the largest continuous developed blocks, while the southern and eastern portions show more green and yellow. In the center, development and forest break into smaller pieces and alternate over short distances. That pattern matters because a countywide percentage can hide local differences: two classes may be nearly equal overall even though each one is concentrated in different parts of the county.
Forest and working land become clearer when the developed classes are muted
The forest-and-farmland version removes much of the visual weight of the developed classes, making the remaining green and agricultural areas easier to compare. Forest forms broad bands through the central, eastern, and southern portions of Fayette County. Agricultural cover is especially noticeable in the south and southeast, where yellow and light green areas appear as larger fields instead of the small fragments seen in more developed parts of the county.
Forest at 36.01% is not confined to one large reserve. The map shows wooded tracts beside developed neighborhoods, around water, and across less built-up parts of the county. That makes forest cover relevant even in areas that would otherwise look suburban on a road map. At the same time, the green class does not identify ownership. A forested pixel may be on private land, public land, a large lot, or another type of property, and this map does not distinguish those situations.
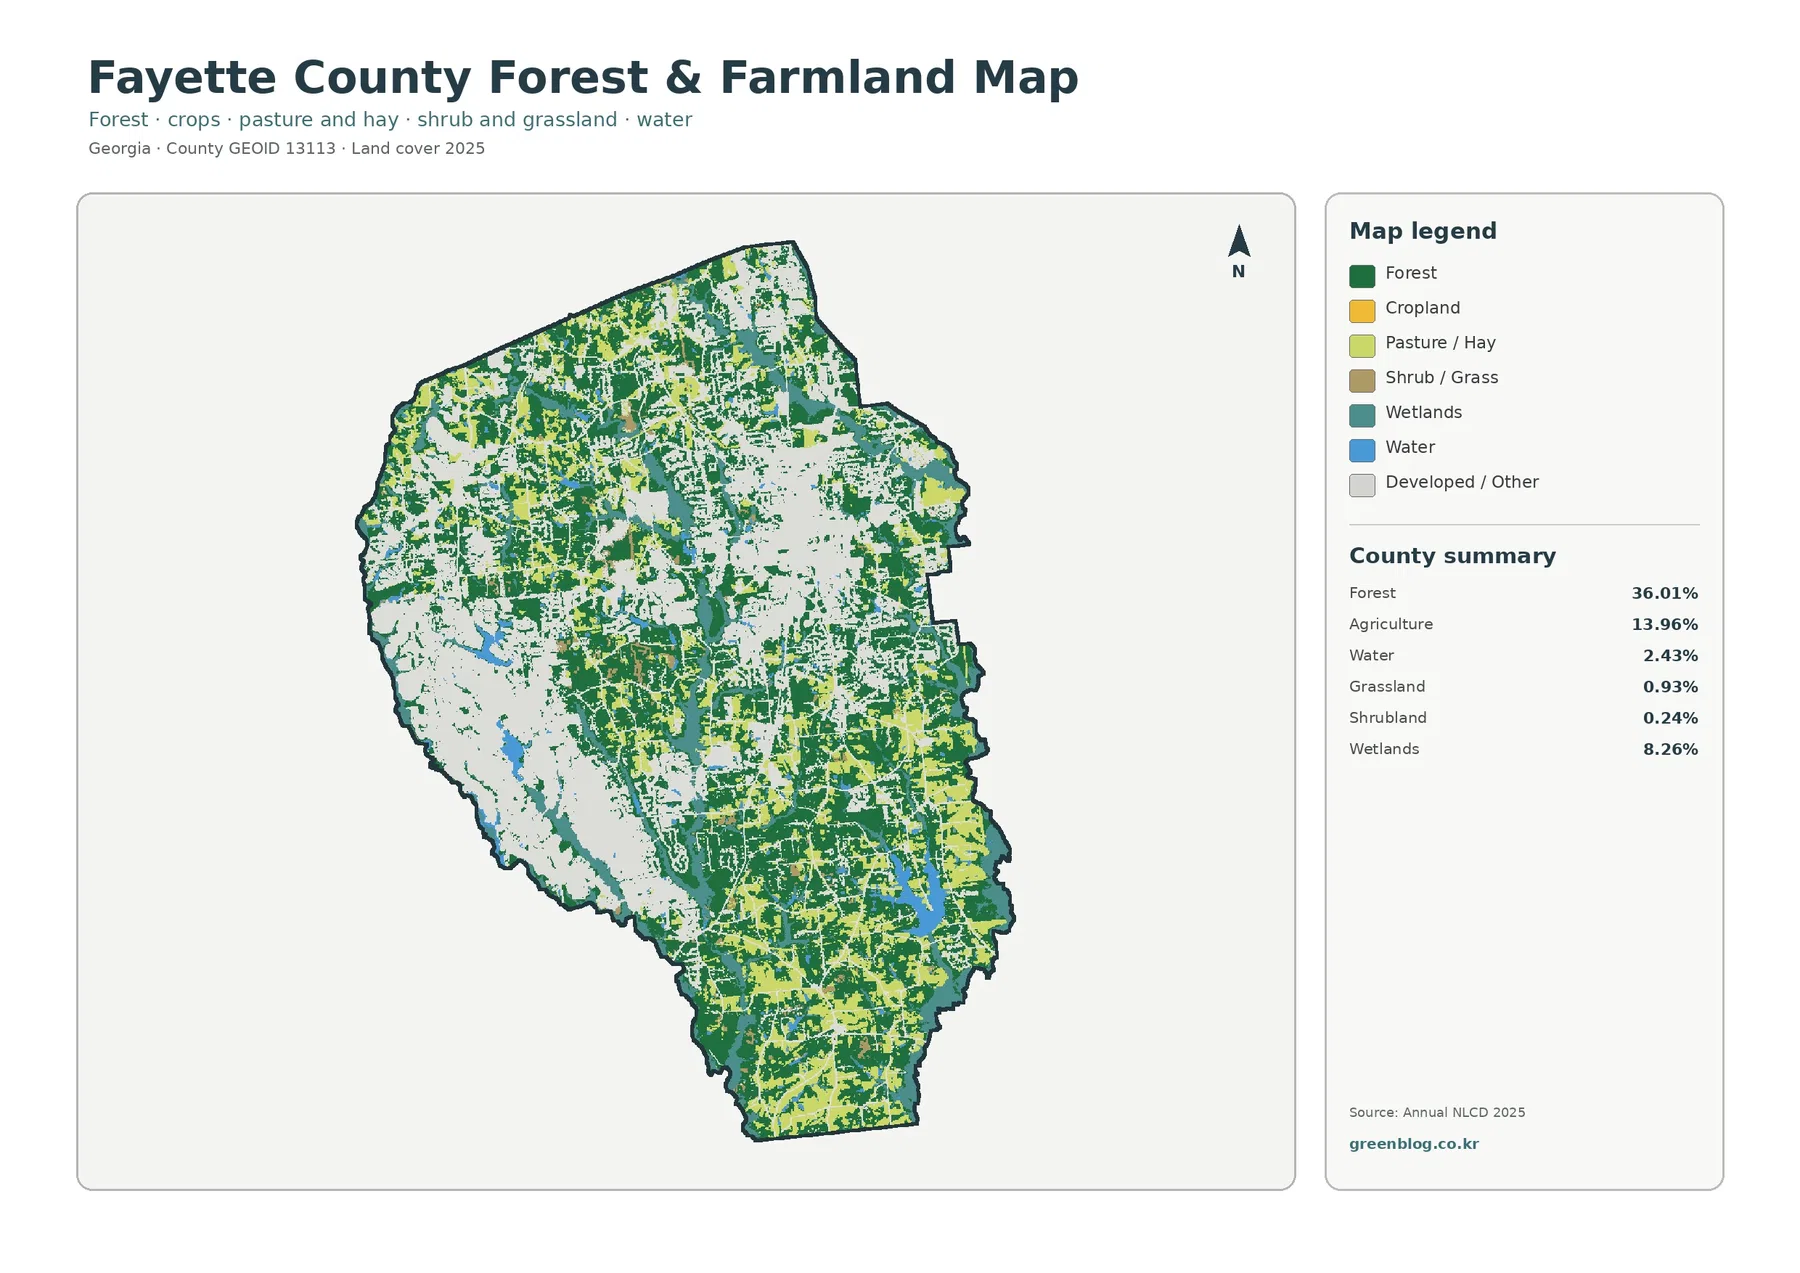
Agriculture covers 13.96% of the county. The map does not tell us which crop is grown, where one farm ends, or whether a field is actively cultivated in every season. Its value is broader: it shows where agricultural or pasture-related surfaces occupy enough area to form a recognizable part of the landscape. In Fayette County, those areas are more prominent away from the largest western developed blocks and help define the transition toward the southern part of the county.
Fayette County’s official Comprehensive Plan is useful background because it separates planning policy from what a land-cover map measures. The plan guides long-term decisions and discusses maintaining established communities, suburban neighborhoods, and rural areas. The map on this page does something different. It classifies the observed surface as forest, agriculture, water, developed cover, and other physical categories. A future land-use designation should therefore never be inferred from a land-cover color.
Reservoirs and wetlands add a second layer to the developed–forest contrast
Water makes up only 2.43% of the 2025 summary, yet the blue areas are easy to find because several are concentrated into distinct lake shapes. Fayette County’s official sources identify Lake Peachtree, Lake Kedron, Lake McIntosh, and Lake Horton among the county’s reservoirs. Those water bodies help explain why relatively modest water acreage can still be visually important on a county map. They also provide useful reference points when comparing the four map views.
Lake Horton, for example, is a large reservoir in southern Fayette County managed by the Fayette County Water System. Lake McIntosh is another county reservoir on Line Creek. The land-cover map can show how wooded, agricultural, and developed surfaces meet these larger water areas, but it does not provide depth, water quality, flood levels, shoreline regulations, or public-access boundaries. Those questions require reservoir or water-system information rather than land-cover classification.
Wetlands account for 8.26%, more than three times the mapped water share. Unlike the larger blue reservoirs, wetland cover often appears as thinner teal corridors or smaller patches associated with low-lying areas and drainage networks. These shapes can be easy to overlook when red development and dark green forest dominate the image. Their presence is important for understanding the map, but the classification is not a legal wetland delineation and cannot be used to determine permitting requirements.
Impervious surface reveals where development is physically hardest
Impervious surface means rooftops, pavement, parking areas, and similar surfaces that do not readily absorb rainfall. Fayette County’s mean impervious value is 9.87%, while 5.13% of the county is mapped at 50% or greater imperviousness. Those figures are much lower than the 37.78% developed-cover share because a developed class can still contain trees, lawns, bare soil, and other permeable surfaces around homes, roads, and buildings.
The strongest impervious concentrations appear in the broad western developed area and in several northern and central clusters. Thin linear traces extend between them, giving the map a road-like pattern in places. The southern portion is much lighter overall, with fewer large blocks in the highest classes. This makes the impervious map a useful companion to the general land-cover map: one tells you where land is classified as developed, while the other shows where hard surfaces are especially concentrated.
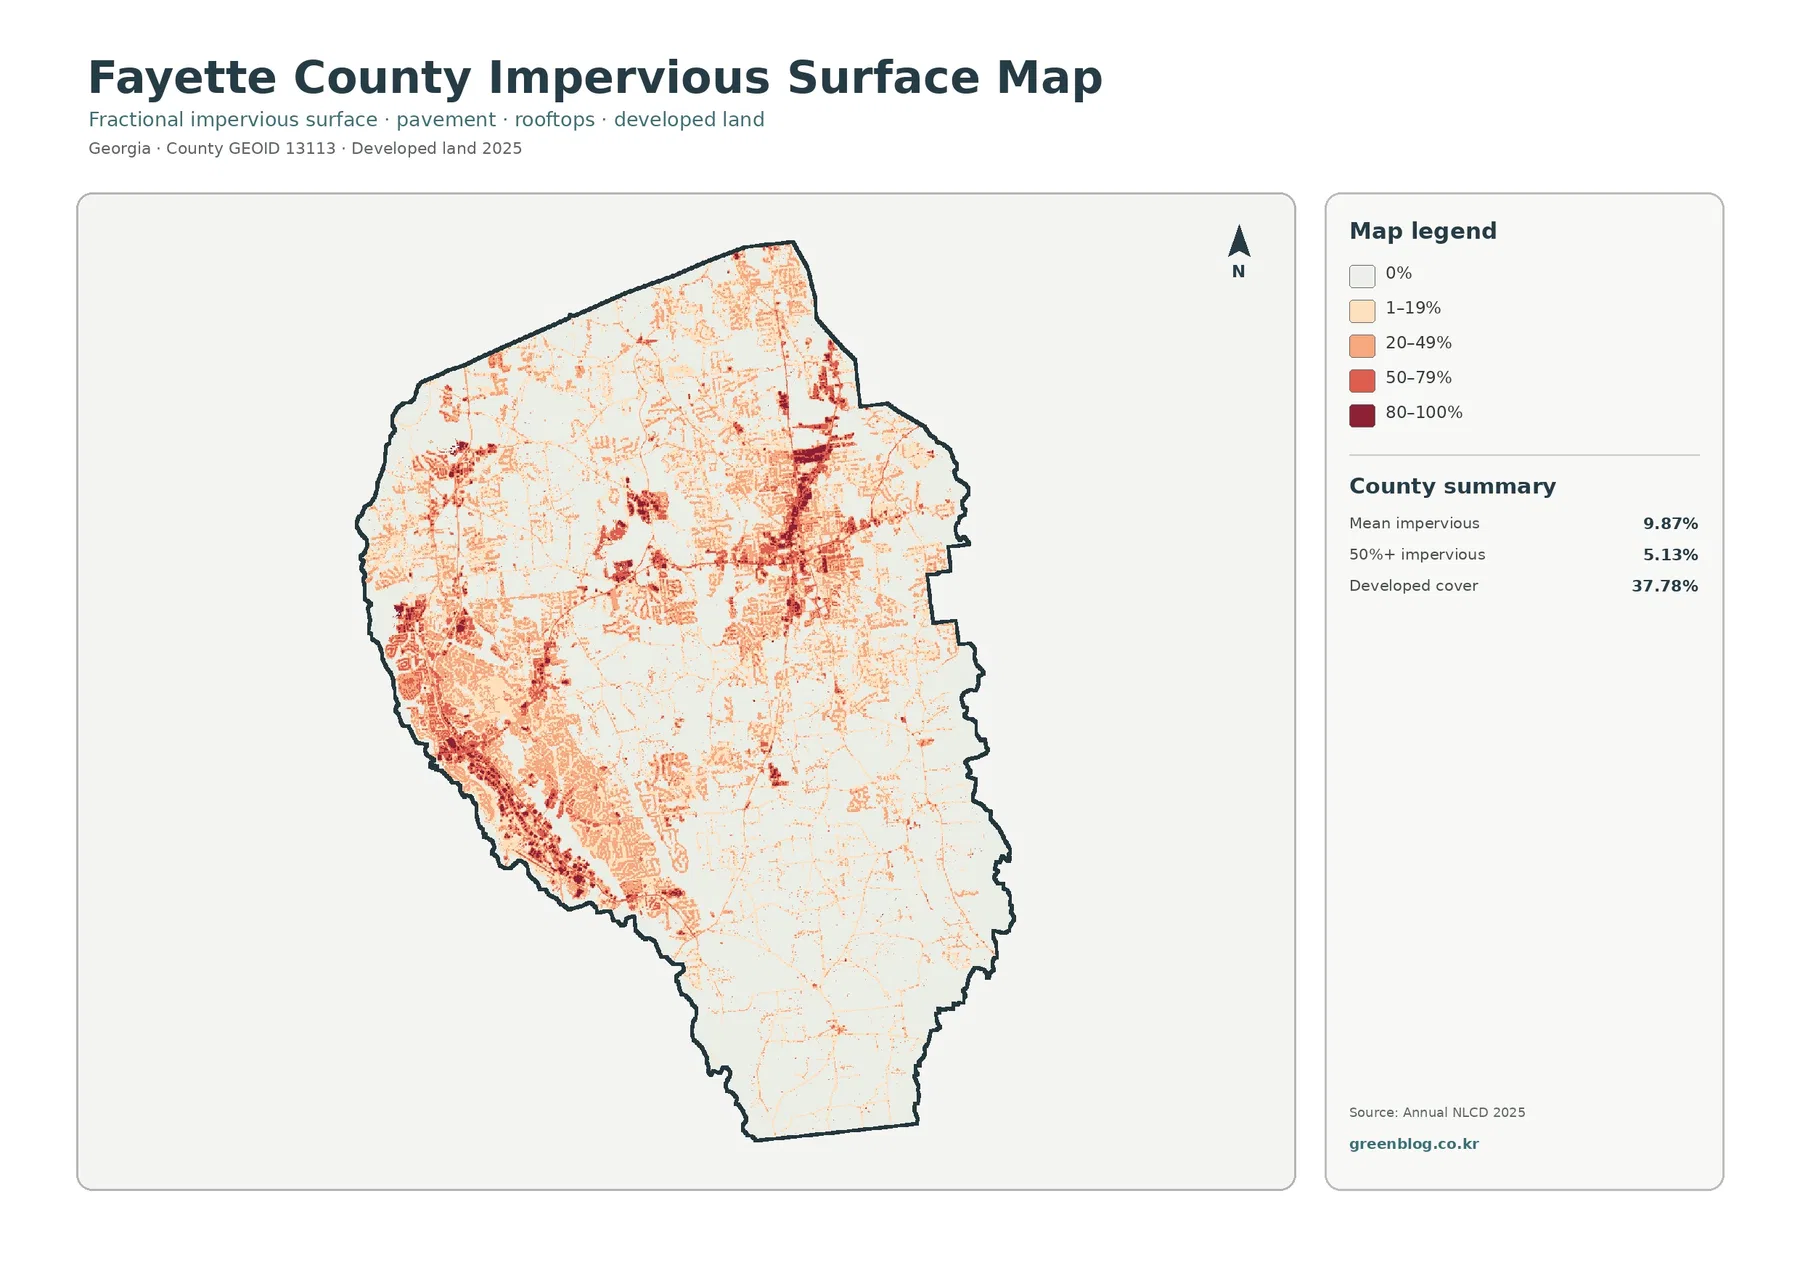
This distinction is useful in environmental education and watershed discussions. A neighborhood may be classified as developed even when substantial tree canopy and lawn remain, whereas a commercial center or wide paved corridor can contain a much higher fraction of impervious surface. The map does not measure stormwater flow directly, but it helps identify where hard surfaces are more concentrated before a reader moves to more specialized hydrology or infrastructure data.
The 1985–2025 comparison is dominated by cells classified as developed
The change map compares mapped classes from 1985 and 2025. A class difference is recorded across 32.75% of the county. Of that area, 20.75% is labeled as changed to developed, 3.20% as forest loss, 1.05% as agricultural loss, and 7.39% as other class difference. The headline number is therefore not a simple measure of new construction. It is a comparison between two classified land-cover snapshots separated by forty years.
Red change cells are widespread across the west, north, and center and appear in many of the same broad areas that now contain stronger impervious values. Smaller red patches also extend into mixed parts of the county. Orange forest-loss cells and yellow agricultural-loss cells are more scattered. The distribution suggests that the most useful way to read the map is by looking for repeated clusters and broad zones, not by treating every isolated colored pixel as a confirmed individual development event.
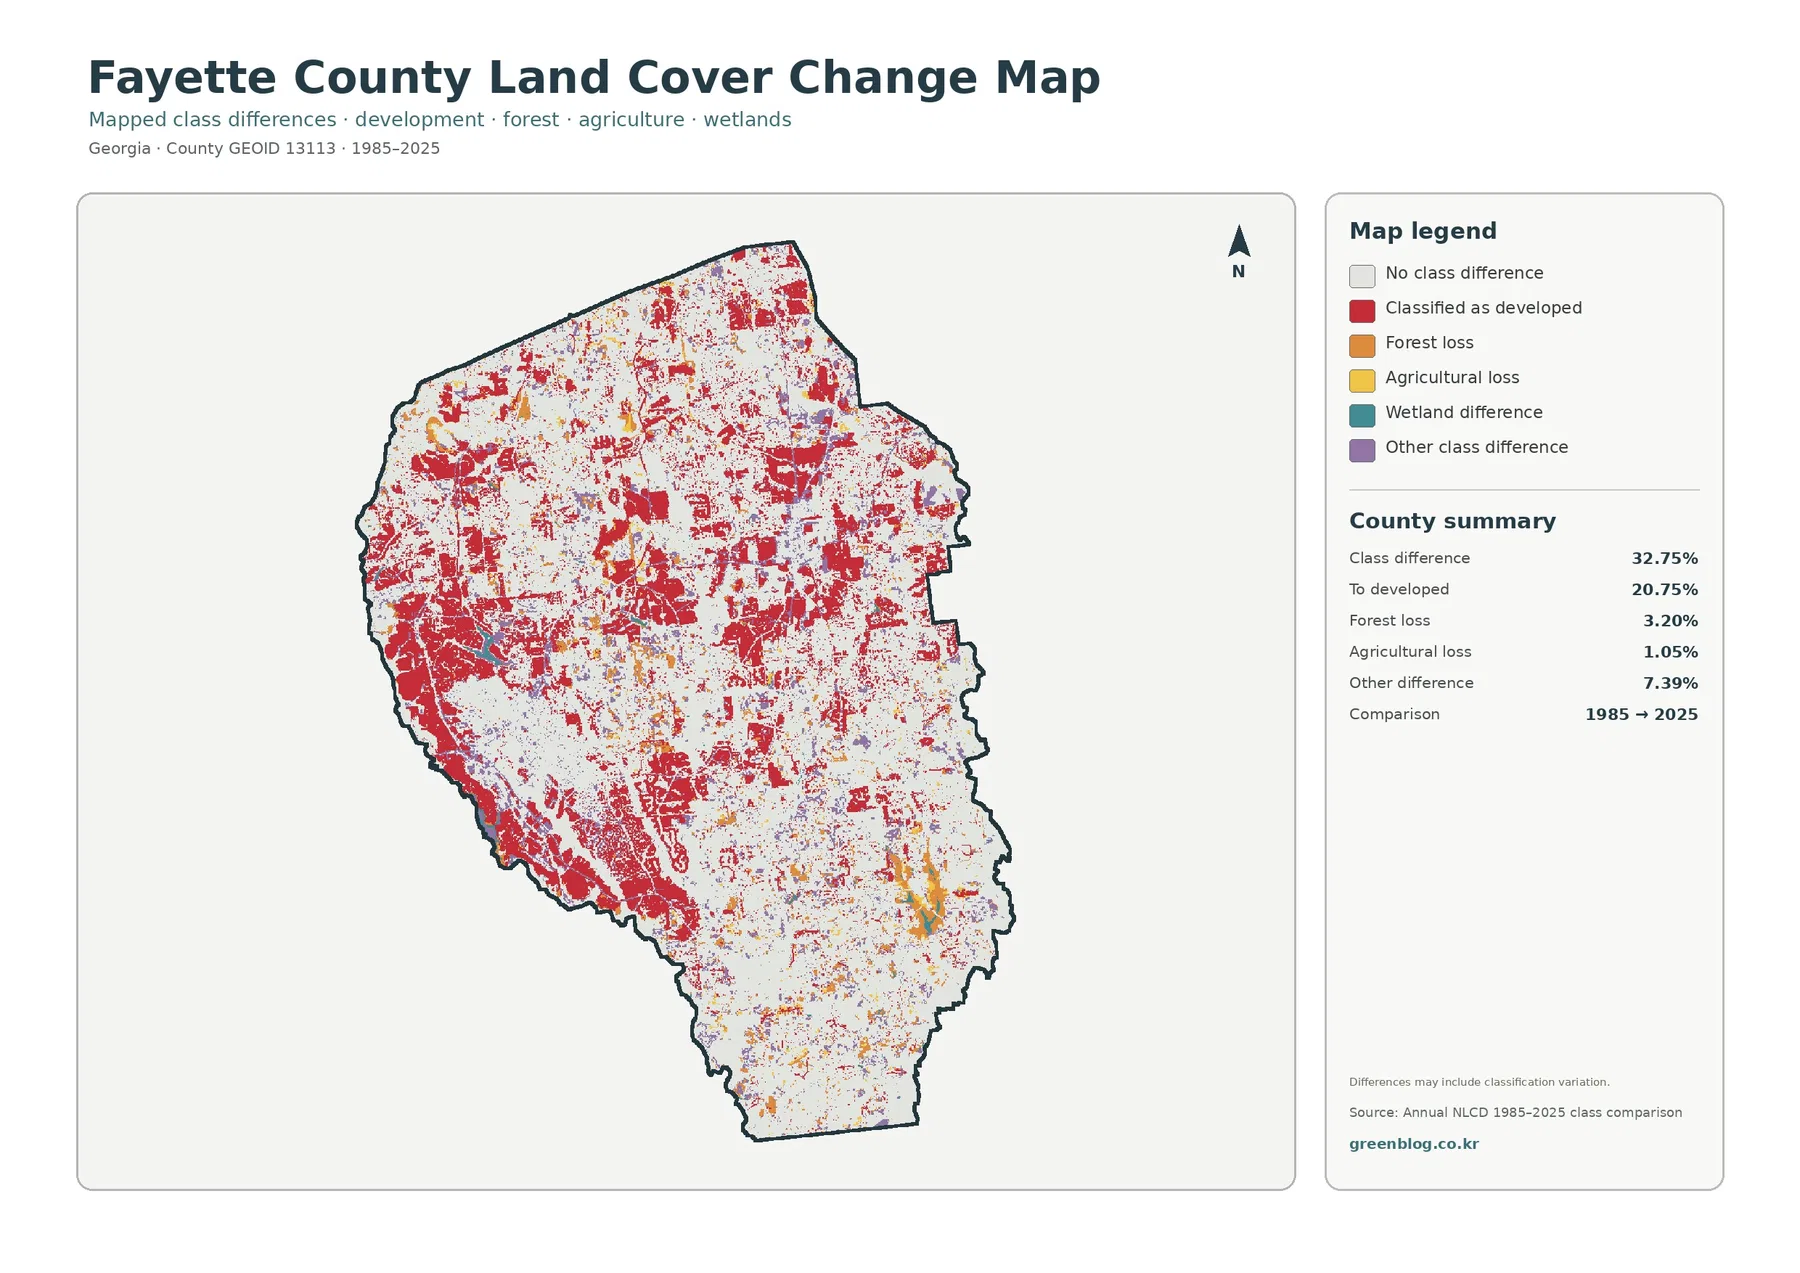
The map itself warns that differences can include classification variation. Land-cover products divide the surface into raster cells, and each cell receives a representative class. A cell near a road, yard, forest edge, or farm can contain several real surfaces at once. Differences in imagery, classification rules, or mixed pixels can therefore produce a changed class even when the physical change on the ground is more complicated than the color suggests.
Reading the four maps together changes the story
The general map tells the broadest story: development and forest are nearly tied countywide. The forest-and-farmland map then makes the nonurban side of that balance easier to see, especially in the south and southeast. The impervious map separates lower-density developed land from places with denser hard surfaces. Finally, the 1985–2025 map adds a time comparison, showing where the classification now differs from the earlier snapshot.
The western side is a good example. It appears broadly developed in the general map, contains several of the strongest impervious concentrations, and also carries many red cells in the long-term comparison. The south tells a different story: agriculture and forest are more visible, the impervious map is lighter, and the change pattern is more fragmented. Neither description applies to the entire county, which is why the four-map set is more informative than one image alone.
Water provides another convenient anchor. Find one of the larger blue reservoirs on the general map, then check the same location in the forest-and-farmland view and the impervious map. This lets you compare wooded shore areas, nearby developed surfaces, and agricultural or wetland cover without relying on memory. In a presentation, keeping the same map extent across all four images makes these comparisons especially easy for viewers to follow.
What the colors can and cannot tell you
Annual land-cover data are raster products, meaning the ground is divided into a regular grid and each cell is assigned a class. Real property boundaries are much more detailed than that grid. A cell at the edge of a subdivision, forest, field, or reservoir may contain several surfaces, so the mapped boundary should be treated as generalized. It is appropriate for county-scale comparison, not for locating a fence line or deciding what exists on a particular parcel.
Developed cover and impervious surface also answer different questions. Developed cover describes a broader land-cover class that can include vegetation around buildings. Impervious surface estimates the fraction occupied by hard material such as pavement and rooftops. Fayette County’s 37.78% developed share and 9.87% mean impervious value are therefore not contradictory. They describe different parts of the same developed landscape.
The same caution applies to farmland and wetlands. An agricultural color does not identify an owner, farm business, crop, or zoning district. A wetland class does not establish a regulatory wetland boundary. If the purpose is a permit, property transaction, engineering design, or site-specific environmental review, the reader should use current parcel records, surveys, agency data, and field verification instead of relying on this map set alone.
Useful ways to use the Fayette County map set
For a county overview, begin with the general land-cover map because it places development, forest, agriculture, wetlands, and water in one frame. A classroom or environmental presentation can add the forest-and-farmland map to make the southern agricultural areas and remaining wooded land easier to discuss. The impervious map is better when the topic is built surfaces, development density, or the difference between a broad developed category and actual pavement or rooftops.
The change map works best as a starting point for historical comparison rather than as a final record of what happened at a specific site. Use the larger clusters to identify areas worth checking, then compare them with aerial imagery, county planning documents, or other dated sources. Because the map compares 1985 and 2025 endpoints, it cannot tell you exactly when an intermediate change occurred or whether a site changed more than once during that period.
The article uses WebP images for efficient browser viewing. The download package contains the four original JPG files, each measuring 2480×1754 pixels: the general land-cover map, forest-and-farmland map, impervious-surface map, and 1985–2025 change map. The package does not mark these files as meeting an A3 300-dpi reference, so anyone preparing a large print should check sharpness at the intended physical size before final output.
Frequently Asked Questions
Is Fayette County mostly developed land or mostly forest?
Developed cover is the largest 2025 class at 37.78%, but forest is very close at 36.01%. The map shows that the two classes are not evenly mixed everywhere: development is stronger in broad western, northern, and central areas, while forest becomes more prominent through much of the south-central and eastern county. The county is therefore better described as a close developed–forest balance than as a uniformly urban or forested place.
Why are the reservoirs important when water is only 2.43%?
Water occupies a modest share of the total area, but it is concentrated into visible features. Fayette County sources identify reservoirs including Lake Peachtree, Lake Kedron, Lake McIntosh, and Lake Horton. Large concentrated water bodies can stand out strongly on a map even when their countywide percentage is small, and they provide useful reference points for comparing nearby forest, development, farmland, and wetlands.
Does the 32.75% class difference mean one-third of Fayette County was physically transformed?
No. The value represents cells whose mapped class differs between the 1985 and 2025 comparison, and the map notes that some differences may reflect classification variation. It is useful for finding broad areas of change, but it should not be treated as a parcel-level measurement of construction, clearing, or agricultural conversion. Site-specific conclusions require additional dated imagery and local records.
Map File Information
The four original JPG land-cover maps for Fayette County are provided together in one ZIP file.
- Included Versions: General land cover, forest and farmland, impervious surface, and 1985–2025 land-cover change
- Printable Size: 2480×1754 pixels each
- File Type: ZIP containing four JPG files
Related Maps
- Appling County Georgia Land Cover Map
- Atkinson County Georgia Land Cover Map
- Bacon County Georgia Land Cover Map
Sources and references
- MRLC Annual NLCD Data – annual land-cover and impervious-surface data
- USGS Annual NLCD Land Cover Classification – definitions of land-cover classes
- Fayette County Comprehensive Plan – county planning and land-use policy background
- Fayette County Lake Horton Park – official reservoir and park information
- Fayette County Lake McIntosh Park – official Line Creek reservoir information
- U.S. Census Bureau TIGER/Line Shapefiles – county boundary data
Green Map creates custom-edited map images using open geographic data sources such as geoBoundaries, Natural Earth, OpenStreetMap, and government open data.
These maps are edited visual materials, not raw data files, and are provided for education, documents, presentations, and graphic reference.