Fannin County in north Georgia is overwhelmingly forested, but the four supplied maps reveal strong local contrasts. The 2025 county summary gives forest a share of 83.20%, compared with 7.80% developed land and 6.69% agriculture. Blue Ridge Reservoir is the clearest water feature, while the strongest developed concentration appears around Blue Ridge and thinner developed traces extend through other settled corridors.
This page combines a general land-cover map, a forest-and-farmland view, an impervious-surface map, and a 1985–2025 change comparison. The four original JPG maps are available together in one download below. Looking at the same county four ways makes it easier to separate broad forest cover from farming, hard surfaces, water, and areas whose mapped class differs between the two comparison years.
Table of Contents
Forest dominates the county, but not every part looks the same
The general map is mostly dark green. The western side and much of the long southern section contain broad forest areas with relatively few interruptions. In the center and north, yellow agricultural patches and red developed land appear more often between forested areas. The pattern becomes especially busy around the reservoir and the main settlement cluster, where water, forest, development, and smaller open areas sit close together.
The 2025 summary lists forest at 83.20%, developed land at 7.80%, agriculture at 6.69%, water at 1.32%, and grassland at 0.59%. Shrubland is 0.28% and wetlands 0.02%. These values describe surface cover derived from remotely sensed data. They are not zoning, parcel ownership, or legal land-use categories, so a green cell does not identify who owns the forest and a red cell does not say what future development is allowed.
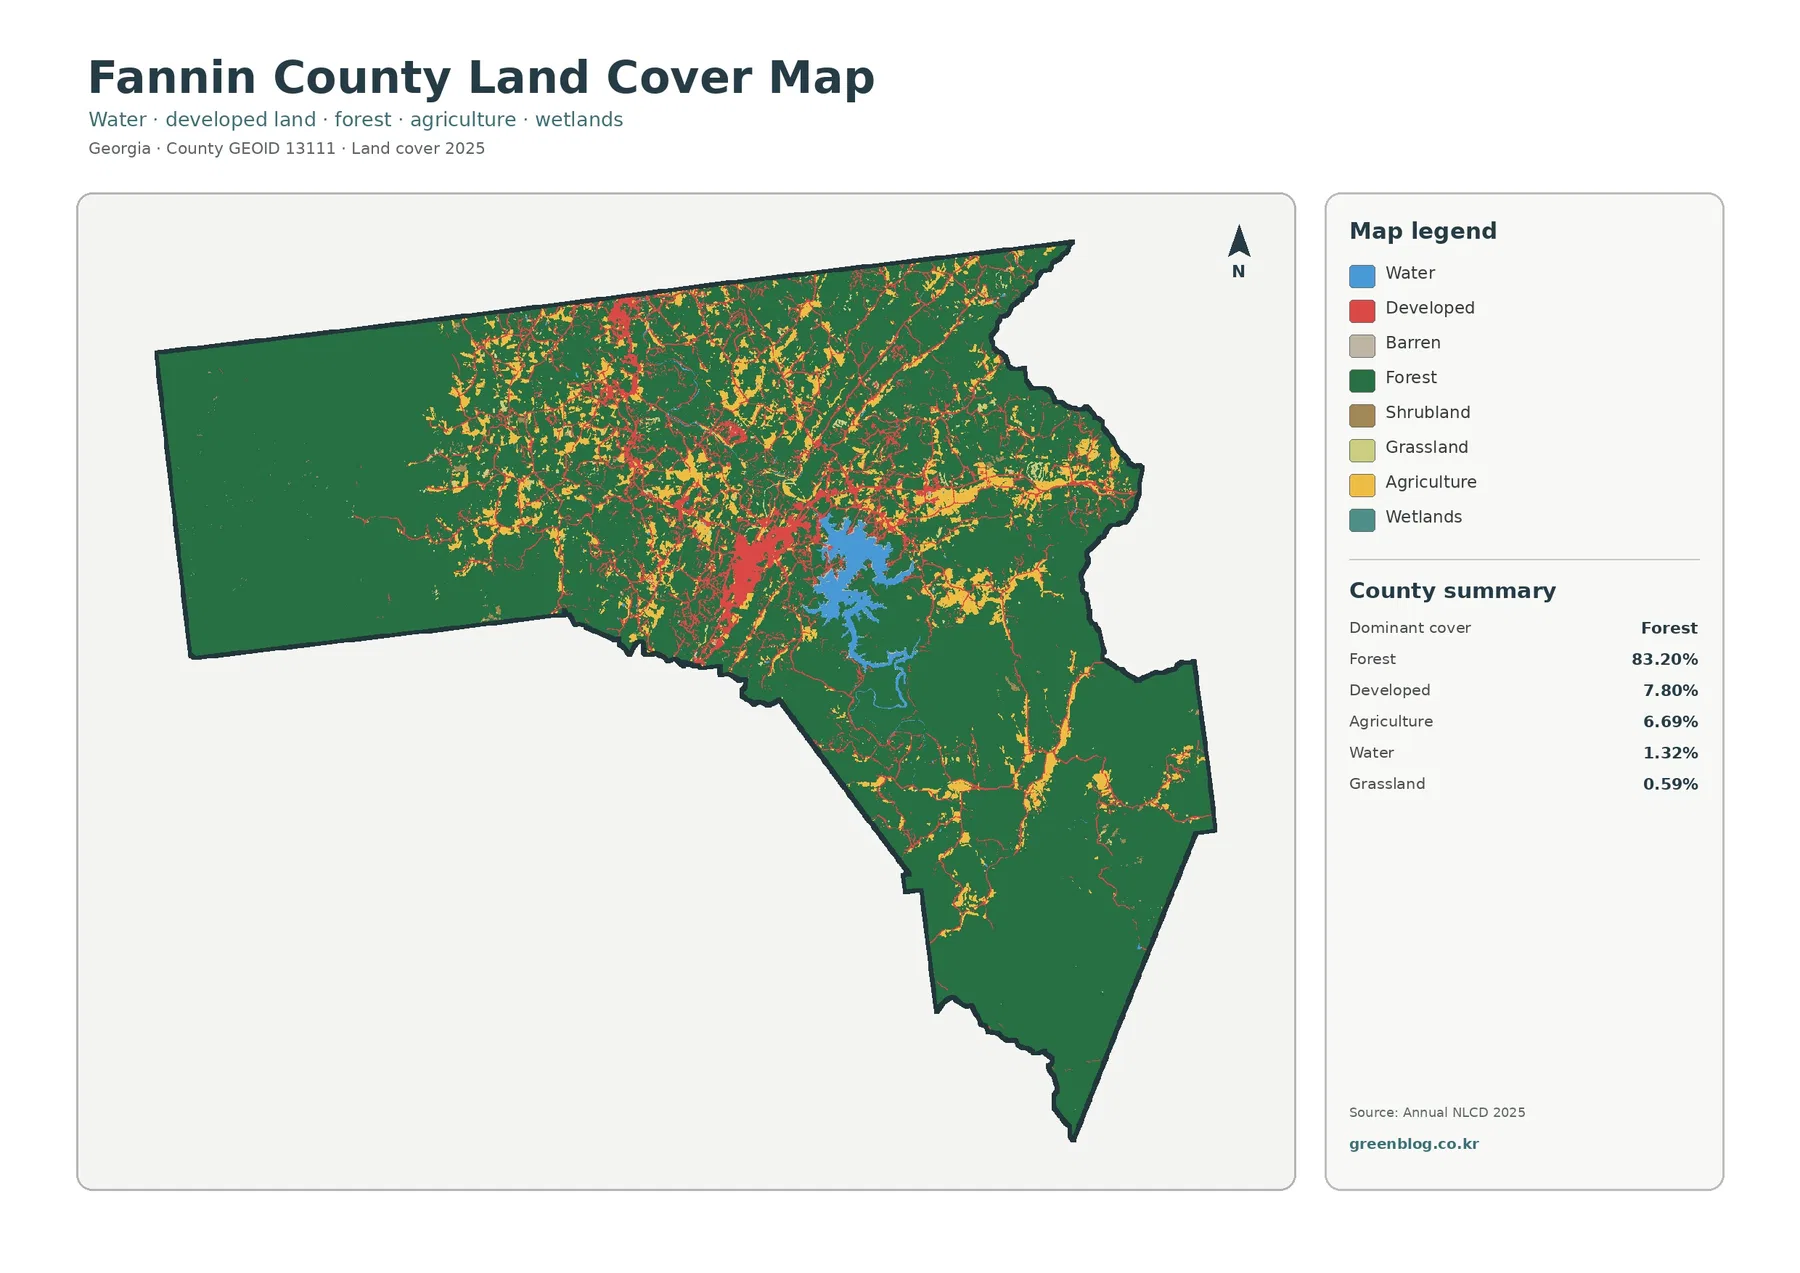
Water covers a small share of the county total, yet Blue Ridge Reservoir stands out because it is concentrated in one large connected feature. The Tennessee Valley Authority identifies the reservoir as a Toccoa River project in Fannin County. Using it as a landmark makes the surrounding pattern easier to follow: the large forest blocks are obvious, and the developed area around Blue Ridge becomes easier to locate relative to the water.
Forest and farmland form a mountain pattern, not a broad agricultural plain
The forest-and-farmland map simplifies the view. The western portion remains almost continuously green, while agricultural colors appear as smaller openings through the central and northern parts of the county. Instead of one continuous farming belt, the map shows many irregular patches within a much larger forest setting. This is why the agriculture percentage is more useful when read together with its location rather than as a countywide number alone.
U.S. Forest Service material describes the Southern Blue Ridge Mountains as rugged terrain with steep slopes, narrow valleys, and many streams. That regional setting helps explain why open land appears in narrower, scattered areas on the map. It does not prove the use of any individual field, and the land-cover classes do not distinguish an orchard from pasture or another agricultural surface.
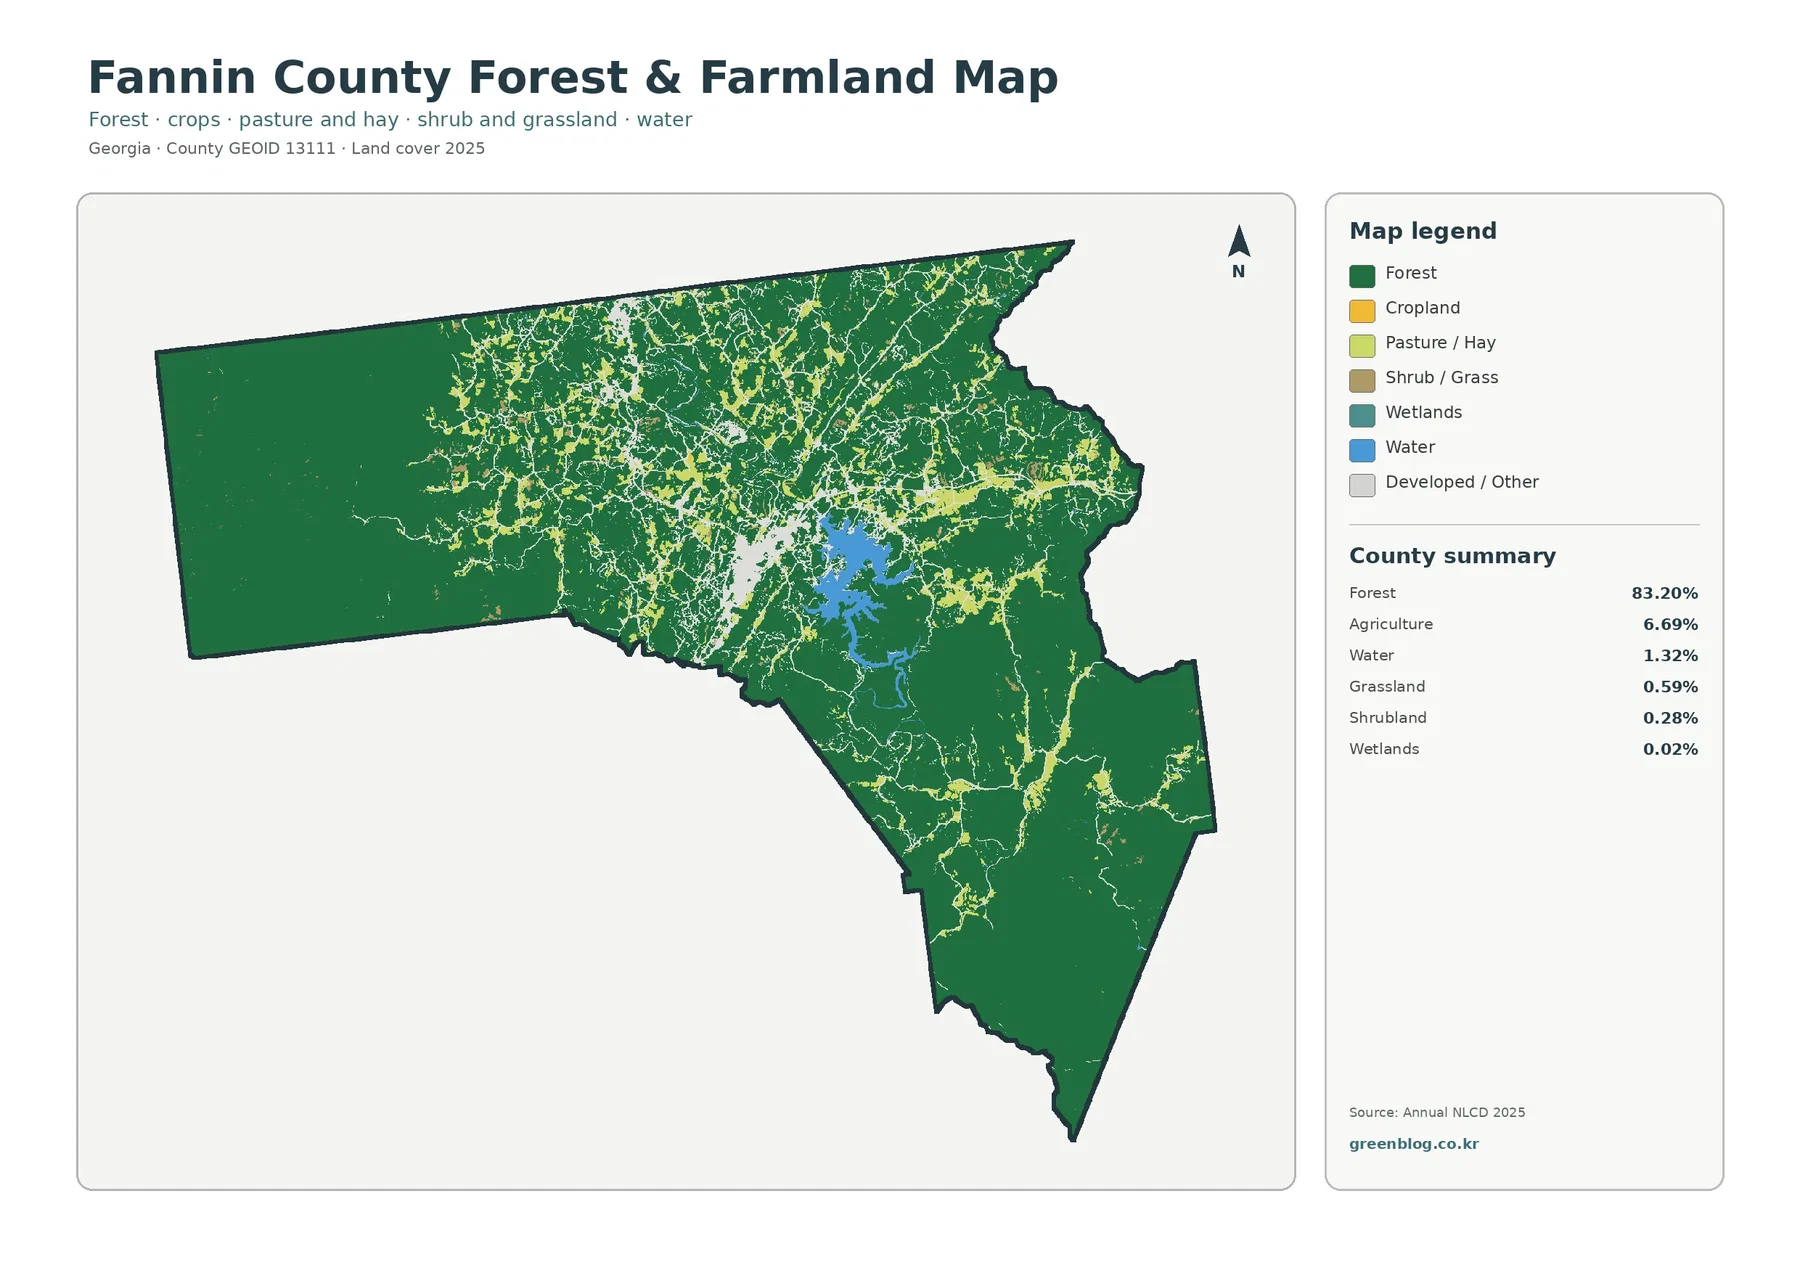
Local agricultural activity is more varied than the map legend can show. University of Georgia Extension reports apples, grapes, poultry, and cattle among important parts of Fannin County agriculture. Those facts provide local context for the 6.69% agricultural class, but they should not be assigned to individual map patches without a crop-specific dataset. The map is useful for seeing where agricultural cover occurs; it is not a farm-boundary or crop-identification map.
Impervious surfaces concentrate around Blue Ridge and settlement corridors
The impervious-surface map focuses on pavement, rooftops, and other hard surfaces that do not readily absorb water. Fannin County has a mean impervious value of 1.29%, and 0.51% of the county is mapped at 50% impervious or higher. Those values are small at county scale, but the map shows that hard surfaces are not evenly distributed. The strongest concentration sits around Blue Ridge, with thinner lines and small nodes extending along roads and other settled areas.
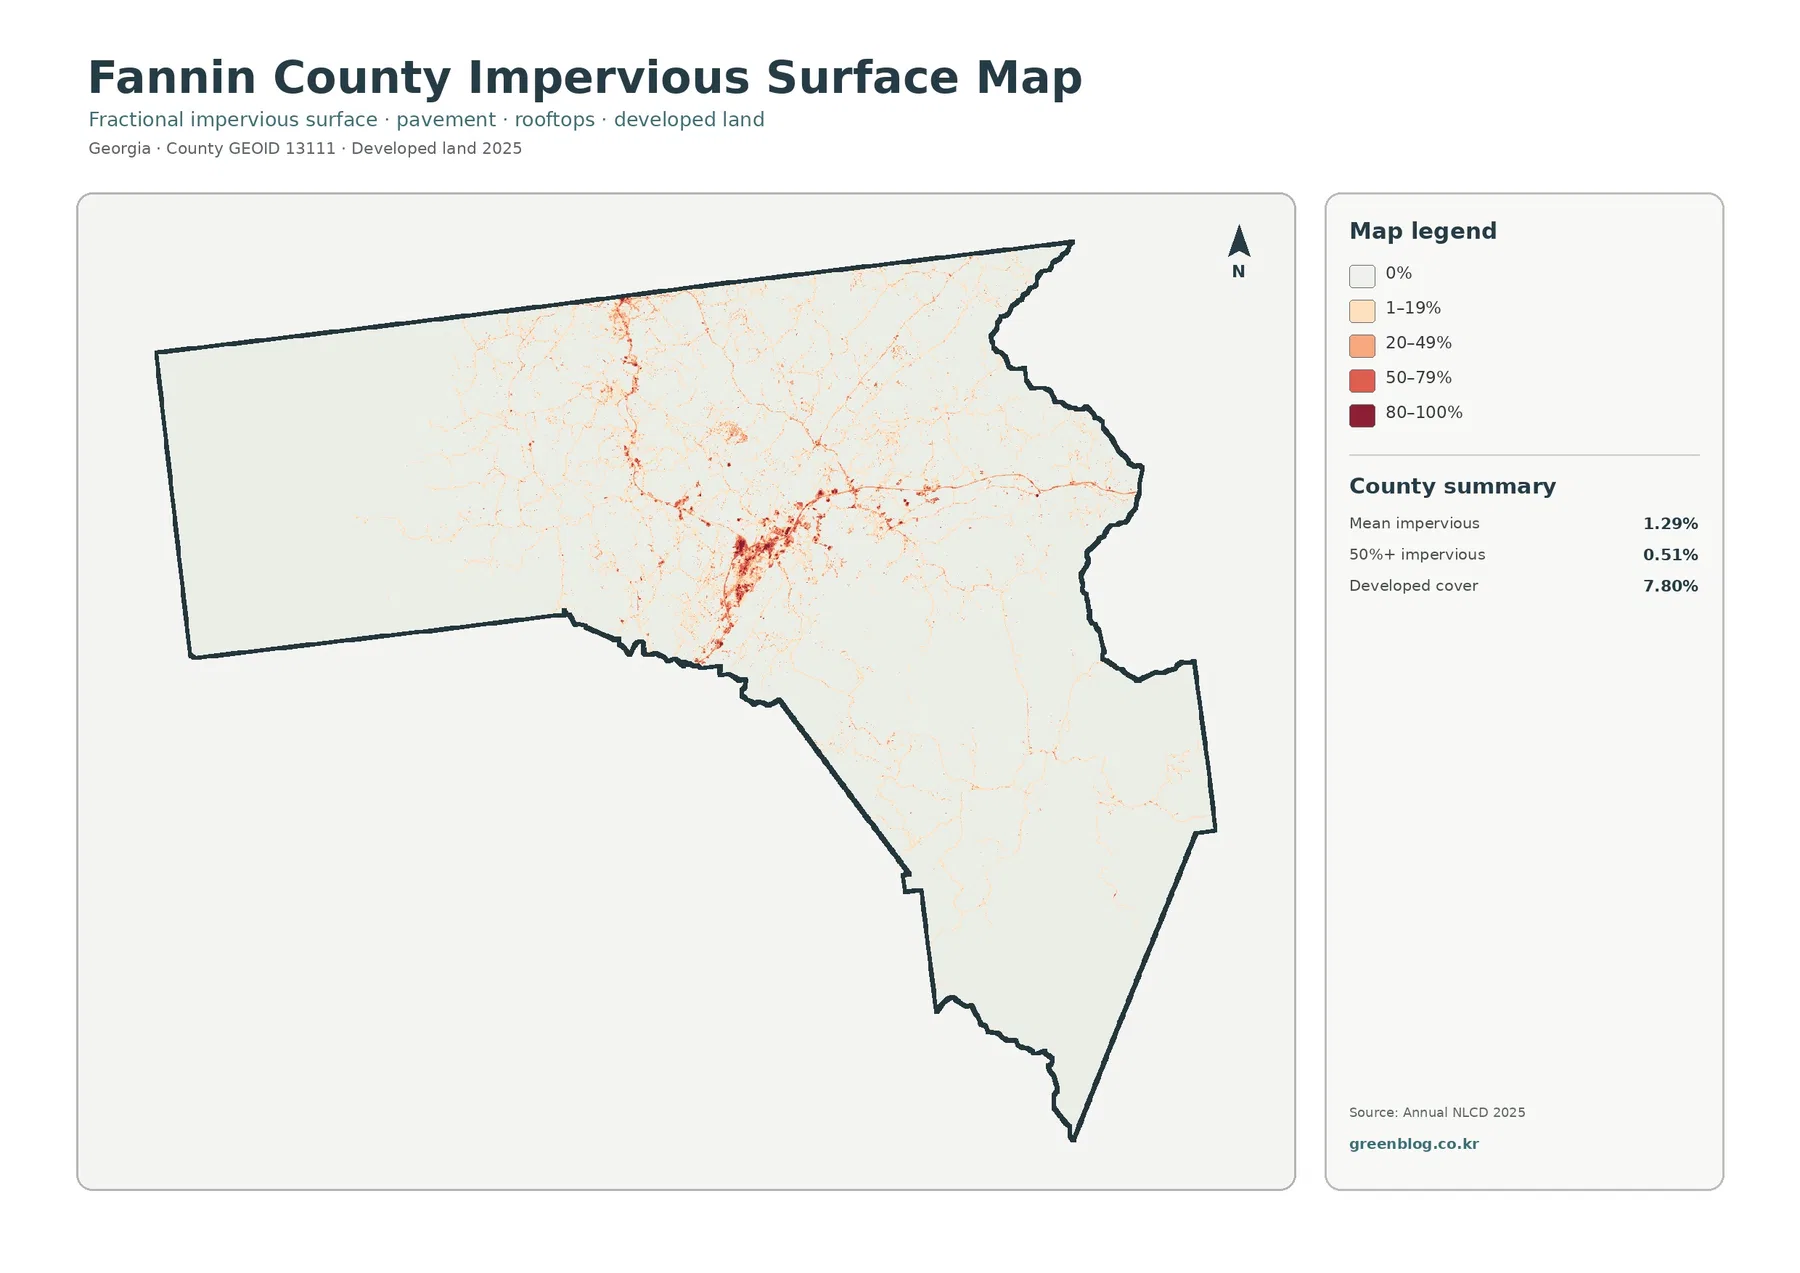
Developed land and impervious surface are related but different measures. The general map classifies 7.80% of the county as developed, and some of those classes can contain lawns, trees, soil, streets, and buildings together. The impervious layer isolates the harder surface component. Reading both maps prevents the common mistake of assuming every developed cell is mostly pavement or rooftops.
The county government site lists communities such as Blue Ridge, Epworth, Mineral Bluff, McCaysville, Morganton, Coopers Creek, and Dial. The supplied impervious map does not label these places, but that settlement context is helpful when interpreting why dense built surfaces appear as a central cluster and smaller corridors rather than as a broad continuous urban area.
The 1985–2025 map records many kinds of class difference
The change map compares the mapped classes for 1985 and 2025. It reports class differences across 13.87% of Fannin County. Within that total, 2.74% is marked as change to developed land, 2.03% as forest loss, 0.20% as agricultural loss, and 8.90% as other class differences. Development therefore represents only part of the total difference shown on this map.
Change-to-developed cells are most noticeable around the Blue Ridge area and parts of the central-to-northern settled zone. Forest-loss marks and other differences are more widely scattered, including within areas that remain mostly forested in 2025. The western side contains many small change pixels rather than one large converted block, so the map is better for identifying repeated zones of difference than for drawing conclusions from one isolated spot.
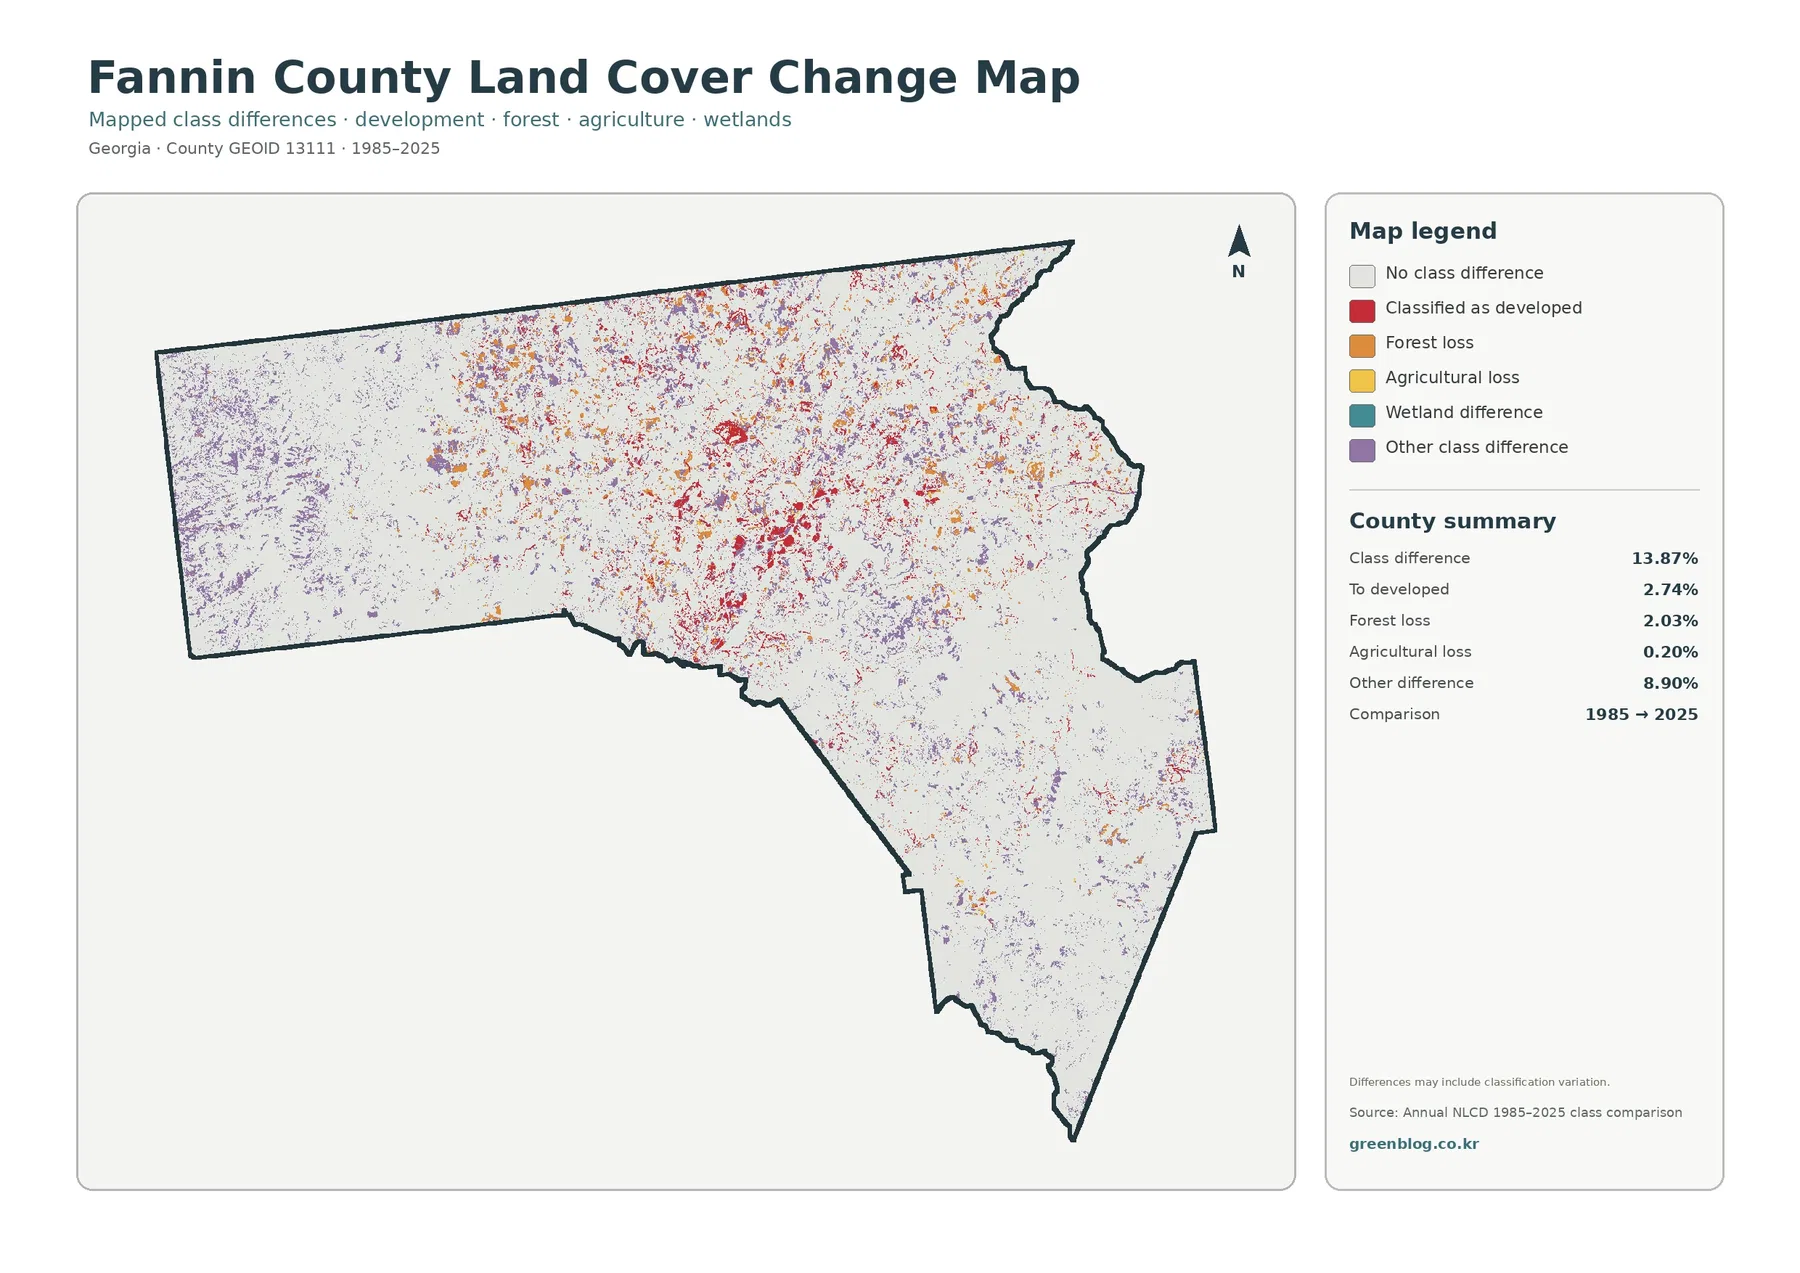
The supplied map also warns that differences can include classification variation. Land-cover products divide the landscape into raster cells, or small grid squares, and assign a class to each cell. A cell near a road, forest edge, or house can contain more than one real surface type. Differences between years can reflect true change, classification uncertainty, imagery conditions, or a combination of factors. A small colored cell should not be treated as proof of a particular construction project or timber harvest without more detailed evidence.
Blue Ridge Reservoir is a useful anchor across all four views
The reservoir connects the four maps visually. On the general map it is the largest blue feature. On the forest-and-farmland map it provides a clear reference for comparing wooded shoreline with nearby openings. The impervious map shifts attention toward the developed area beside the reservoir, while the change map shows where class differences are concentrated in the same broader part of the county. Moving between the maps with one fixed landmark makes the comparison much easier.
TVA states that Blue Ridge Reservoir lies on the Toccoa River in Fannin County and extends southeast from the dam. The Toccoa continues northwest toward Tennessee, where it becomes the Ocoee River. That information helps identify the water feature, but these land-cover maps are not flood, streamflow, or water-quality maps. Anyone studying those topics should combine this material with dedicated hydrologic sources.
The extensive green areas need a similar caution. Forest Service references place this part of north Georgia within the mountainous Southern Blue Ridge setting, but forest land cover does not equal federal ownership. Some wooded land is public and some is private. A public-land or parcel layer is required to answer ownership questions.
Which map should you use?
For a fast county overview, use the general land-cover map first. It keeps forest, development, agriculture, water, grassland, shrubland, and wetlands in one view and makes the 83.20% forest dominance immediately clear. The forest-and-farmland version is better when the question is where agricultural openings sit within that forested setting. It removes some visual competition and makes the smaller open patches easier to follow.
Choose the impervious map when you want to compare the concentration of pavement and rooftops. It is useful for a watershed lesson or a discussion of settlement intensity, but it does not directly measure runoff or water quality. For historical comparison, place the 1985–2025 change map beside the 2025 land-cover map. One shows the endpoint pattern; the other shows where the two selected years differ.
The maps can also work well in reports, classroom slides, or local reference material because each one answers a different visual question without requiring a GIS program. A two-map layout can be especially effective: general land cover beside impervious surface for development context, or forest-and-farmland beside the change map for a current-versus-change comparison.
Dates, scale, and limits matter when reading the map
Annual NLCD is a raster dataset, so the class boundaries are generalized rather than drawn to match every fence, driveway, or property line. Mixed pixels are especially important around narrow roads and developed edges, where one cell can contain trees, lawn, pavement, and buildings. County-scale patterns are reliable for broad comparison, but the maps should not be used as parcel surveys.
The current maps represent the 2025 classification. Construction, clearing, regrowth, or agricultural changes after that observation period may not appear. The change map compares 1985 with 2025 and does not display every intermediate step. A place could have changed more than once during those decades and still be represented only by the two endpoint classes.
For permits, property decisions, zoning, or legal boundaries, use current Fannin County records. These maps are intended for geographic reference, education, presentation graphics, and broad land-cover comparison. They can show where a closer investigation may be useful, but they cannot replace local planning records, field checks, or detailed site data.
Using the original JPG files
The page uses WebP images for efficient browser viewing. The download contains the four original JPG maps, each 2480×1754 pixels. They are convenient for reports, slides, project notes, and print layouts that benefit from a larger source image. The supplied asset information does not mark them as meeting an A3 300 dpi reference standard, so check the intended print size and sharpness before preparing a large-format print.
The ZIP includes the general land-cover map, forest-and-farmland map, impervious-surface map, and 1985–2025 land-cover change map. Keeping all four together is useful because the maps share the same county boundary while emphasizing different information. You can compare them without hunting for separate files or trying to recreate layers yourself.
Frequently Asked Questions
What is the large blue water body in the county?
It is Blue Ridge Reservoir on the Toccoa River. TVA identifies the reservoir as a Fannin County project in north Georgia. On the 2025 land-cover map it is part of the 1.32% water share and provides a useful landmark for comparing nearby forest and developed land.
Does 83.20% forest mean that 83.20% of Fannin County is public land?
No. The figure describes land cover, not ownership. Forest-colored cells can be on federal, state, local, or private property. Use a public-land or parcel dataset to determine ownership.
Can the impervious map show where future development is allowed?
No. It shows existing mapped hard surfaces such as pavement and rooftops. It does not show zoning, permits, buildable lots, or property rights. Those questions require current county planning and land records.
Sources and reference material
- MRLC Annual NLCD Data – annual land-cover data access
- USGS Annual NLCD Land Cover Classification – class definitions and interpretation
- Tennessee Valley Authority: Blue Ridge – reservoir and Toccoa River context
- UGA Extension Fannin County – Our Impact – local agriculture and natural-resource context
- Fannin County Georgia Government – county communities and local government reference
- U.S. Census Bureau TIGER/Line Shapefiles – county boundary data
Map File Information
The download includes the four original JPG maps for Fannin County in one ZIP archive.
- Included Versions: general land cover, forest and farmland, impervious surface, and 1985–2025 land cover change
- Printable Size: 2480×1754 pixels each
- File Type: ZIP containing four JPG images
Related Maps
- Appling County Georgia Land Cover Map
- Atkinson County Georgia Land Cover Map
- Bacon County Georgia Land Cover Map
Green Map creates custom-edited map images using open geographic data sources such as geoBoundaries, Natural Earth, OpenStreetMap, and government open data.
These maps are edited visual materials, not raw data files, and are provided for education, documents, presentations, and graphic reference.