Evans County, Georgia has a land-cover pattern that is easy to miss on a conventional road map. Wetlands and forest occupy broad parts of the county, farm fields are woven through them, and the strongest developed footprint is concentrated around Claxton. This page brings those patterns together in four views: 2025 land cover, forest and farmland, impervious surface, and mapped land-cover differences from 1985 to 2025.
All four original JPG maps are available in one download farther down the page. The set is useful for classroom work, presentations, county comparisons, environmental background research, and anyone who wants a clearer picture of where built land, working land, forest, and wet areas occur. The maps are designed for county-scale interpretation rather than parcel decisions.
Table of Contents
A county shaped by wetlands, woods, and working land
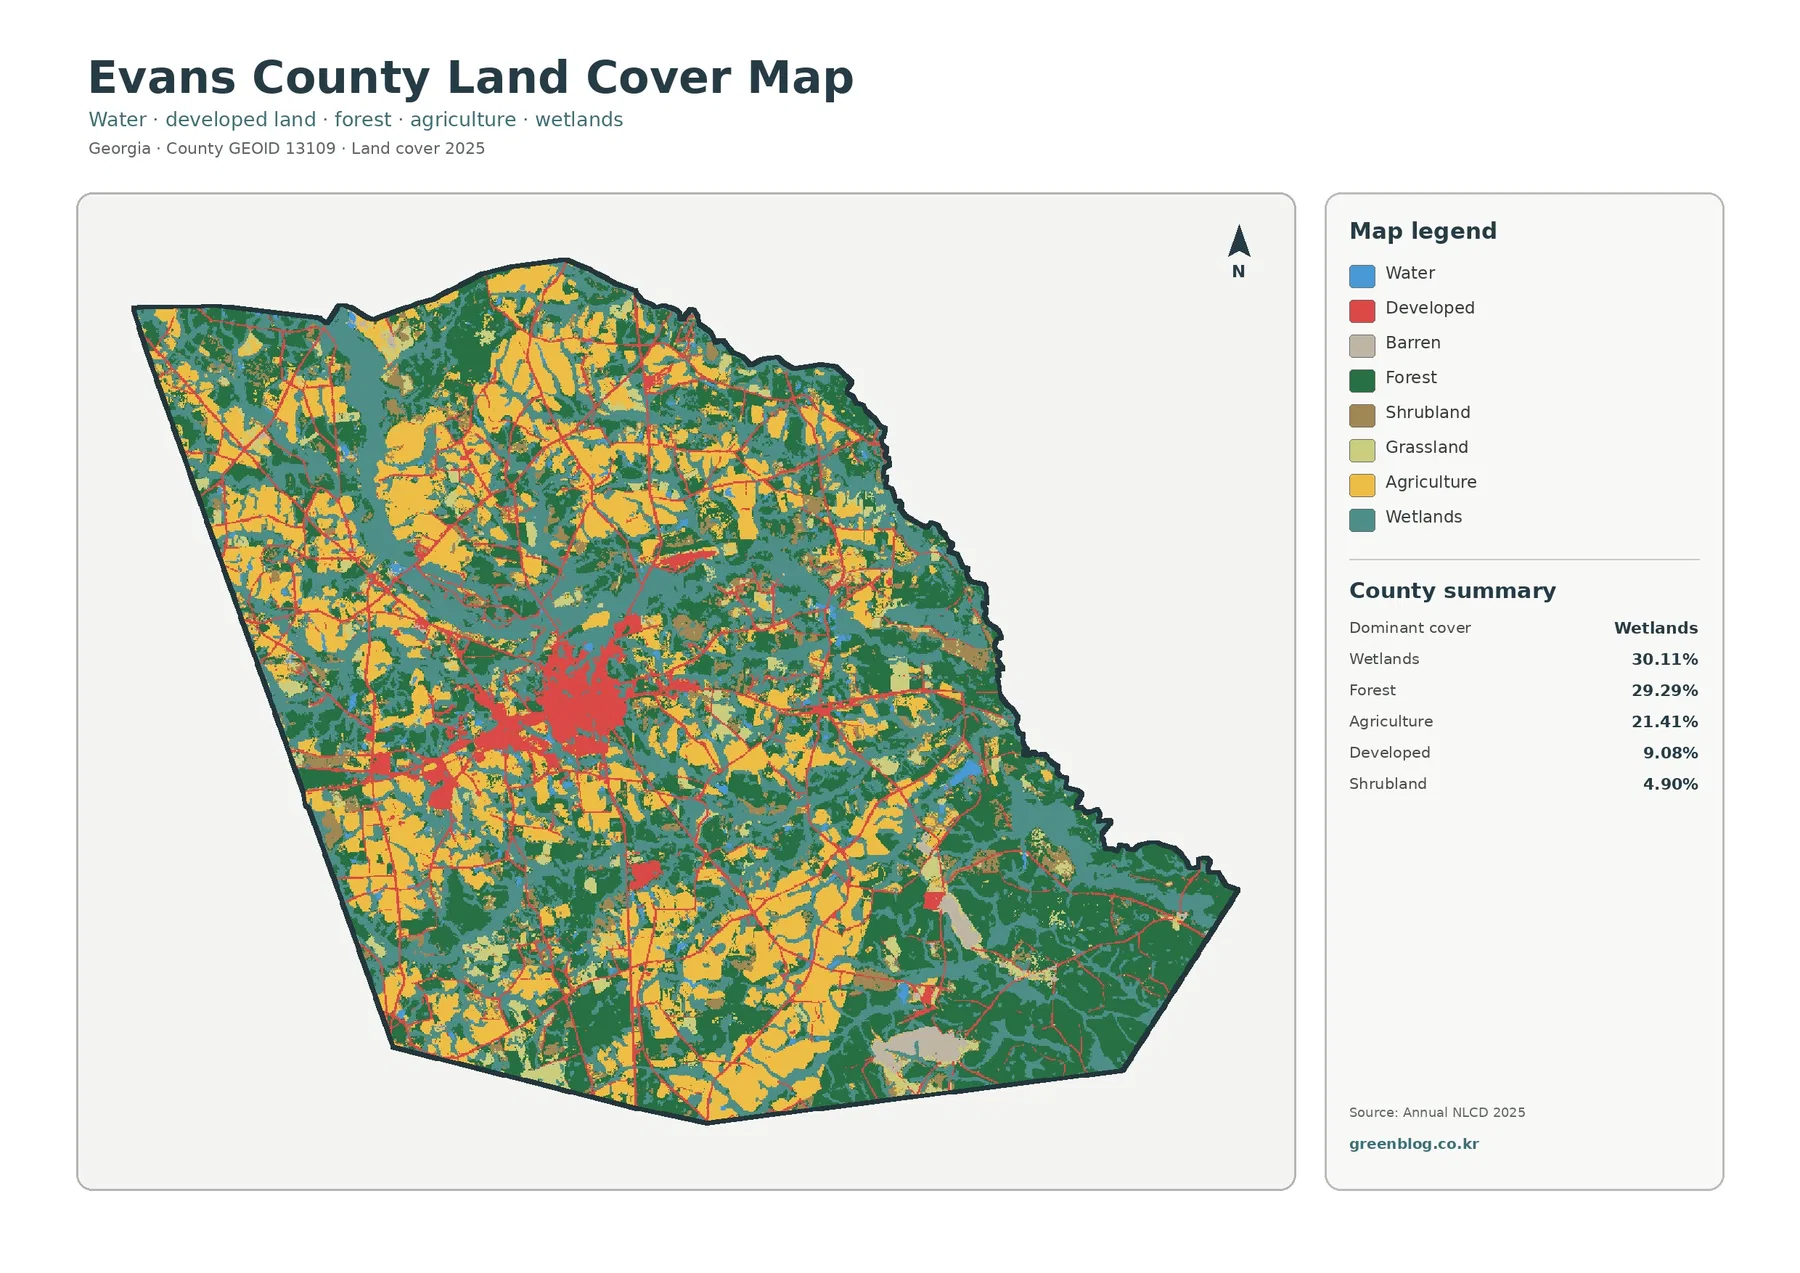
The 2025 summary does not show one land-cover class overwhelming every other category. Wetlands account for 30.11% of Evans County, while forest is close behind at 29.29%. Agriculture covers 21.41%, developed land 9.08%, and shrubland 4.90%. Taken together, the numbers describe a rural county where natural cover and agricultural land remain prominent even though a distinct built center is visible around Claxton.
That pattern also fits the county’s own description of southeastern Georgia. Evans County identifies agriculture as an important part of the local economy and mentions crops such as corn, cotton, and carrots, along with wheat and soybean fields. UGA Extension’s local program provides another useful point of reference: its 2025 work included research plots for cotton, peanuts, and tobacco. Those sources do not identify the crop in every mapped field, but they help explain why agricultural cover is an important part of the county landscape.
The 2025 land-cover map: the broadest view
The general map is the best starting point because it places water, developed land, barren ground, forest, shrubland, grassland, agriculture, and wetlands in one frame. Teal wetland areas and dark-green forest occupy much of the county. Yellow agricultural blocks appear repeatedly across the west, southwest, north, and interior, while red developed cover forms a much tighter cluster near Claxton and smaller traces along transportation routes.
Land cover should not be confused with zoning or legal land use. A satellite-based class describes what covers the ground—trees, crops, water, wetland vegetation, developed surfaces, and similar categories. It does not tell you who owns a property, whether a parcel can be developed, or what zoning code applies. For those questions, parcel records and local planning documents are the appropriate sources.
Where forest and farmland meet
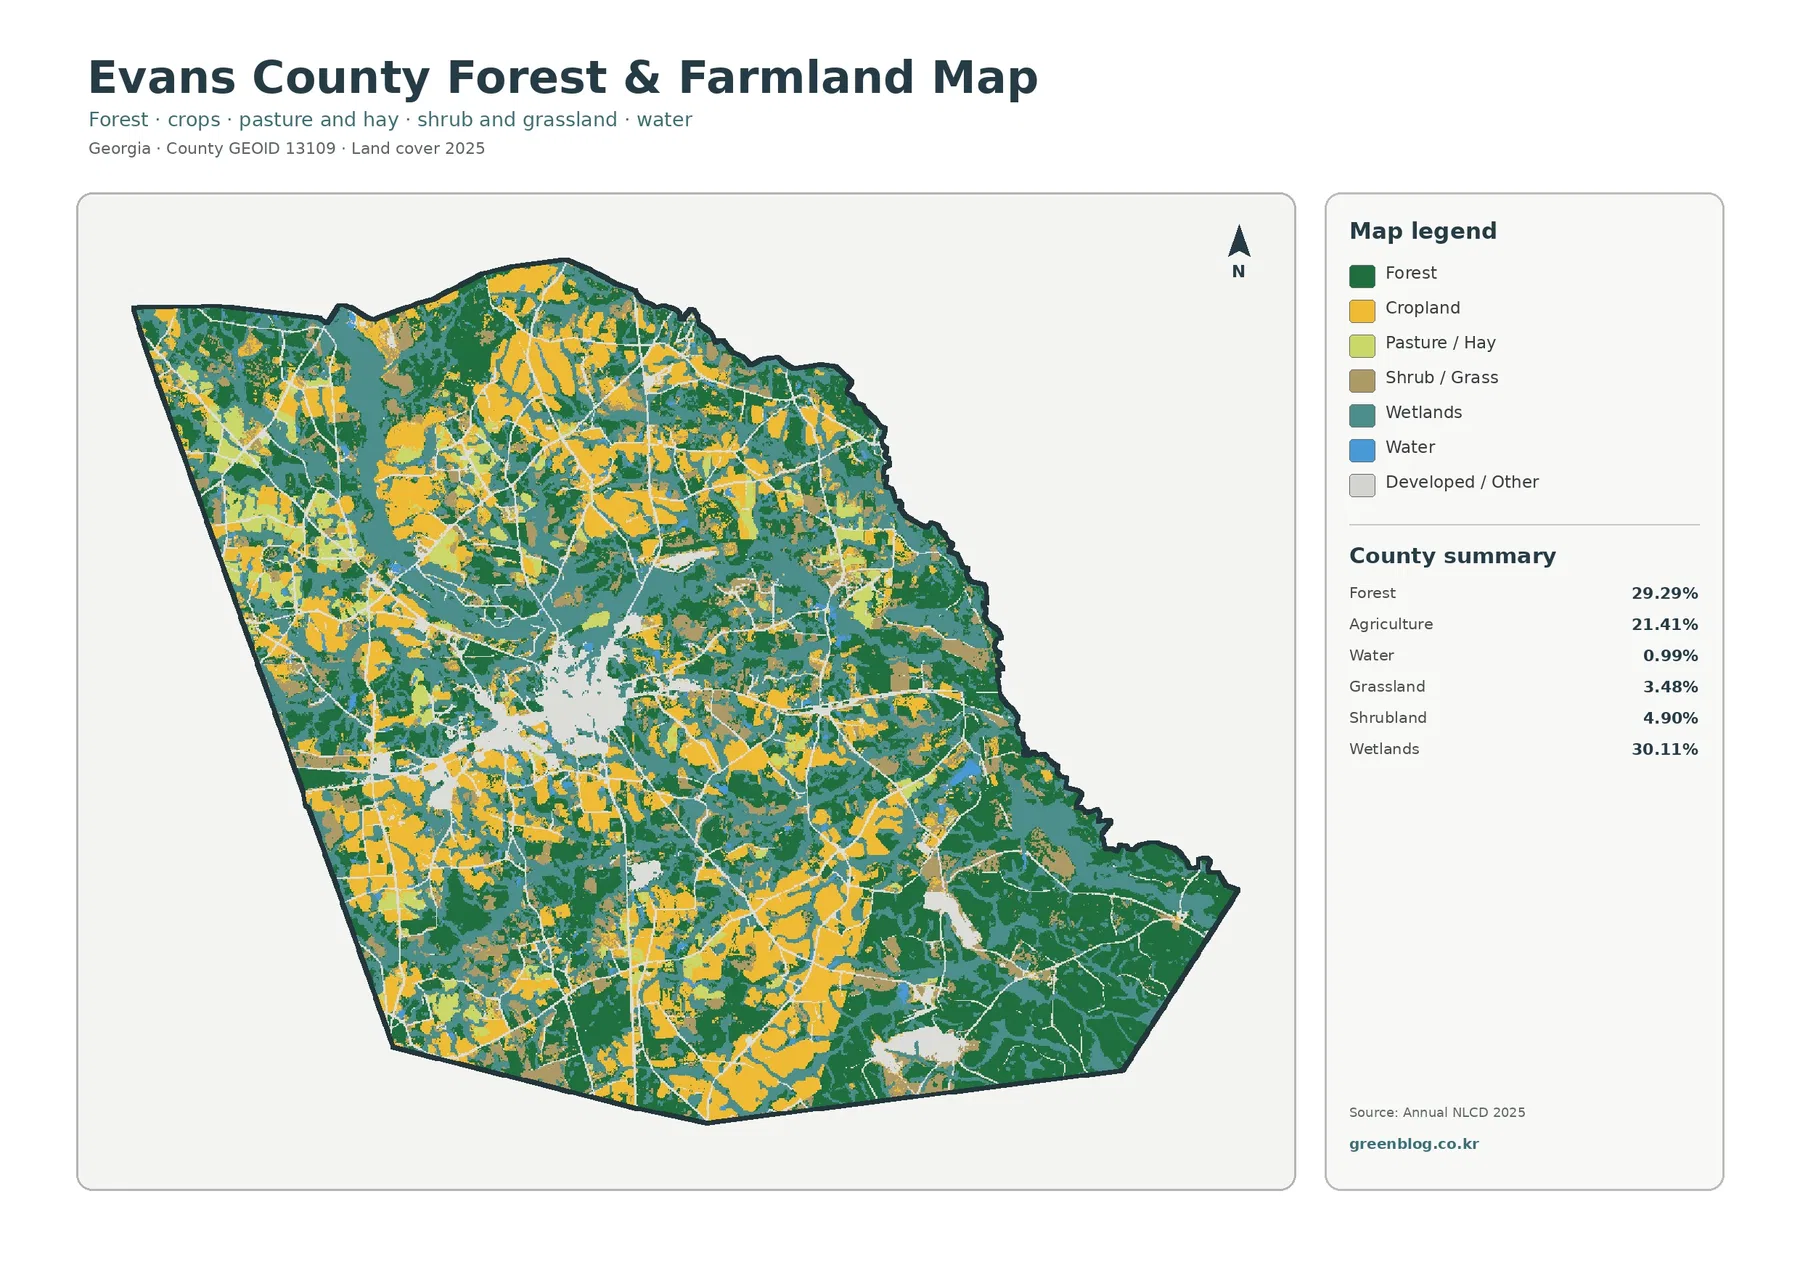
The forest-and-farmland map removes much of the visual competition from the full legend and makes the rural pattern easier to compare. Forest represents 29.29% of the county and agriculture 21.41%. Wetlands, at 30.11%, remain important in this view because many wooded and agricultural areas are separated or bordered by wet ground. Grassland accounts for 3.48%, shrubland 4.90%, and mapped water 0.99%.
Large farm blocks are particularly noticeable in parts of the west and southwest, with additional agricultural areas spread through the north. Forest is more continuous in several eastern and southeastern sections. The map does not distinguish cotton from peanuts, corn, tobacco, or other individual crops. Its value is broader: it shows where agricultural cover is concentrated and how those areas sit beside forest, wetland, grass, shrub, water, and developed or other cover.
Claxton stands out on the impervious-surface map
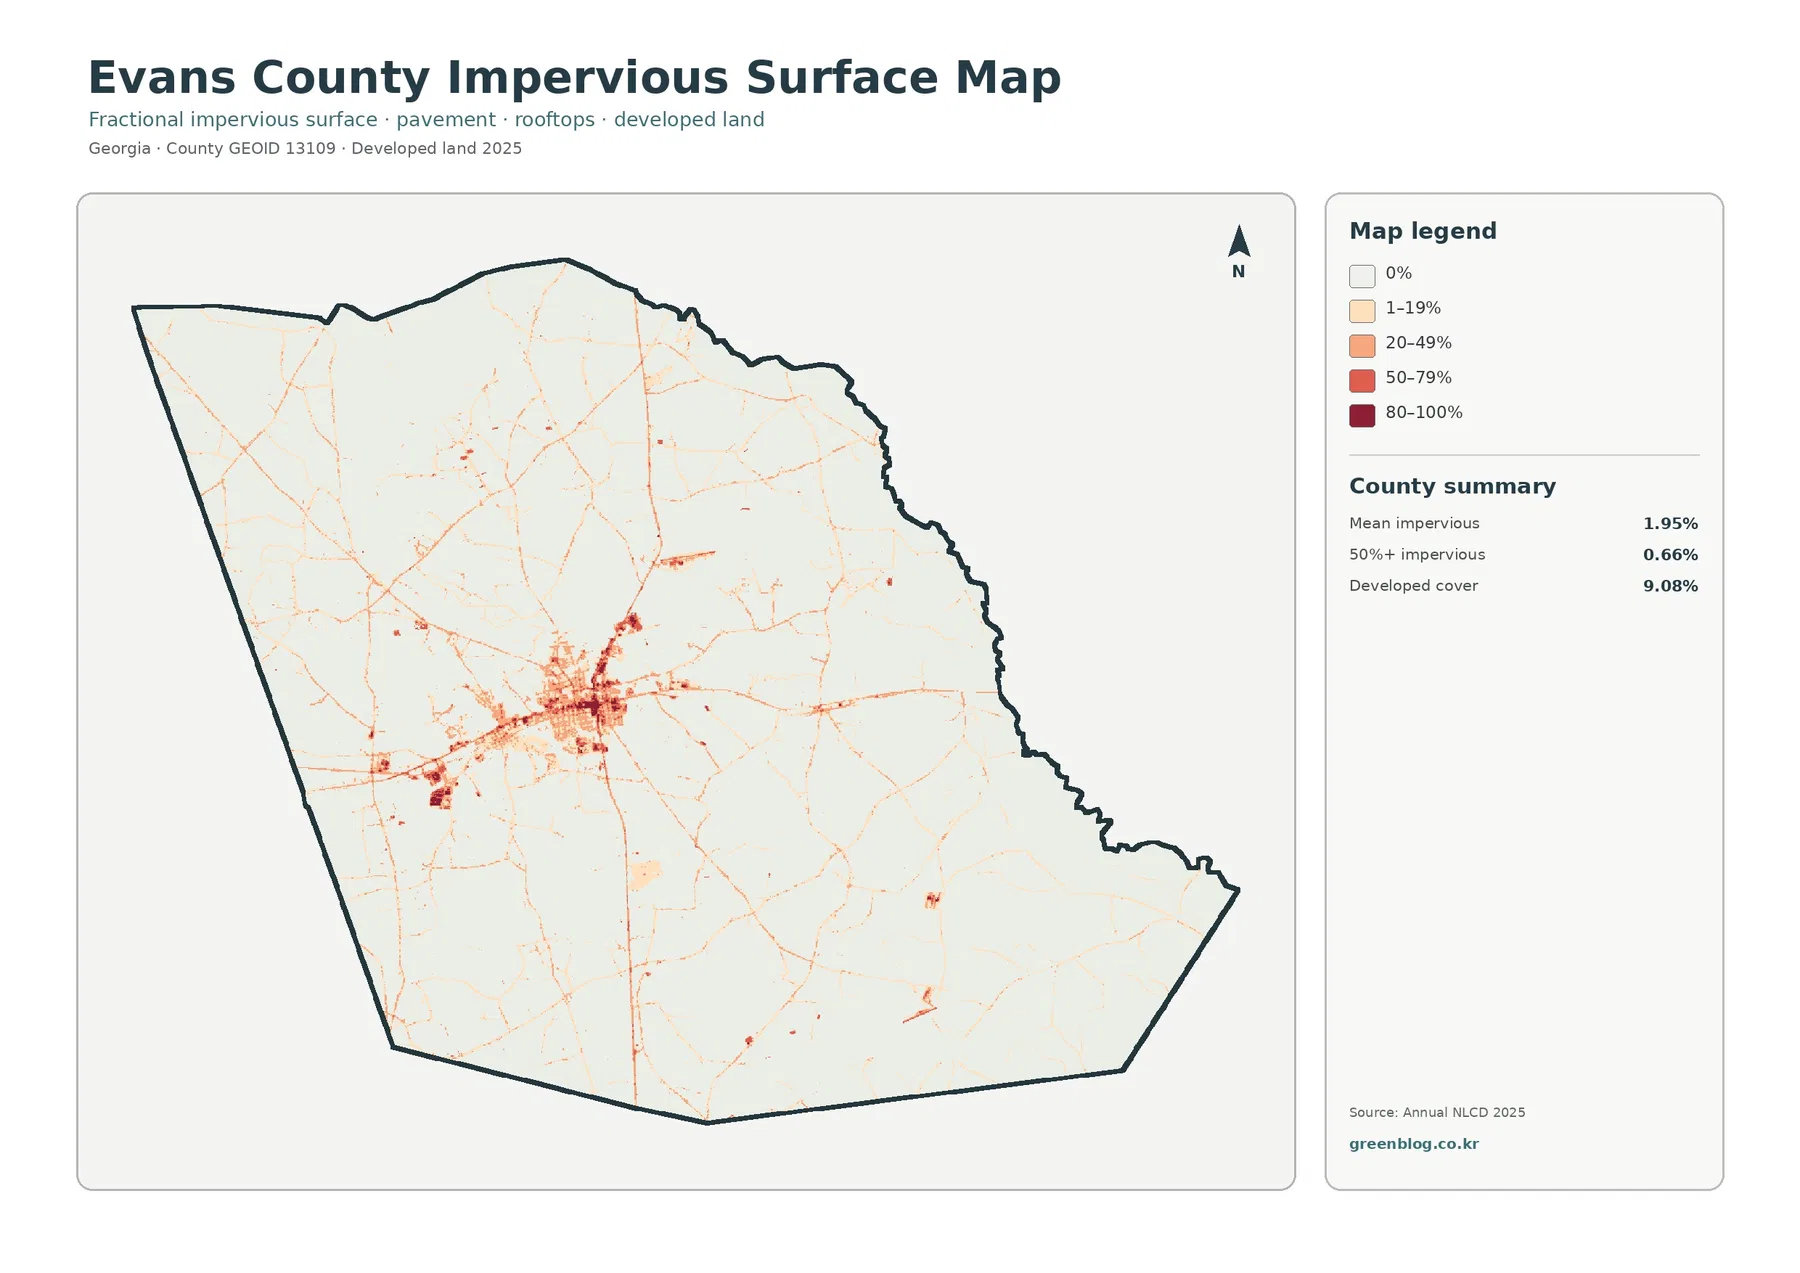
The impervious-surface view produces the strongest urban-rural contrast in the set. Impervious surface means pavement, rooftops, parking areas, and other surfaces that do not readily absorb rainfall. Most of Evans County is very light on this map. Claxton forms the densest cluster, while thin lines and smaller patches extend outward along roads and scattered developed locations.
The county summary reports 1.95% mean imperviousness, and only 0.66% of the area is mapped at 50% impervious or greater. Those figures are much lower than the 9.08% developed-cover share on the general land-cover map because the measures are not equivalent. A developed land-cover class can include lawns, vegetation, and low-density surroundings associated with homes or other built uses. Imperviousness focuses more narrowly on the hard surface within a cell.
Wetlands and the Canoochee River context
Wetlands are the largest 2025 class in the county summary, so they deserve more than a passing mention. Evans County’s comprehensive planning documents identify wetlands, floodplains, groundwater recharge areas, and the Canoochee River as significant natural resources. The U.S. Geological Survey also maintains a Canoochee River monitoring location near Claxton. That local context helps explain why the wetland colors visible across the land-cover map matter at the county scale.
What changed between 1985 and 2025
The change map compares classified land cover in 1985 with the 2025 result. In the county summary, 23.53% is marked as a class difference. The categories include 2.13% classified to developed, 5.39% forest loss, 6.95% agricultural loss, and 7.83% other difference. Colored cells are scattered through much of the county rather than forming one single band of change.
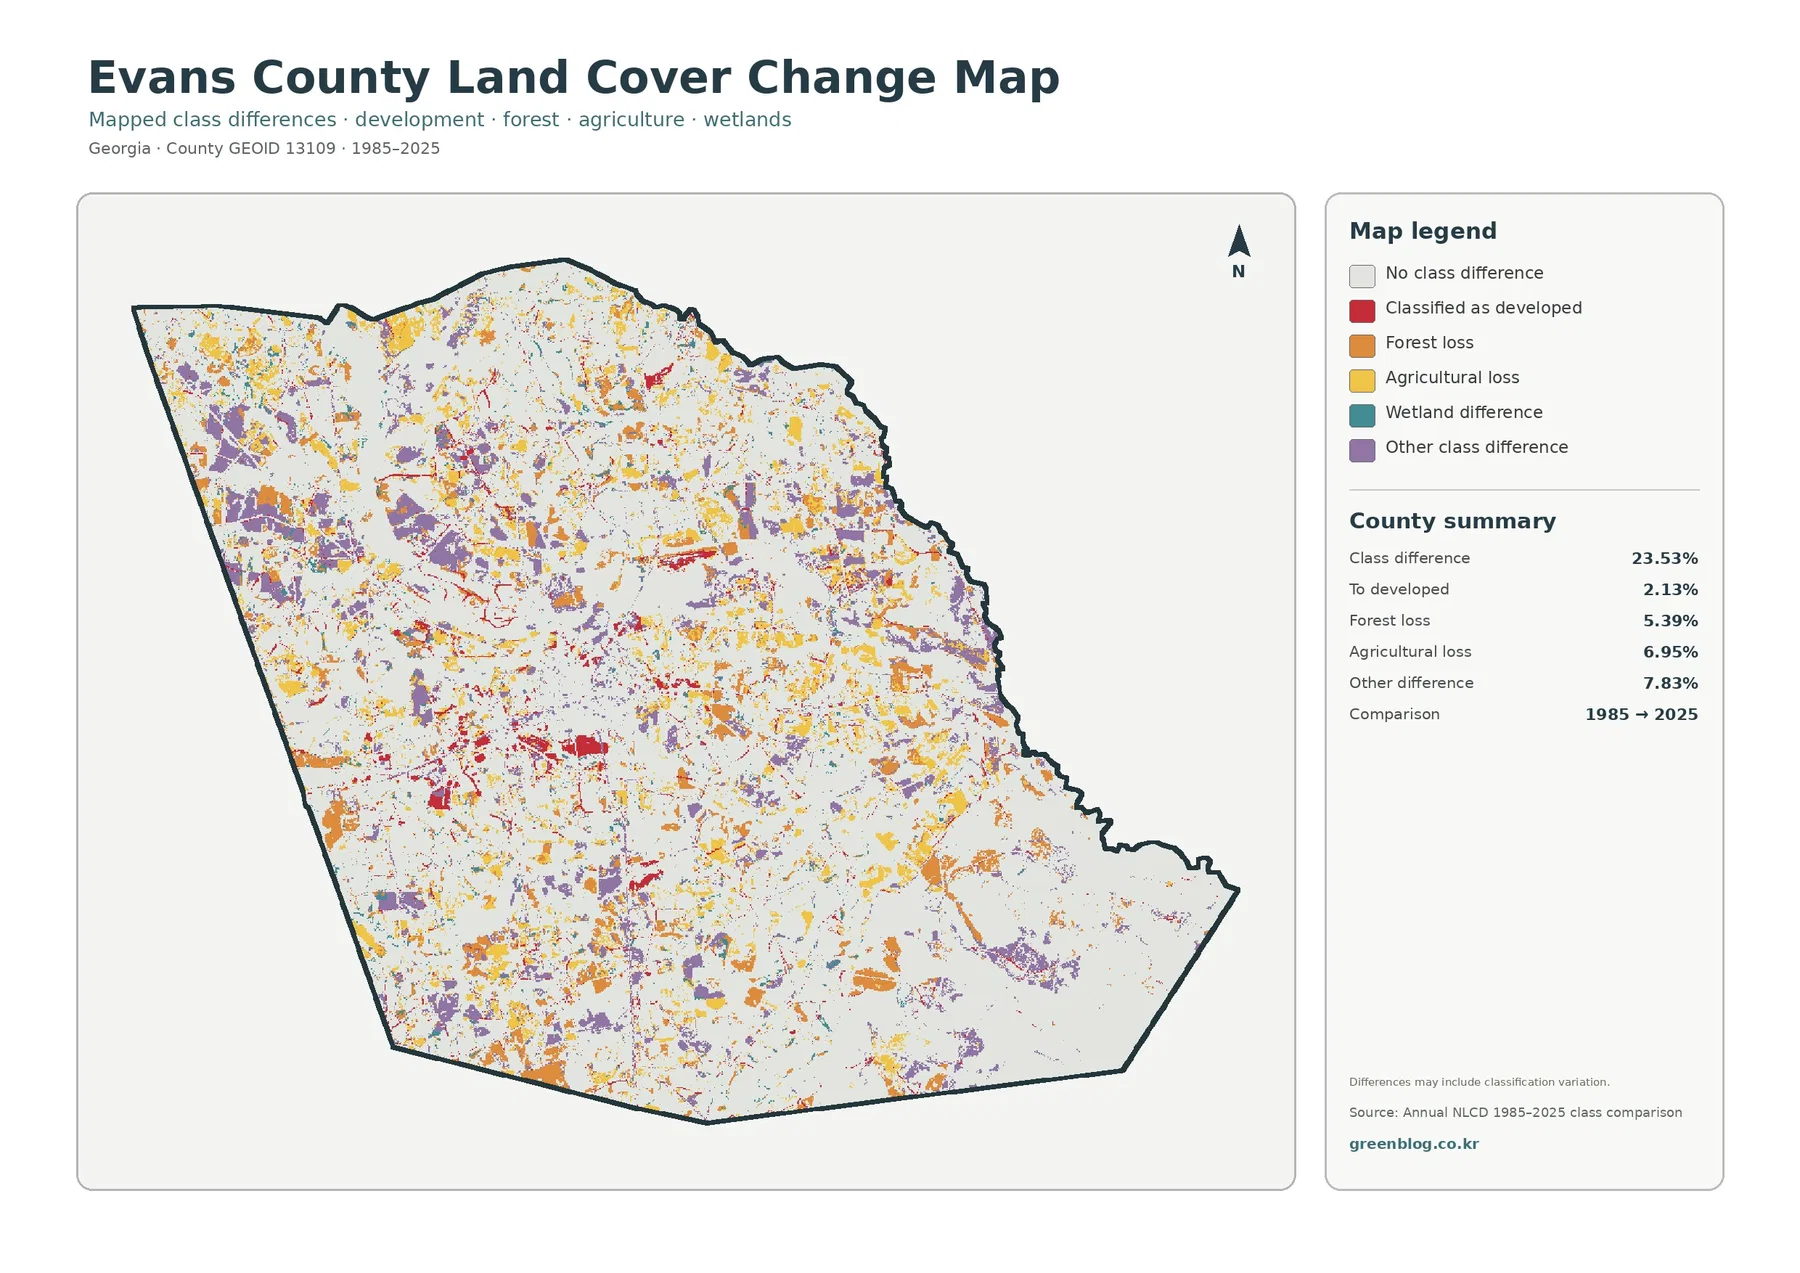
A colored cell is not proof of a particular event. The map itself notes that differences may include classification variation. A cell near a forest edge, for example, may be assigned to a different class in two years because the land truly changed, because mixed cover occupies the cell, or because imagery and classification conditions differed. Broad, repeated patterns are more reliable for an initial review than an isolated pixel.
How to use the four maps together
Start with the general land-cover map when you need a quick county overview. It answers the most basic question: where are wetlands, forest, agriculture, and developed land relative to one another? Move to the forest-and-farmland map when the goal is to make the rural landscape easier to explain. That simplified view is especially useful in agriculture, natural-resources, and environmental-education material.
Use the impervious map when the concentration of roofs, pavement, and built surfaces matters more than the broader developed class. The Claxton cluster becomes much easier to see there. The change map belongs at the end of the comparison because it introduces a time dimension. Once the 2025 pattern is familiar, the 1985–2025 differences are easier to interpret without mistaking every colored patch for the same kind of change.
Resolution, mixed pixels, and date limits
Annual NLCD products are designed for broad land-cover analysis rather than parcel surveying. The raster classification is generalized on a grid, so narrow roads, small structures, thin stream channels, field edges, and small wetland features may be simplified. A grid cell can also contain more than one real-world surface. That is a mixed pixel, and it is one reason a map boundary may not match what a person sees on the ground.
Frequently Asked Questions
What is the largest land-cover class in Evans County?
Wetlands are the largest class in the 2025 summary at 30.11%, with forest very close behind at 29.29%. Agriculture accounts for 21.41%. The county is therefore better understood as a mixed wetland, forest, and agricultural landscape than as a place dominated by only one cover type.
Why is developed cover 9.08% while mean imperviousness is only 1.95%?
They measure different things. Developed land cover can include low-density built areas with lawns and other vegetation, while imperviousness measures the share of hard surfaces such as pavement and roofs within a cell. A county can therefore have a noticeably larger developed-cover percentage than its average impervious percentage.
Does every colored area on the 1985–2025 map represent a confirmed real-world change?
No. Some colored areas can represent genuine development, forest loss, agricultural change, or another shift, but classification differences can also contribute. For a specific site, compare the map with historical aerial imagery, other Annual NLCD years, or local records before assigning a cause.
Sources and reference material
Land-cover classes and data availability can be checked through MRLC Annual NLCD Data and the USGS Annual NLCD Land Cover Classification page.
County background and agricultural context are available from the official Evans County website and UGA Extension Evans County Agriculture & Natural Resources.
For local planning and natural-resource context, see the Georgia Department of Community Affairs Evans County Comprehensive Plan page.
Map File Information
The four original Evans County land-cover JPG maps are packaged together in one ZIP file.
- Included Files: general land cover, forest and farmland, impervious surface/developed land, and 1985–2025 land-cover change maps
- Intended Use: classes, presentations, county comparisons, and environmental or agricultural reference
Related Maps
- Appling County Georgia Land Cover Map
- Atkinson County Georgia Land Cover Map
- Bacon County Georgia Land Cover Map
Green Map creates custom-edited map images using open geographic data sources such as geoBoundaries, Natural Earth, OpenStreetMap, and government open data.
These maps are edited visual materials, not raw data files, and are provided for education, documents, presentations, and graphic reference.