Agriculture is the largest 2025 land-cover class in Colquitt County, but the county does not read as one continuous field landscape. This Colquitt County Georgia Land Cover Map shows broad farm blocks broken by forest and wetland corridors, with the strongest developed concentration around Moultrie near the middle of the county.
The page includes four views: 2025 land cover, forest and farmland, impervious surface and developed land, and a 1985–2025 class comparison. The four original JPG maps are available together in one ZIP. Each JPG is 2480 × 1754 pixels, so the set can be kept as a reference or placed in lessons, county profiles, presentations, and comparison documents.
Table of Contents
A farm-dominant county divided by forest and wet ground
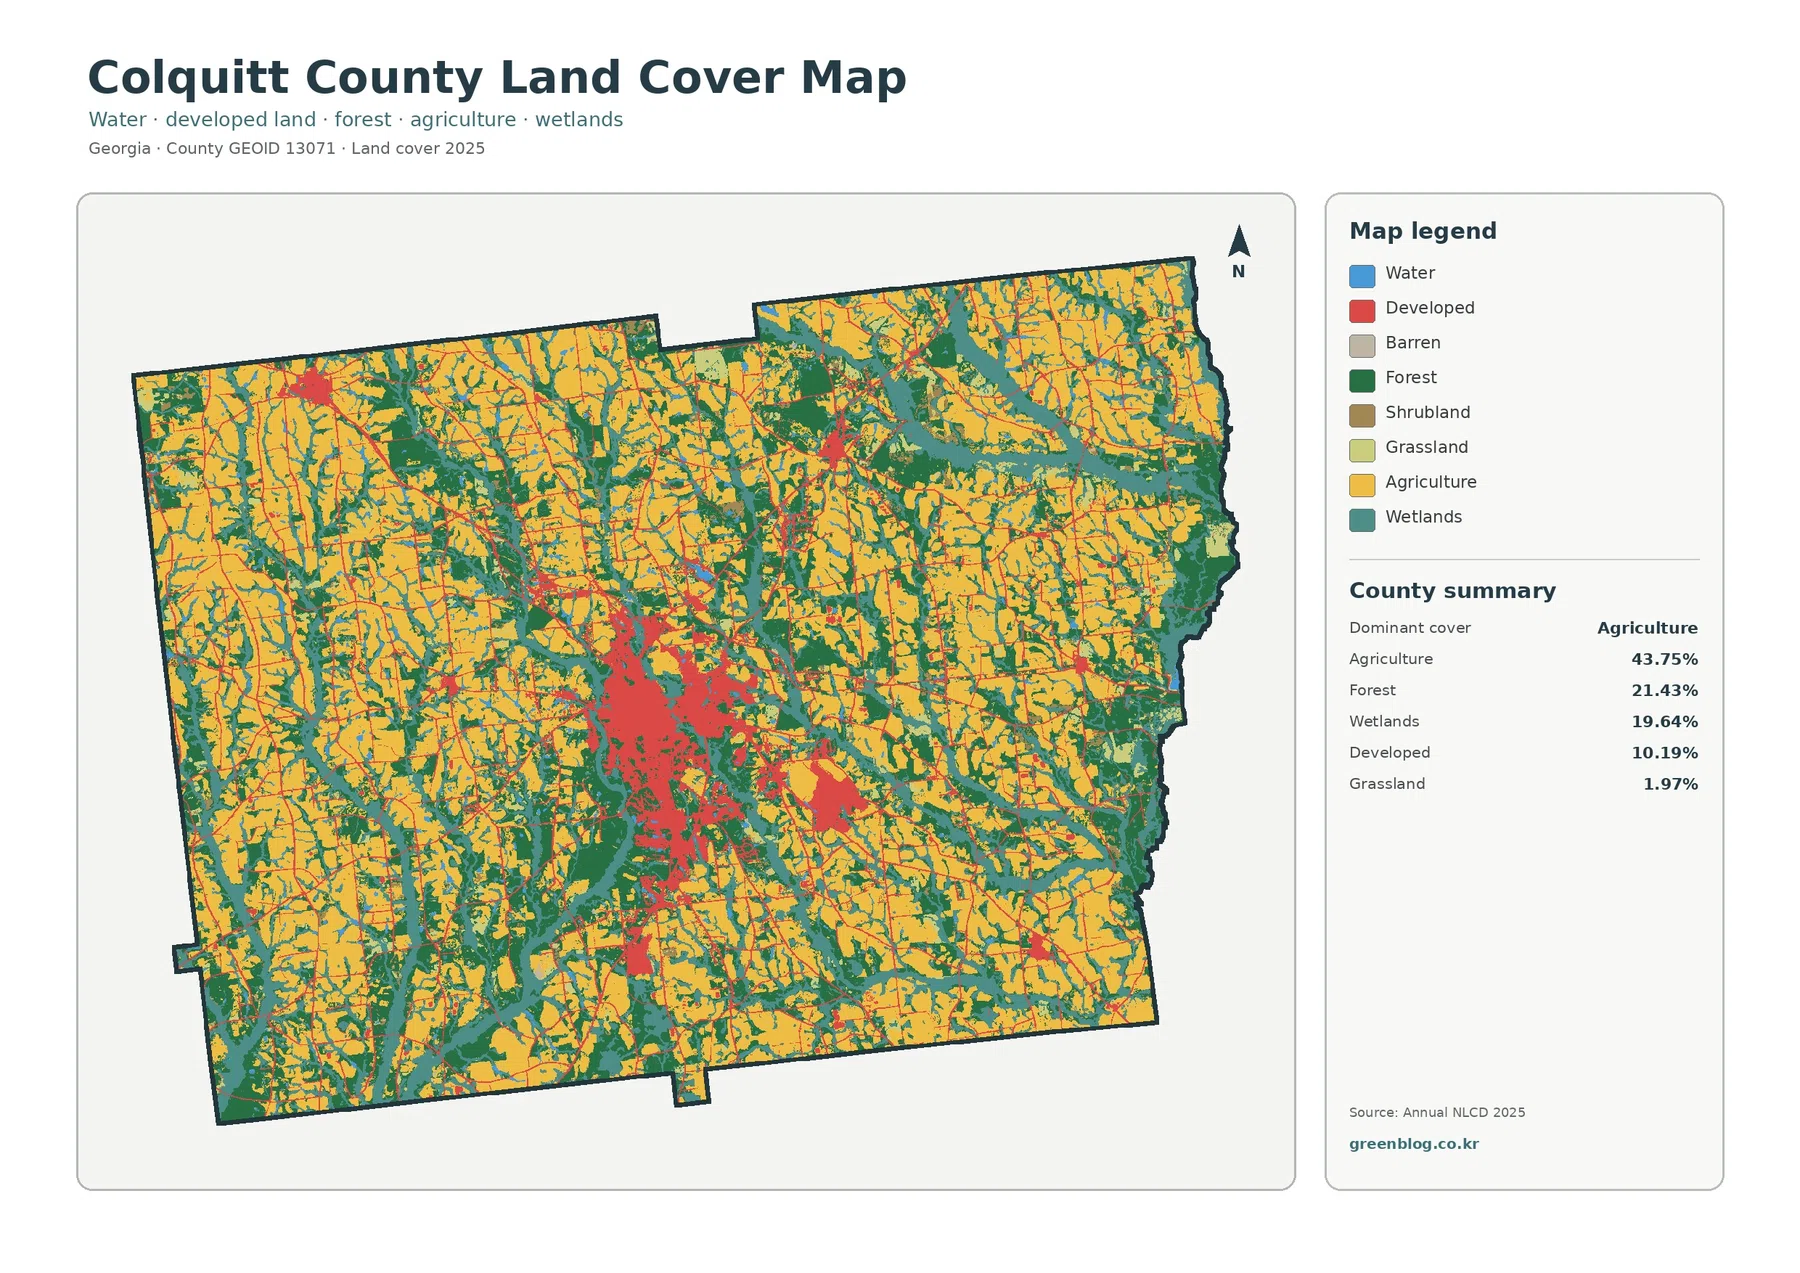
Agriculture accounts for 43.75% of the 2025 summary, making it the clear leading class. Forest covers 21.43%, wetlands 19.64%, developed land 10.19%, and grassland 1.97%. The forest-and-farmland view also lists water at 1.41% and shrubland at 1.56%. Those percentages describe the countywide balance, while the image explains how the classes are actually arranged.
Yellow agricultural areas extend through nearly every part of the county, yet they are repeatedly interrupted by dark green forest and teal wetlands. Some wetland bands are narrow and winding, while others widen into larger patches. Forest appears in both compact blocks and thinner connections between farm areas. This makes the county look more like a mosaic of working land and natural cover than a single uninterrupted agricultural plain.
The largest red developed cluster sits near the county center, matching the Moultrie area. Smaller developed spots occur elsewhere, but they do not approach the size or density of the central concentration. The contrast is important: Colquitt County has a visible urban and service center, yet most of its mapped surface remains agricultural, forested, wet, or otherwise open rather than continuously built.
Land cover should not be confused with zoning or legal land use. Annual NLCD classifies what the ground surface appears to be covered by, such as crops, trees, wet vegetation, water, or developed surfaces. A yellow cell does not identify a particular crop or property owner, and a red cell does not define a municipal boundary. Parcel decisions, permits, ownership, and zoning require separate local records.
Why the agricultural share needs a closer map
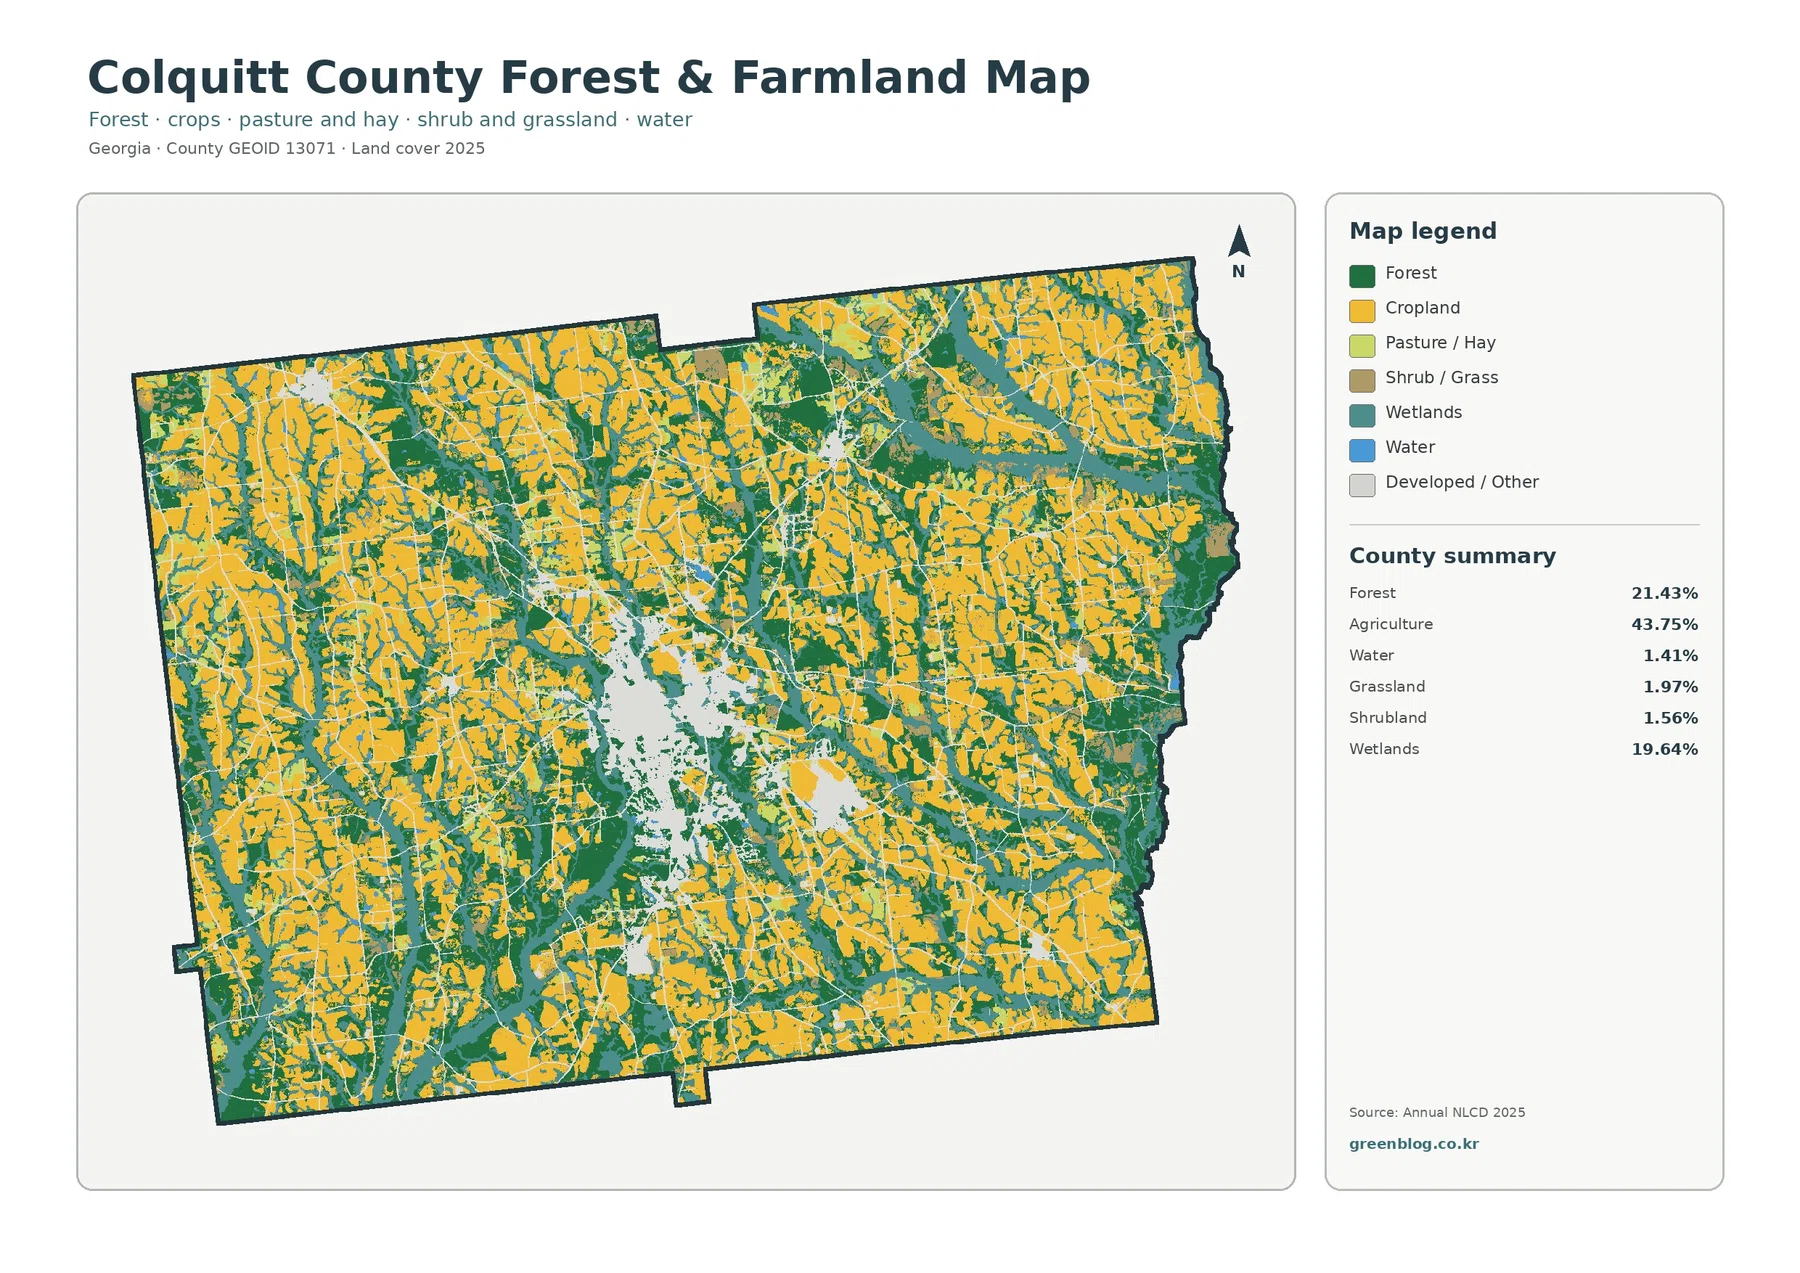
The specialized forest-and-farmland image makes the 43.75% agricultural share easier to interpret. Large yellow blocks appear across the west, north, east, and south, but green and teal areas continue between them. Forest is not limited to one corner of the county, and wetlands are not confined to a single basin. Both classes recur across the agricultural landscape and create many short transitions from fields to woods or wet ground.
Wetlands cover 19.64%, far more than the 1.41% mapped as open water. The difference matters because wetlands do not mean the same thing as lakes or open channels. Wetland classes can include vegetation and soils strongly influenced by water even where no broad open-water surface is visible. In Colquitt County, the teal pattern follows numerous narrow and branching areas, so water-related environments occupy a much larger role than the open-water percentage alone would suggest.
Local agricultural sources reinforce why the farm pattern deserves attention. UGA Cooperative Extension lists Agriculture & Natural Resources as a main Colquitt County program area, and its county agriculture reports regularly cover crops including corn, cotton, peanuts, and forages. Those sources provide local farming context, but the land-cover map does not distinguish those crops from one another. The yellow class should therefore be read as broad agricultural cover rather than a crop inventory.
This view is useful when a project needs to discuss the relationship between working land and natural cover rather than the exact location of one farm. A county profile can show that agriculture leads the total while forest and wetlands together account for more than 40% of the mapped surface. A classroom exercise can compare the edges between yellow, green, and teal areas. Neither use requires treating the map as a parcel survey.
Hard surfaces collect around Moultrie instead of covering the county
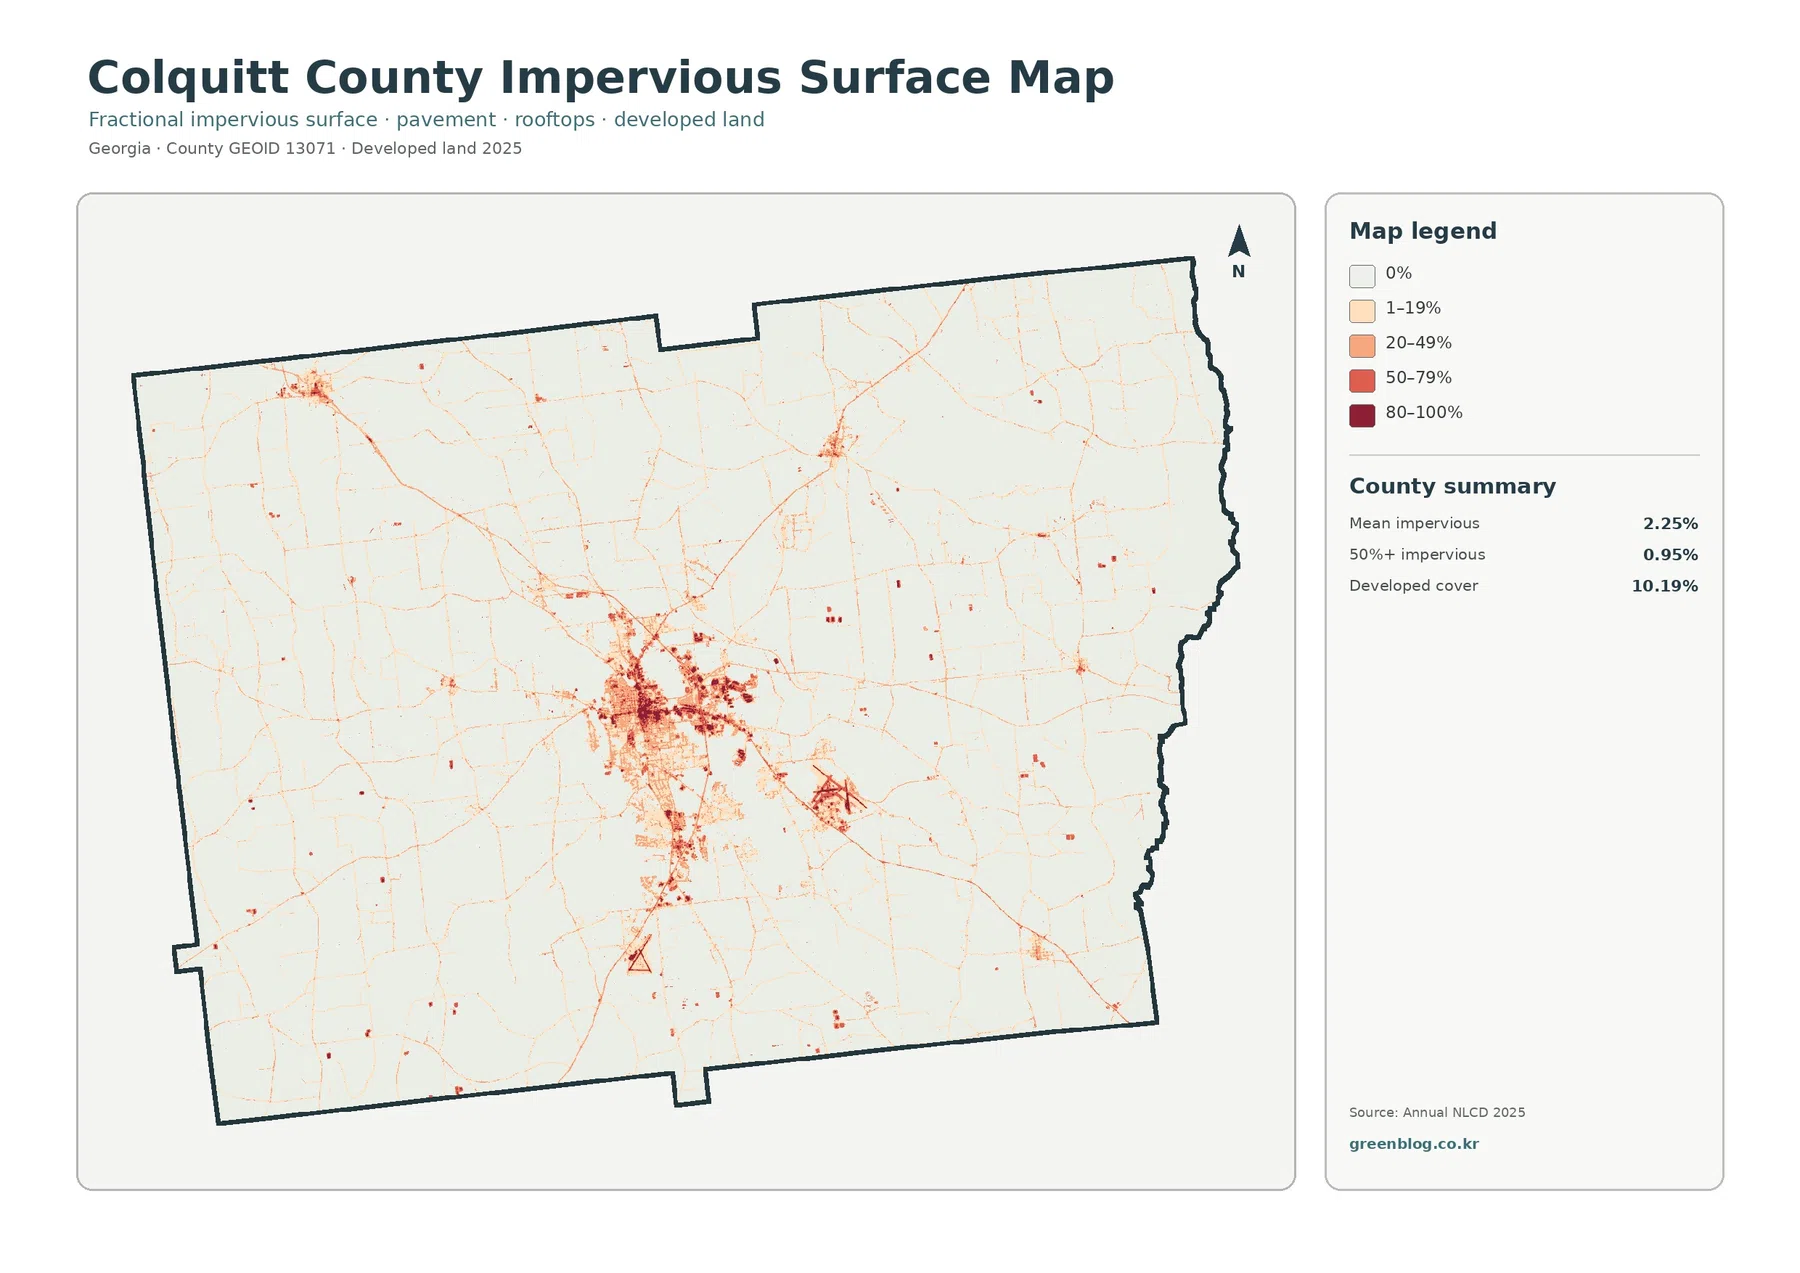
Impervious surface means pavement, rooftops, parking areas, and similar materials that water does not readily soak through. Colquitt County has a mean impervious value of 2.25%, while only 0.95% of the county falls in cells that are at least 50% impervious. Developed land, by contrast, is 10.19%. These figures differ because a developed land-cover class can include lawns, trees, bare soil, and other permeable surfaces around buildings and roads.
The darkest impervious values form a clear central concentration around Moultrie. Thin lines extend outward from that area, and smaller clusters appear in a few outlying locations. Most of the county remains very pale on this map. The pattern fits a county with one dominant built center and a much larger rural background rather than a continuous metropolitan surface.
The impervious image is especially helpful when developed cover seems larger than expected. The 10.19% developed class tells how much area received a developed land-cover label, but the 2.25% mean impervious value shows that truly hard surfaces occupy a much smaller share. Using both figures together prevents the common mistake of treating every developed cell as if it were entirely paved or built over.
The lines and clusters should still be treated as generalized map patterns. Road names and city boundaries are not labeled, so a narrow band cannot be assigned to a specific highway from this image alone. Moultrie is the most obvious central context, but exact municipal limits, transportation corridors, and planning boundaries should be checked against official local maps.
The 1985–2025 comparison records several kinds of difference
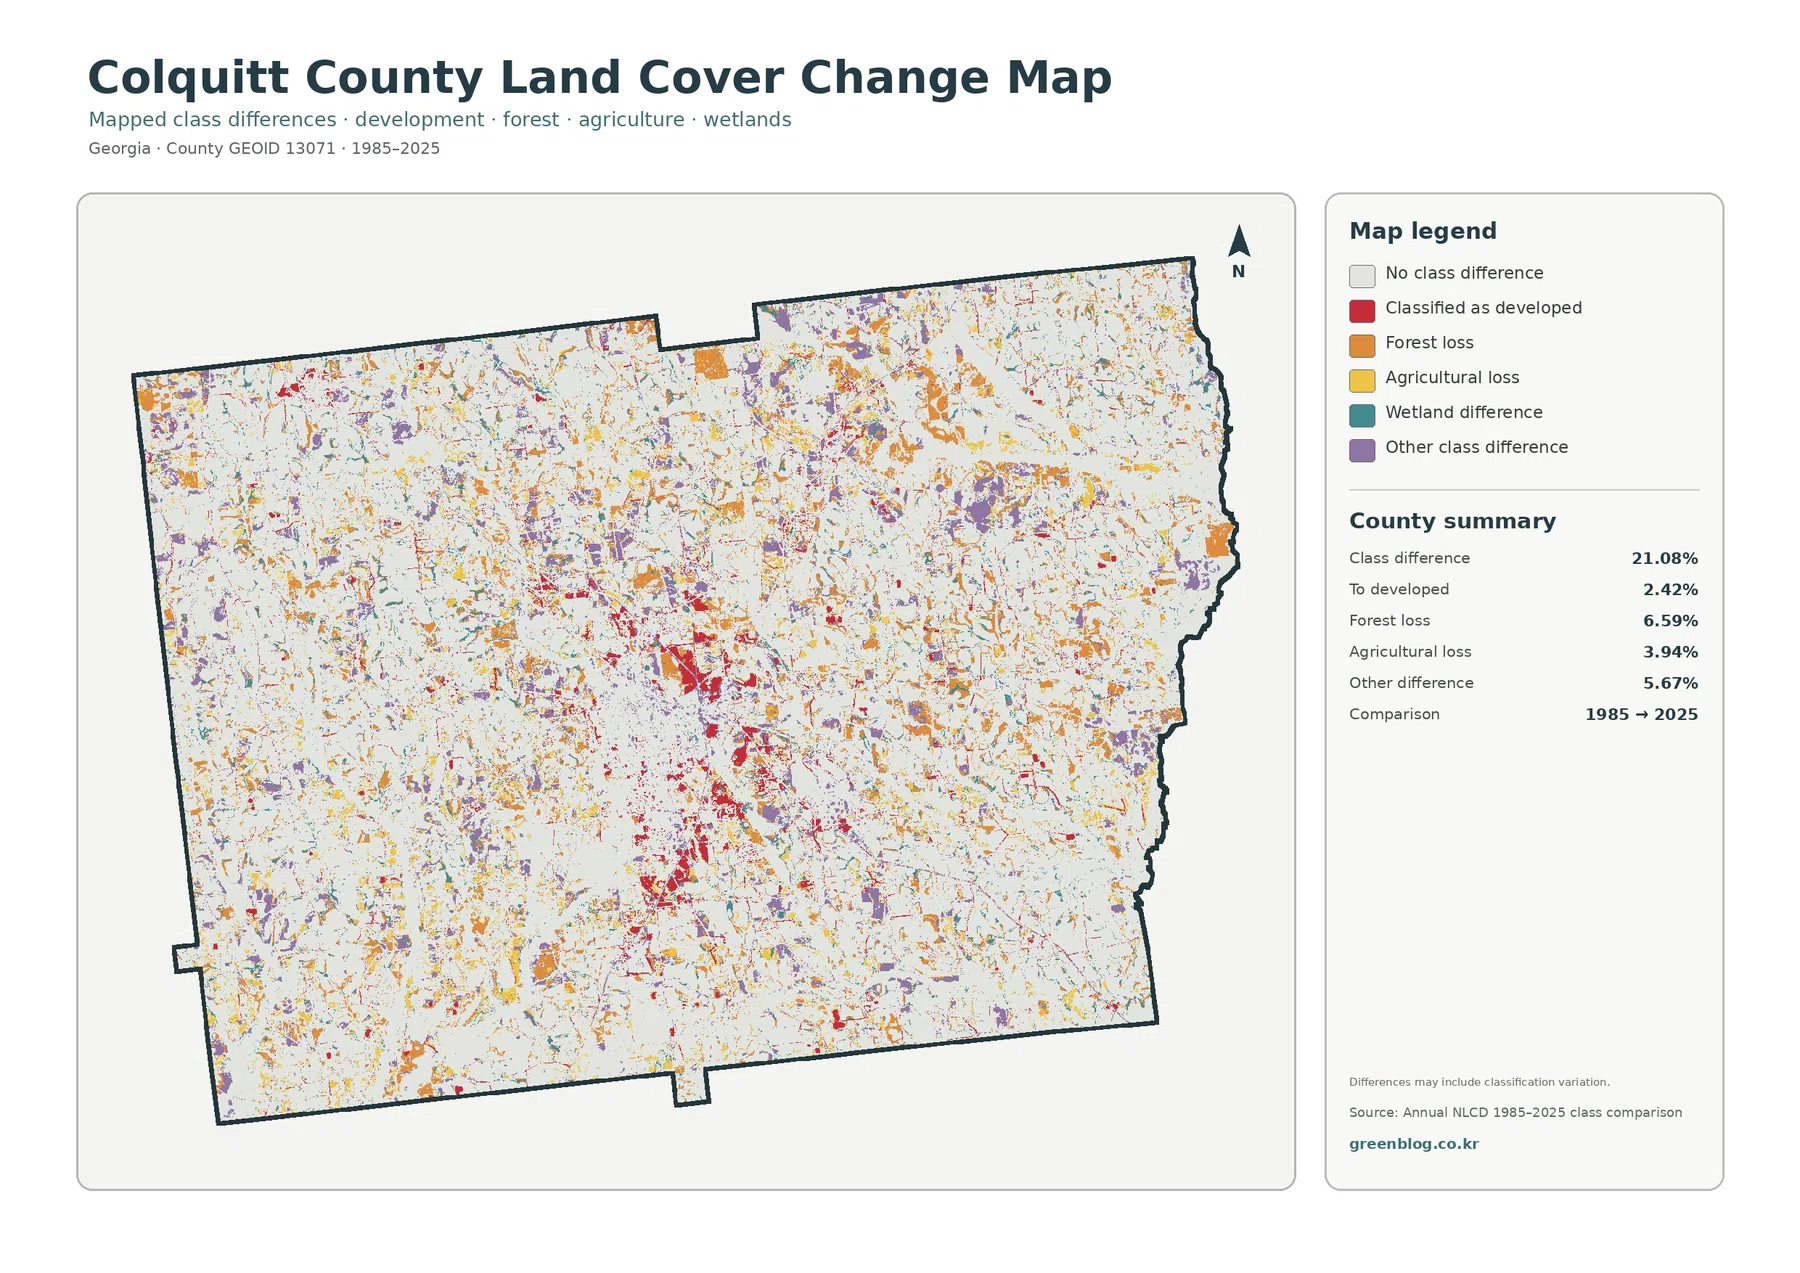
The 1985–2025 map reports a class difference across 21.08% of the county. Cells classified as developed at the 2025 endpoint after another class in 1985 account for 2.42%. Forest loss is 6.59%, agricultural loss 3.94%, and other class difference 5.67%. White areas retained the same broad class at both endpoints, while colored cells represent one of the listed differences.
Red developed-change cells are noticeable around the central built area, but they are only one part of the countywide comparison. Orange forest-loss cells and other difference colors are scattered much more widely. This is why the 21.08% total should not be described as the share of Colquitt County that urbanized. The map records multiple kinds of classification difference, not one development process.
The comparison also does not identify when a change happened during the forty-year span. A cell could have changed more than once between 1985 and 2025, and the endpoint map would still show only the difference between the two selected years. Harvest, regrowth, agricultural conversion, wetness conditions, new construction, and classification variation may all contribute to the pattern. Intermediate-year imagery and local records are needed to establish timing or cause.
Forest loss is particularly easy to overstate. The 6.59% category means that a cell mapped as forest in 1985 received another class in 2025. It does not prove permanent clearing throughout the entire period, and it does not tell whether the area changed once or several times. The same caution applies to the 3.94% agricultural-loss category. These are endpoint class comparisons, not a complete land-use history.
A practical way to use the four maps together
For a general county profile, begin with the 2025 land-cover map because it establishes the main balance: agriculture first, substantial forest and wetlands, and a concentrated developed center. Use the forest-and-farmland map next when the relationship between fields and natural cover matters. Bring in the impervious map when the question is specifically about pavement, rooftops, or the intensity of built surfaces. Reserve the change map for a separate discussion of endpoint differences.
That sequence also helps explain why one percentage rarely tells the whole story. Agriculture is 43.75%, but the specialized map shows that fields are divided by wetland and forest areas. Developed cover is 10.19%, but impervious surface averages only 2.25% and is concentrated around Moultrie. The class-difference total is 21.08%, but developed conversion is only 2.42%. Each map answers a narrower question that makes the other figures easier to interpret.
Annual NLCD is a raster product built from square cells. The working resolution is generalized enough that a single cell can contain crops, a ditch, trees, pavement, and a building while receiving one predominant class. Enlarging the image makes those cells larger but cannot recover parcel boundaries or site details that were never present. The maps are therefore best used for county-scale patterns rather than property-level decisions.
The supplied maps represent the 2025 observation year and a 1985–2025 endpoint comparison. Later construction, harvest, vegetation recovery, storm effects, or changes in surface water may not appear. For zoning, development approval, wetland jurisdiction, ownership, road projects, or other current decisions, use the newest information from the relevant agency. Moultrie and Colquitt County planning pages provide a separate planning context that should not be substituted with land-cover classification.
Original JPG files in the download
The ZIP contains four original JPG files: the 2025 land-cover map, forest and farmland map, impervious surface and developed land map, and 1985–2025 land-cover change map. Each image is 2480 × 1754 pixels. The package does not mark the files as meeting an A3 high-resolution reference, so test large-format printing before relying on them for a poster.
Keep the legend and year visible when placing the images in a report or slide deck. The countywide map works well as an overview, while the other three are better for focused comparisons. The original JPG set is useful when a document needs the map as a standalone image rather than the smaller WebP preview shown in the article.
Frequently Asked Questions
What is the largest 2025 land-cover class in Colquitt County?
Agriculture is the largest class at 43.75%. Forest follows at 21.43% and wetlands at 19.64%. The map is therefore strongly agricultural, but fields are repeatedly interrupted by woods and wet areas rather than forming one unbroken block.
Why is developed cover 10.19% when mean impervious cover is only 2.25%?
Developed land-cover classes can include permeable surfaces such as lawns, trees, and bare ground around buildings and roads. Impervious cover isolates hard surfaces such as rooftops, pavement, and parking areas, so the countywide mean is much lower.
Does the 21.08% class difference mean that one-fifth of the county was developed?
No. Only 2.42% is categorized as conversion to developed at the 2025 endpoint. The total also includes 6.59% forest loss, 3.94% agricultural loss, wetland differences, and 5.67% other class difference, along with possible classification variation.
Sources and Reference Data
- MRLC Annual NLCD Data – official access point for annual land-cover and comparison products
- USGS Annual NLCD Land Cover Classification – definitions and guidance for agriculture, forest, wetlands, developed land, and related classes
- U.S. Census Bureau TIGER/Line Shapefiles – official county-boundary reference for Colquitt County
- UGA Cooperative Extension – Colquitt County – local Agriculture & Natural Resources programs and county Extension information
- Colquitt County Ag Report – UGA Extension updates on local crops, production conditions, and farm management
- City of Moultrie Comprehensive Planning – official local planning and land-use-map resources for Moultrie and Colquitt County
Map File Information
The ZIP contains four original JPG maps for comparing Colquitt County agriculture, forest and wetlands, Moultrie-area hard surfaces, and 1985–2025 class differences.
- Included Files: Use only the versions confirmed in the article and supplied images
- File Type: Use the confirmed download contents
- Intended Use: Printing, education, presentations, and map-based projects
Related Maps
- Appling County Georgia Land Cover Map
- Atkinson County Georgia Land Cover Map
- Bacon County Georgia Land Cover Map
Green Map creates custom-edited map images using open geographic data sources such as geoBoundaries, Natural Earth, OpenStreetMap, and government open data.
These maps are edited visual materials, not raw data files, and are provided for education, documents, presentations, and graphic reference.