Cobb County is overwhelmingly developed in the supplied 2025 classification, but the county is not a single uninterrupted sheet of pavement. Developed land accounts for 79.50%, while forest still covers 16.07%, and smaller bands of water, wetlands, and agriculture remain around the edges and within the built area. This Cobb County Georgia Land Cover Map set is designed to compare those surfaces rather than to replace a street, parcel, zoning, or municipal-boundary map.
Four views are included: 2025 land cover, forest and farmland, fractional impervious surface, and a 1985–2025 class comparison. The WebP versions appear with the discussion below, and the four original 2480 × 1754-pixel JPG maps are available together in one ZIP. That makes it easy to use the countywide view for an overview and then add the more focused map that fits a lesson, presentation, planning discussion, or local comparison.
Table of Contents
Hard surfaces reveal a different side of a 79.50% developed county
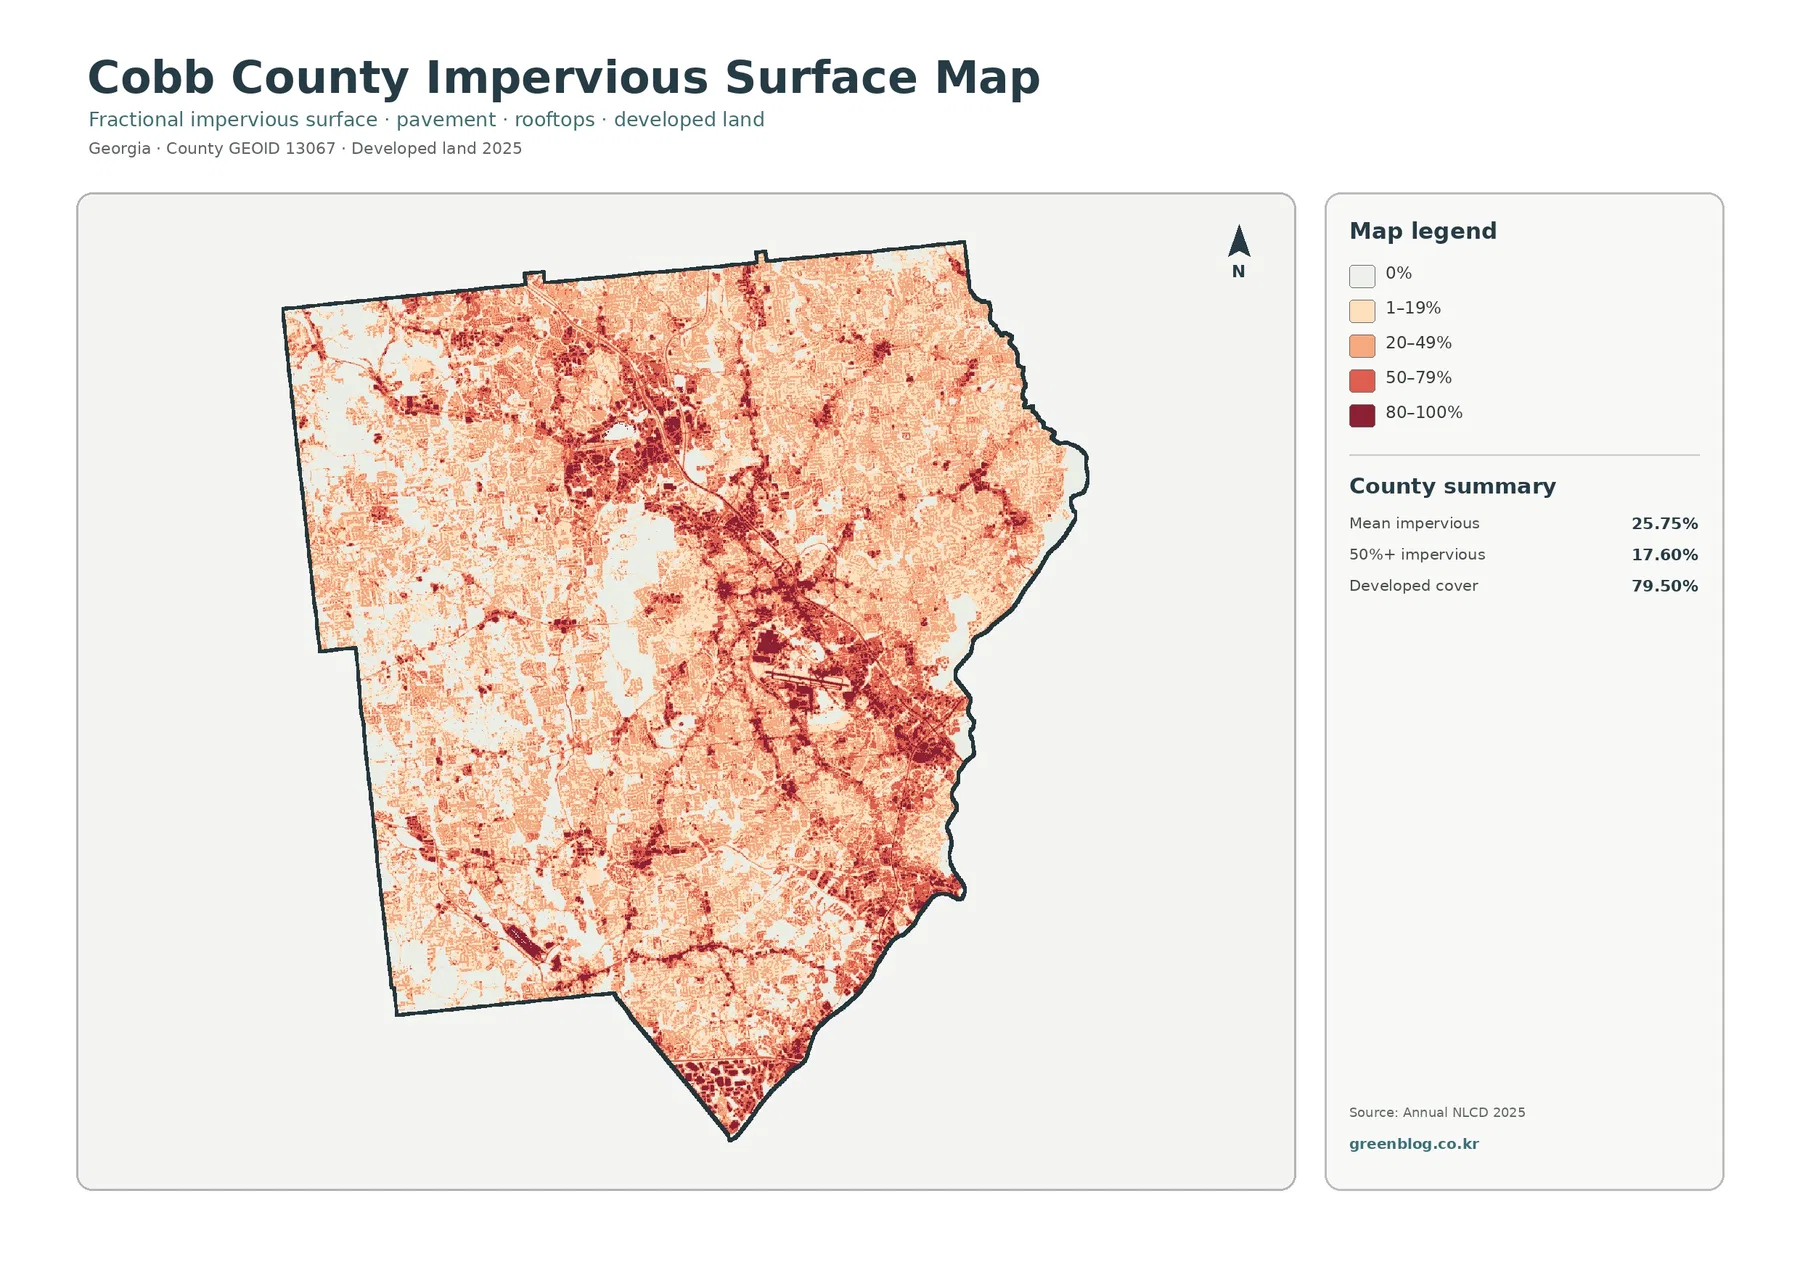
The developed total is 79.50%, but mean impervious cover is 25.75%. Those numbers answer different questions. The land-cover classification asks which broad surface class best represents each mapped cell. The impervious product estimates the fraction occupied by hard materials such as pavement and rooftops. A developed neighborhood can therefore contain lawns, tree canopy, bare soil, and other permeable ground even though the cell belongs to a developed class.
The map reports that 17.60% of the county falls in cells with at least 50% impervious cover. The darkest concentrations form several connected clusters through the north-central, central-eastern, southeastern, and far southern parts of the county. Lighter orange shades fill much of the space between them, indicating that the developed landscape is not uniformly high-density. Western and northwestern areas include more pale zones, which becomes important when those same locations are compared with the forest and farmland view.
This distinction is useful for stormwater discussions. Cobb County Water System explains that rooftops, roads, driveways, and parking lots reduce the amount of rainfall that can soak directly into the ground. The map here does not calculate flood risk or drainage capacity, but it does show where hard surfaces are more concentrated. A drainage study would still need elevation, rainfall, storm-sewer, stream, and flood-zone information that is not contained in these four images.
The five legend bands—0%, 1–19%, 20–49%, 50–79%, and 80–100%—also help prevent a common reading error. A very light cell is not automatically rural or undeveloped, and a dark cell does not tell you whether the hard surface is a highway, shopping area, warehouse, airport apron, or dense neighborhood. The colors describe surface fraction only. For named places and transportation features, this map should be paired with a current road or municipal map.
Forest, water, and small agricultural remnants stand out once development is muted
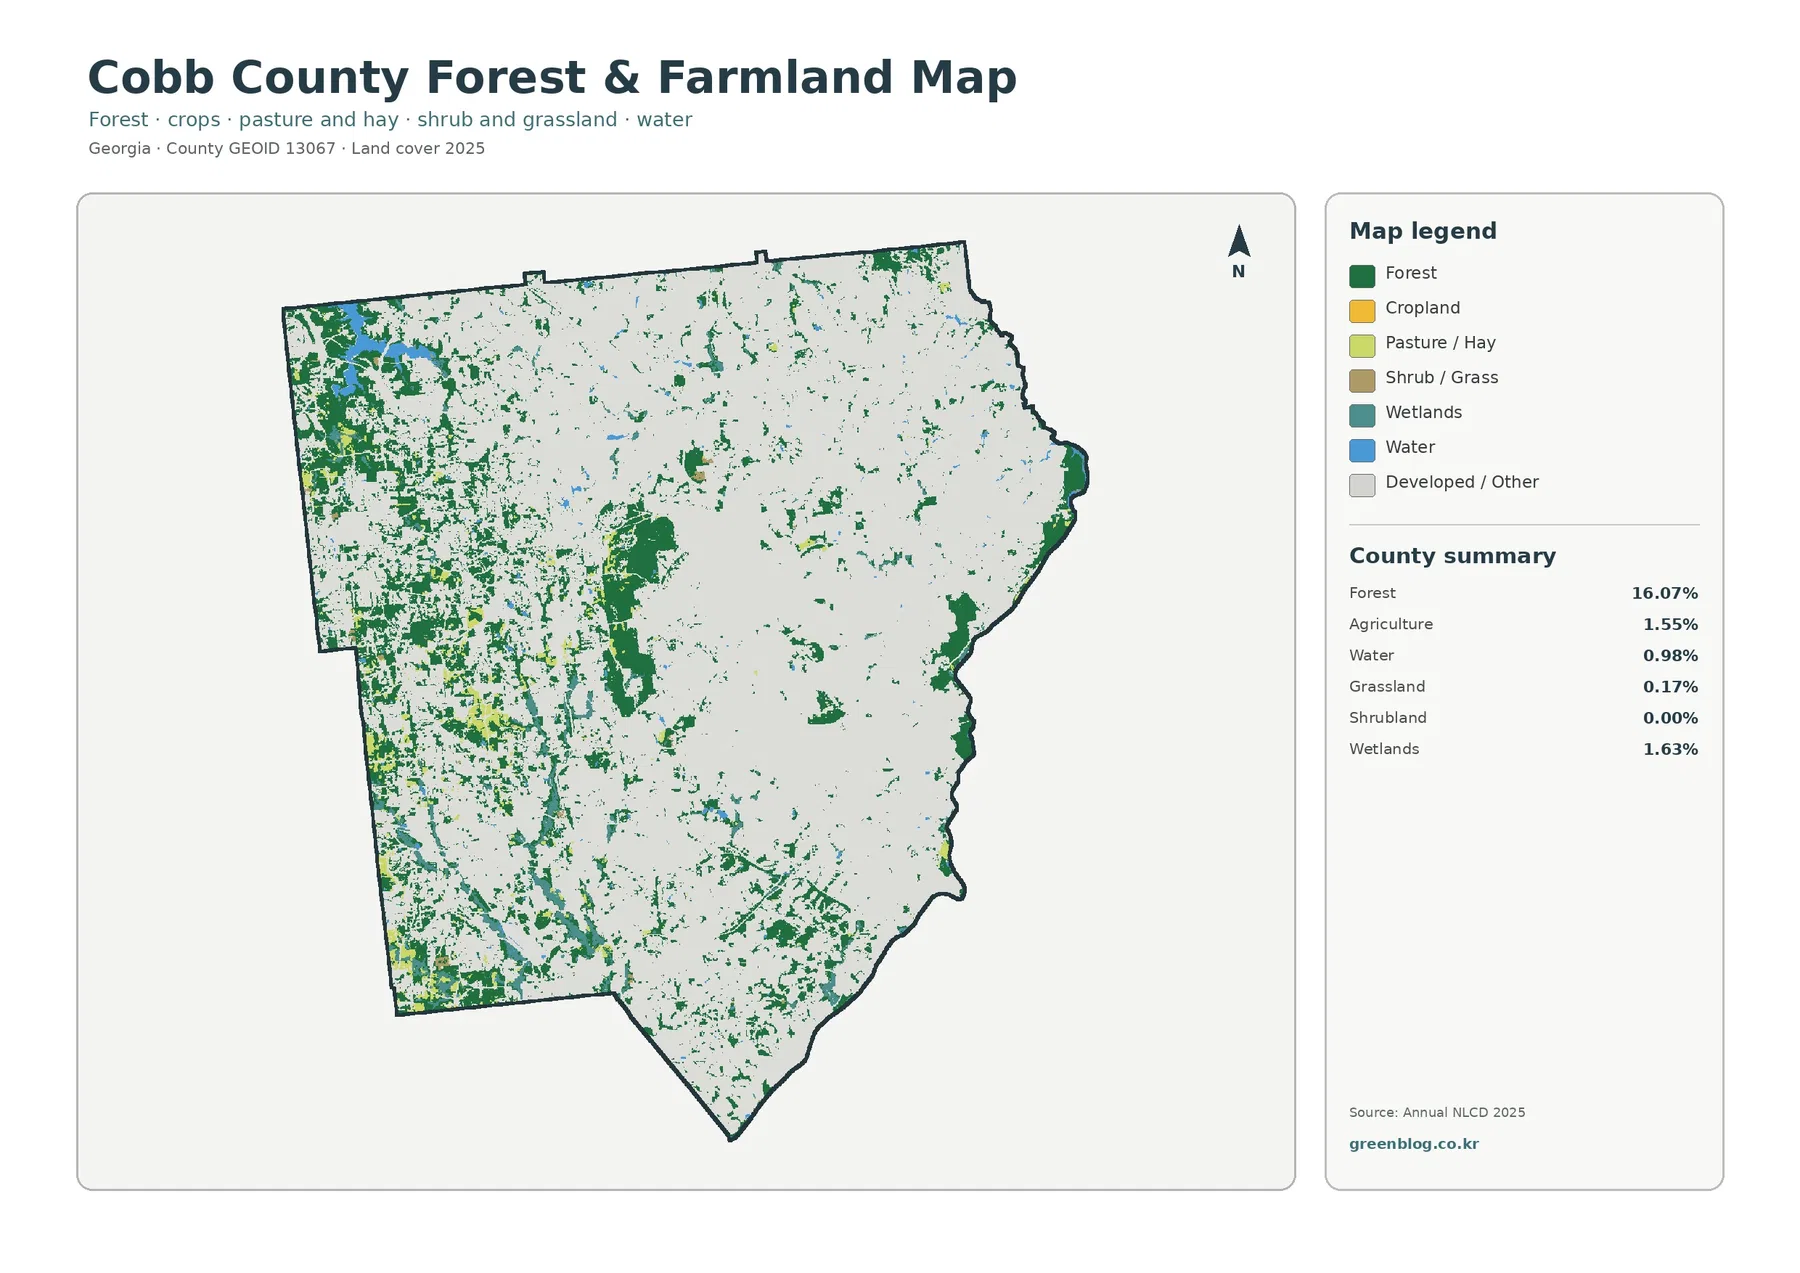
With developed and other land shown in a pale background, the remaining green and blue patches become easier to follow. Forest covers 16.07% of Cobb County. Larger forest blocks appear in the west and northwest, with additional pieces in the county interior and along the eastern side. The distribution is fragmented rather than continuous, which fits a county where development occupies most of the mapped area.
Cobb County’s official Community Profile identifies Lake Allatoona and Lake Acworth, Kennesaw Mountain, and the Chattahoochee River corridor as important natural and scenic resources. That local context helps explain several visible concentrations without pretending the land-cover map labels them directly. The larger blue area at the northwest edge aligns with the Allatoona/Acworth lake setting, while forest, wetland, and water colors along the east correspond to the side of the county where the Chattahoochee River National Recreation Area is located.
Agriculture is only 1.55% of the 2025 summary. Yellow cells are scattered mainly through western and southwestern portions of the county, with smaller pieces elsewhere. These are not broad agricultural belts like those seen in many rural Georgia counties. They are better read as surviving farm or open-land fragments embedded in a heavily developed county. Grassland adds just 0.17%, wetlands 1.63%, water 0.98%, and shrubland rounds to 0.00% in the supplied summary.
Small percentages can still matter locally. A narrow wetland strip along a stream or a small wooded block can be almost invisible in a countywide percentage while remaining important at neighborhood scale. The map is therefore strongest when used to compare where classes cluster and where they meet. It is not a parcel inventory, and it cannot tell whether a particular green patch is public parkland, private woodland, a conservation easement, or simply tree-covered property.
The 2025 land-cover view puts the countywide balance back together
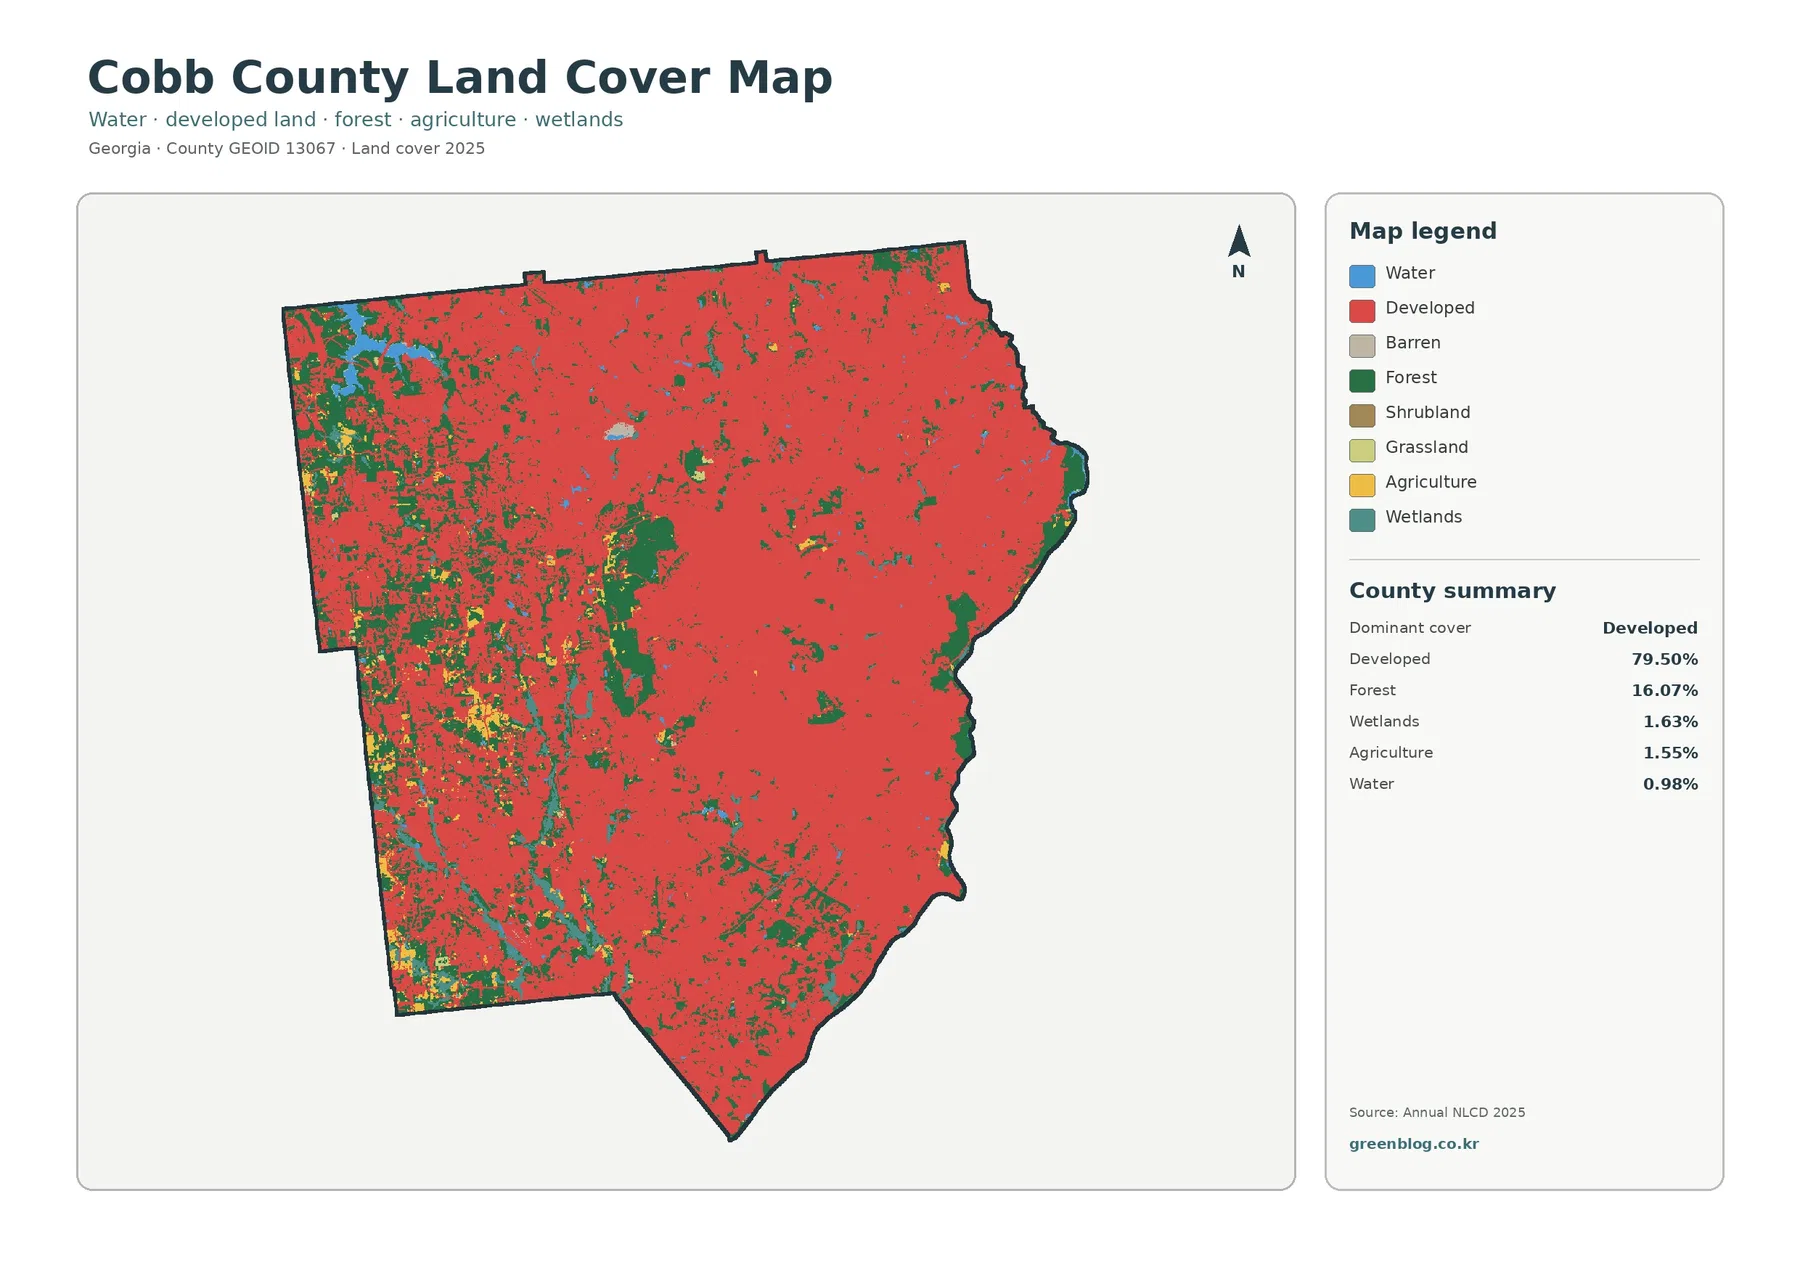
The full land-cover map makes the scale of development unmistakable. Developed land covers 79.50%, forest 16.07%, wetlands 1.63%, agriculture 1.55%, and water 0.98%. Red fills most of the county from north to south, but the western side has more frequent interruptions from forest and small agricultural patches. Blue water in the northwest and narrow water or wetland features toward the eastern boundary create another contrast with the broad developed background.
Because the map uses land-cover classes, “developed” should not be translated into a legal land-use category. It does not tell you whether an area is zoned residential, commercial, industrial, institutional, or mixed use. Cobb County publishes separate comprehensive-planning and future-land-use material for those policy questions. The 2025 map instead describes what the surface is classified as during the observation year, so it is best for physical-cover comparison rather than legal or policy interpretation.
The red field also should not be read as a city boundary. Cobb County contains several municipalities together with extensive unincorporated areas, so the lived urban pattern does not follow one simple boundary. The supplied land-cover image has no municipal labels, and a single red cluster may cross more than one local jurisdiction. Adding a current official boundary layer is necessary before making city-by-city statements.
For a quick visual summary, start with this map because it answers the broadest question: which cover classes dominate, and where do the largest exceptions appear? Then move to the forest/farmland map if the goal is to isolate natural and open land, or to the impervious map if the goal is to distinguish low-density developed surfaces from areas with much more pavement and roof cover.
Development dominates the 1985–2025 class comparison, but the map is not a construction timeline
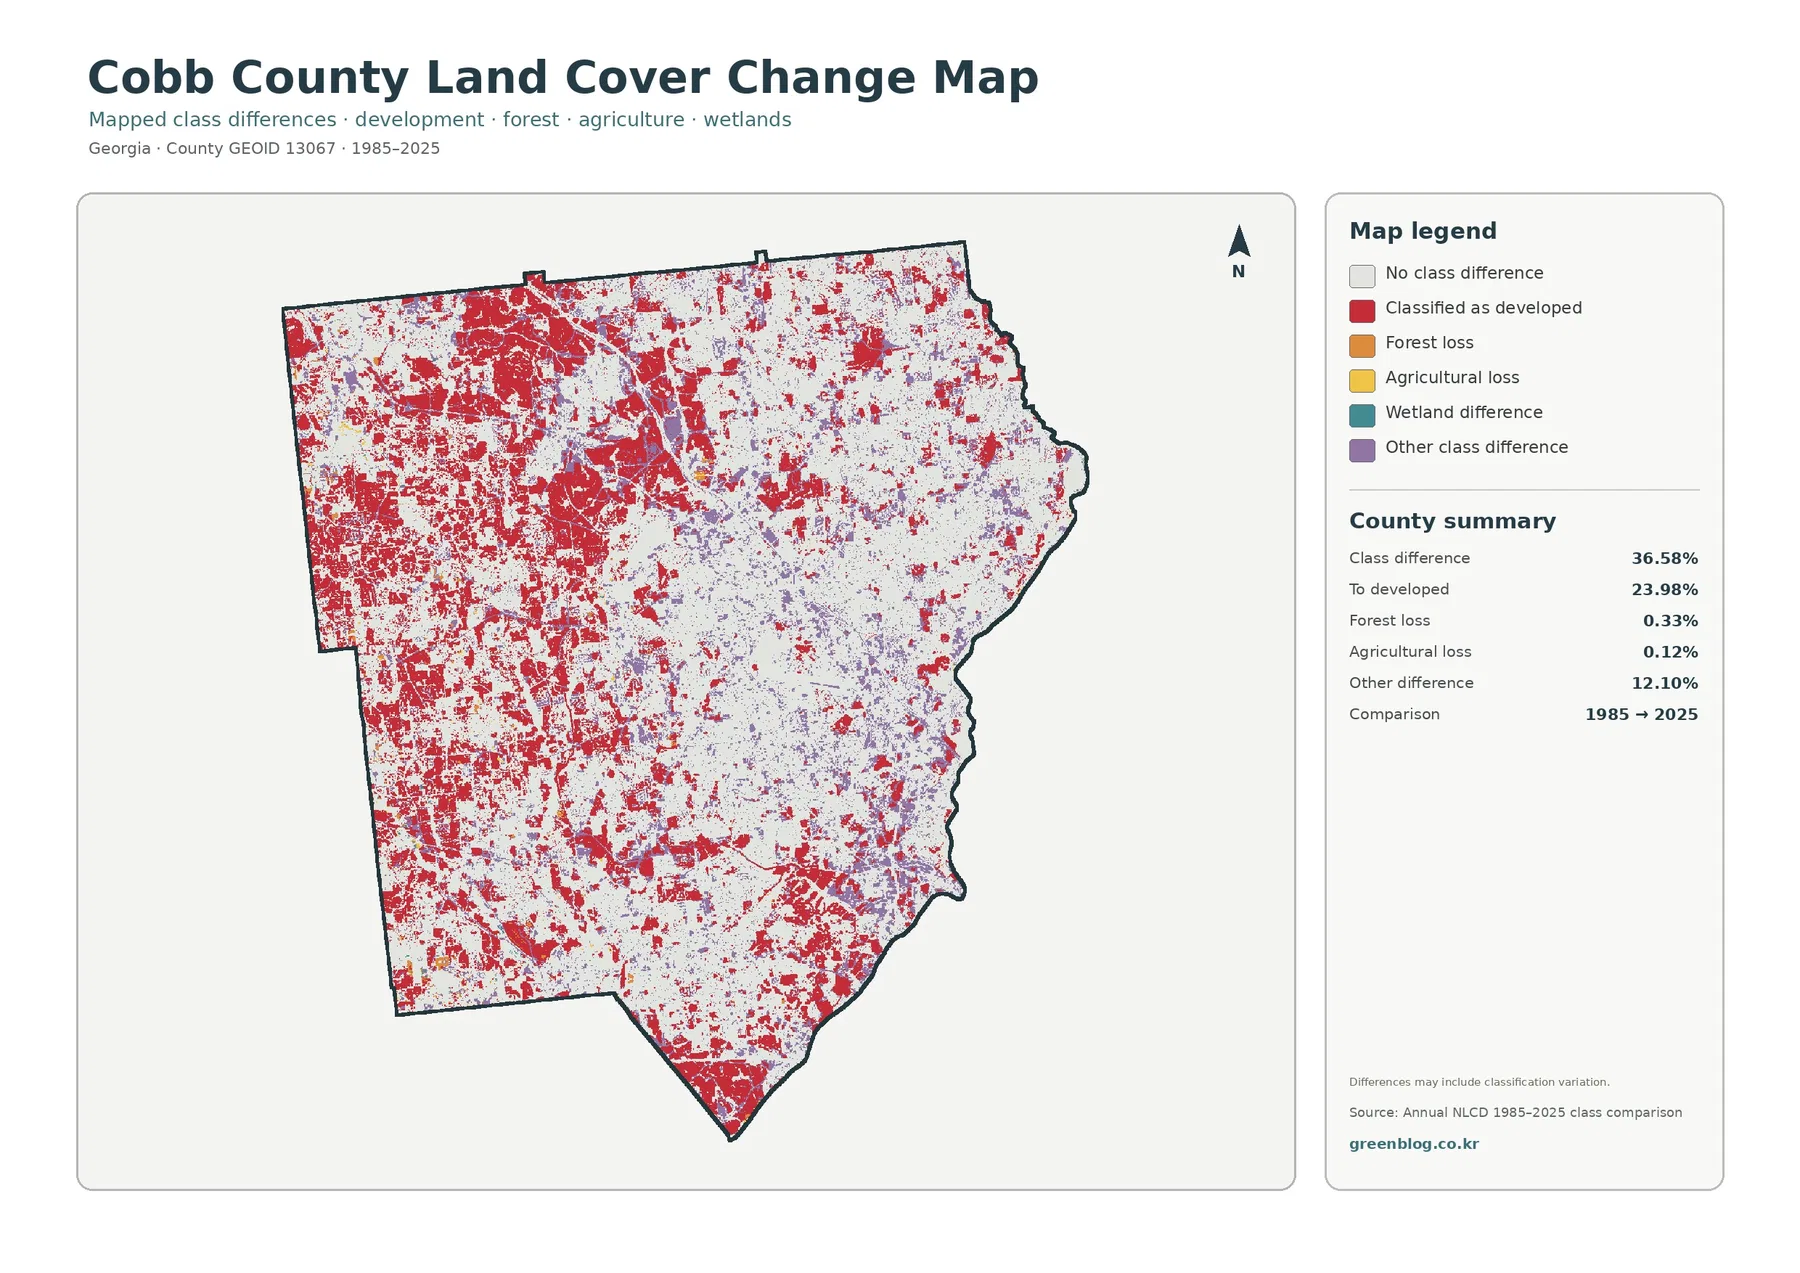
The comparison reports a class difference for 36.58% of Cobb County between the two endpoints. The largest named category is “to developed” at 23.98%. Forest loss is 0.33%, agricultural loss 0.12%, and other class differences account for 12.10%, with a small remainder represented by other mapped difference classes. Red change cells are widespread, especially through western and northwestern areas, the north-central zone, and parts of the south.
That 23.98% figure is not a direct measure of the acreage built in a particular year or decade. It means that a cell with another classification at the 1985 endpoint is in a developed class at the 2025 endpoint. The map does not show the exact year of conversion, whether a cell changed more than once, or what project caused a change. Annual NLCD provides intermediate years that would be needed for a true time-series investigation.
The pale background marks cells with no class difference between the two endpoints. Purple “other difference” cells are also common, reminding the reader that land-cover change is not only an urban-development story. A cell can shift among non-developed categories, and classification can vary because of imagery, vegetation condition, or model uncertainty. The map itself carries a note that differences may include classification variation, so the colored cells should be treated as screening locations rather than final proof of land conversion.
Comparing this image with the 2025 impervious map can sharpen a question. A place mapped “to developed” that is now dark red on the impervious surface map is a stronger candidate for intensive built change than a place that remains lightly impervious. Even then, the maps do not establish cause. Historical aerial photography, permits, local planning documents, and intermediate Annual NLCD years are the better tools for explaining when and how a specific area changed.
Water edges and planning maps provide useful context without changing what land cover means
Cobb County’s official documents identify two prominent water settings that are useful when reading the county outline: Lake Allatoona/Lake Acworth in the northwestern area and the Chattahoochee River along the eastern side. The county Water System also explains that Lake Allatoona and the Chattahoochee are major water sources. Those facts provide geographic context for the blue and teal edges on the supplied maps, but the land-cover graphics should still be paired with a hydrography map when exact stream or shoreline names matter.
Planning information belongs in a different layer. Cobb County’s Comprehensive Planning page provides a Future Land Use Map and long-range planning documents, while these four images describe observed surface cover. A forested cell is not automatically protected, and a developed cell is not automatically zoned for a particular use. Keeping those concepts separate prevents a land-cover illustration from being mistaken for a zoning, ownership, or development-rights map.
Scale is another limit. Annual NLCD products are produced at 30-meter spatial resolution, so each raster cell summarizes a square of ground rather than showing individual lot lines. Mixed surfaces can be simplified into one predominant class, and zooming in does not create missing parcel detail. The maps are excellent for countywide pattern recognition, comparison, and teaching, but site-level decisions require higher-resolution imagery and current local records.
Choosing and downloading the four original JPG maps
The download package contains one JPG for each supplied view: 2025 land cover, forest and farmland, impervious surface and developed land, and the 1985–2025 land-cover comparison. Use the general map when one image must summarize the county. Use the forest/farmland map when the surviving green and open areas need emphasis, the impervious map when hard-surface concentration matters, and the change map when the question is where endpoint classifications differ.
Each JPG is 2480 × 1754 pixels. That size works well for web pages, reports, slides, and many ordinary print layouts, but the package does not mark the images as meeting an A3 high-resolution reference. Test a large print before relying on fine labels. Upscaling the file cannot recover detail that was not present in the original map, and it does not change the 30-meter source resolution of the underlying land-cover classification.
Frequently Asked Questions
Does 79.50% developed cover mean that 79.50% of Cobb County is pavement or buildings?
No. Developed land is a broad land-cover class and can include lawns, trees, soil, and other permeable surfaces around buildings and roads. The impervious product gives a different measure: mean impervious cover is 25.75%, and 17.60% of the county is in cells with at least 50% impervious cover. Reading both maps prevents the developed total from being mistaken for the hard-surface total.
What do the water and green areas at the northwest and eastern edges represent?
Cobb County official planning and water resources identify Lake Allatoona/Lake Acworth in the northwestern part of the county and the Chattahoochee River corridor along the eastern side. Those features provide useful context for the visible water, wetland, and forest patterns. The supplied land-cover maps do not label individual water bodies, so use an official hydrography or boundary map for exact names and limits.
Can the 23.98% “to developed” value be used as a precise development-growth rate?
Not by itself. It is the share of cells classified in another category at the 1985 endpoint and as developed at the 2025 endpoint. It does not identify the year of change, the project involved, or whether a cell changed more than once. Intermediate Annual NLCD years, historical imagery, and local planning records are needed for a detailed development timeline.
Sources and Reference Data
- MRLC Annual NLCD Data – official access point for Annual NLCD land-cover and change products
- USGS Annual NLCD Collection 1.2 – official description of the 2025-inclusive Annual NLCD land-cover product, 30-meter resolution, and classification framework
- U.S. Census Bureau TIGER/Line Shapefiles – official county-boundary reference for Cobb County
- Cobb County Comprehensive Planning – county planning hub for comprehensive-plan and Future Land Use Map material that is separate from observed land cover
- Cobb County Water System – Stormwater – county explanation of impervious surfaces, runoff, Lake Allatoona, and the Chattahoochee River
- Cobb County Community Profile – official planning appendix describing Lake Allatoona, the Chattahoochee River corridor, Kennesaw Mountain, and other natural resources
Map File Information
The ZIP contains four original JPG maps for comparing Cobb County's 2025 developed and natural cover, forest and farmland remnants, impervious surfaces, and 1985–2025 class differences.
- Included Files: Use only the versions confirmed in the article and supplied images
- File Type: Use the confirmed download contents
- Intended Use: Printing, education, presentations, and map-based projects
Related Maps
- Appling County Georgia Land Cover Map
- Atkinson County Georgia Land Cover Map
- Bacon County Georgia Land Cover Map
Green Map creates custom-edited map images using open geographic data sources such as geoBoundaries, Natural Earth, OpenStreetMap, and government open data.
These maps are edited visual materials, not raw data files, and are provided for education, documents, presentations, and graphic reference.