Wetlands and agriculture share most of Bulloch County on the supplied 2025 map. Wetlands account for 34.57%, agriculture for 30.28%, and the largest developed concentration marks Statesboro near the center. This Bulloch County Georgia Land Cover Map explains how fields, wet ground, forest, and built surfaces divide the county.
The page includes 2025 land cover, forest and farmland, impervious surface, and a 1985–2025 class-difference comparison. The four WebP previews appear with the discussion, and the original 2480 × 1754-pixel JPG maps are available together in one ZIP for profiles, lessons, and presentations.
Table of Contents
Wet ground and working fields outside one strong developed center
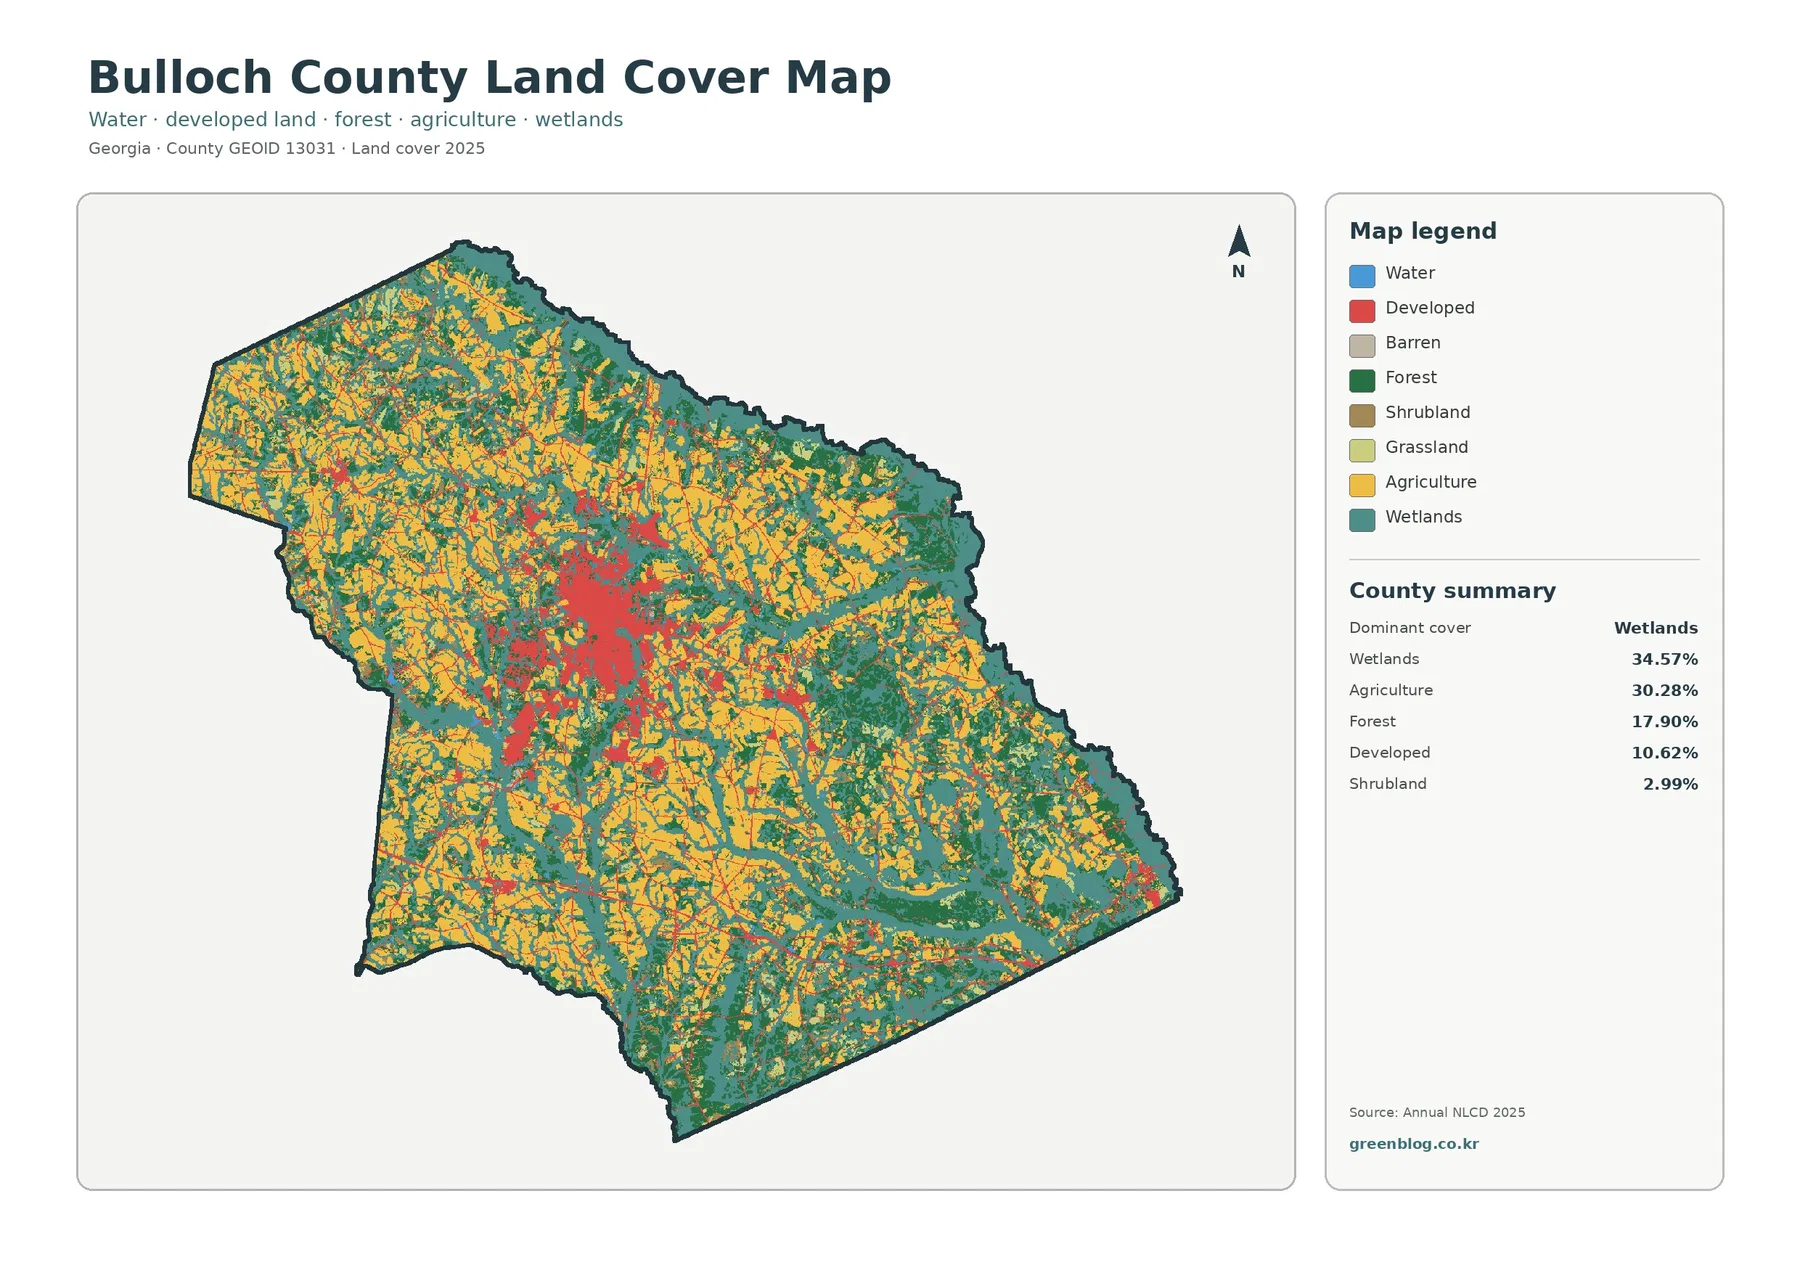
Wetlands lead the summary at 34.57%, followed closely by agriculture at 30.28%. Forest covers 17.90%, developed land 10.62%, shrubland 2.99%, grassland 2.62%, and open water 0.97%. The county is therefore a wetland-farmland mix with forest between many areas and development concentrated in a smaller footprint.
Teal wetland cells cover broad areas in the east and southeast and branch toward the middle and north. Yellow farm blocks spread through the northwest, west, and interior, while dark forest patches meet both classes. These repeated boundaries show how fields, woods, and wet ground can change over short distances.
Land cover describes the surface classified from imagery. It is not zoning, ownership, a parcel survey, a farm boundary, or permission to build. Developed cells may include lawns and trees, while agricultural color does not identify a crop or prove that every part of a cell was cultivated.
Field blocks become clearer when developed surfaces fade
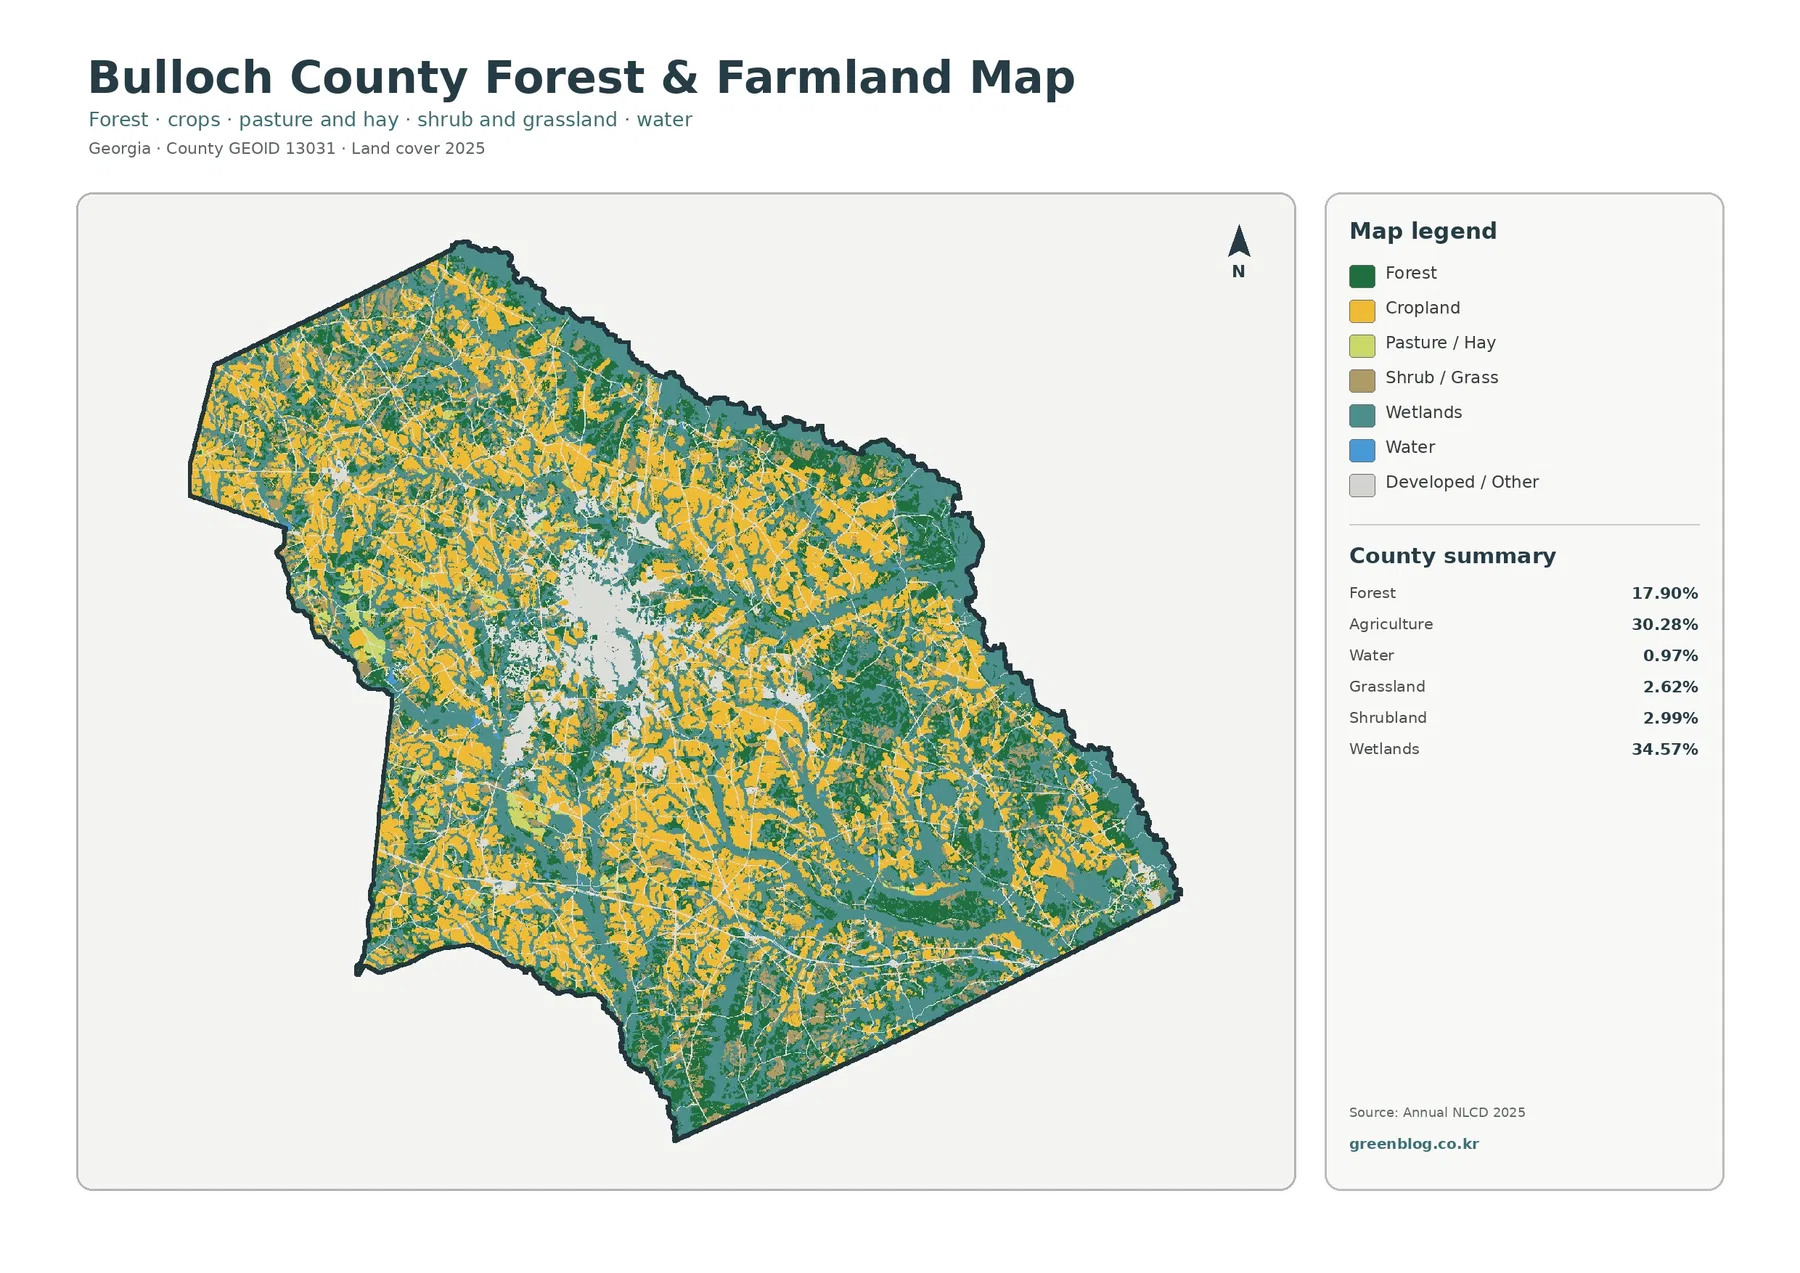
With developed and miscellaneous surfaces faded, cropland forms large yellow blocks through the northwest and north and continues in smaller areas farther south. Wetlands weave among the fields, while forest creates dark patches and narrow links along many edges. The pale Statesboro opening corresponds to the strongest developed cluster on the general map.
Grassland accounts for 2.62% and shrubland for 2.99%, mostly as scattered pieces. Open water is only 0.97%, even though wetlands cover more than one-third of the county. Blue marks exposed water, while teal wetland classes can include vegetation and seasonally saturated ground.
Straight yellow edges can resemble farm parcels, but the source uses 30-meter cells rather than survey lines. Tree rows, farm roads, ditches, and small wet areas may be absorbed into a predominant class. UGA Cooperative Extension supplies useful local agriculture information, but that work is separate from the countywide 30.28% statistic.
The 18.80% endpoint difference is not a damage total
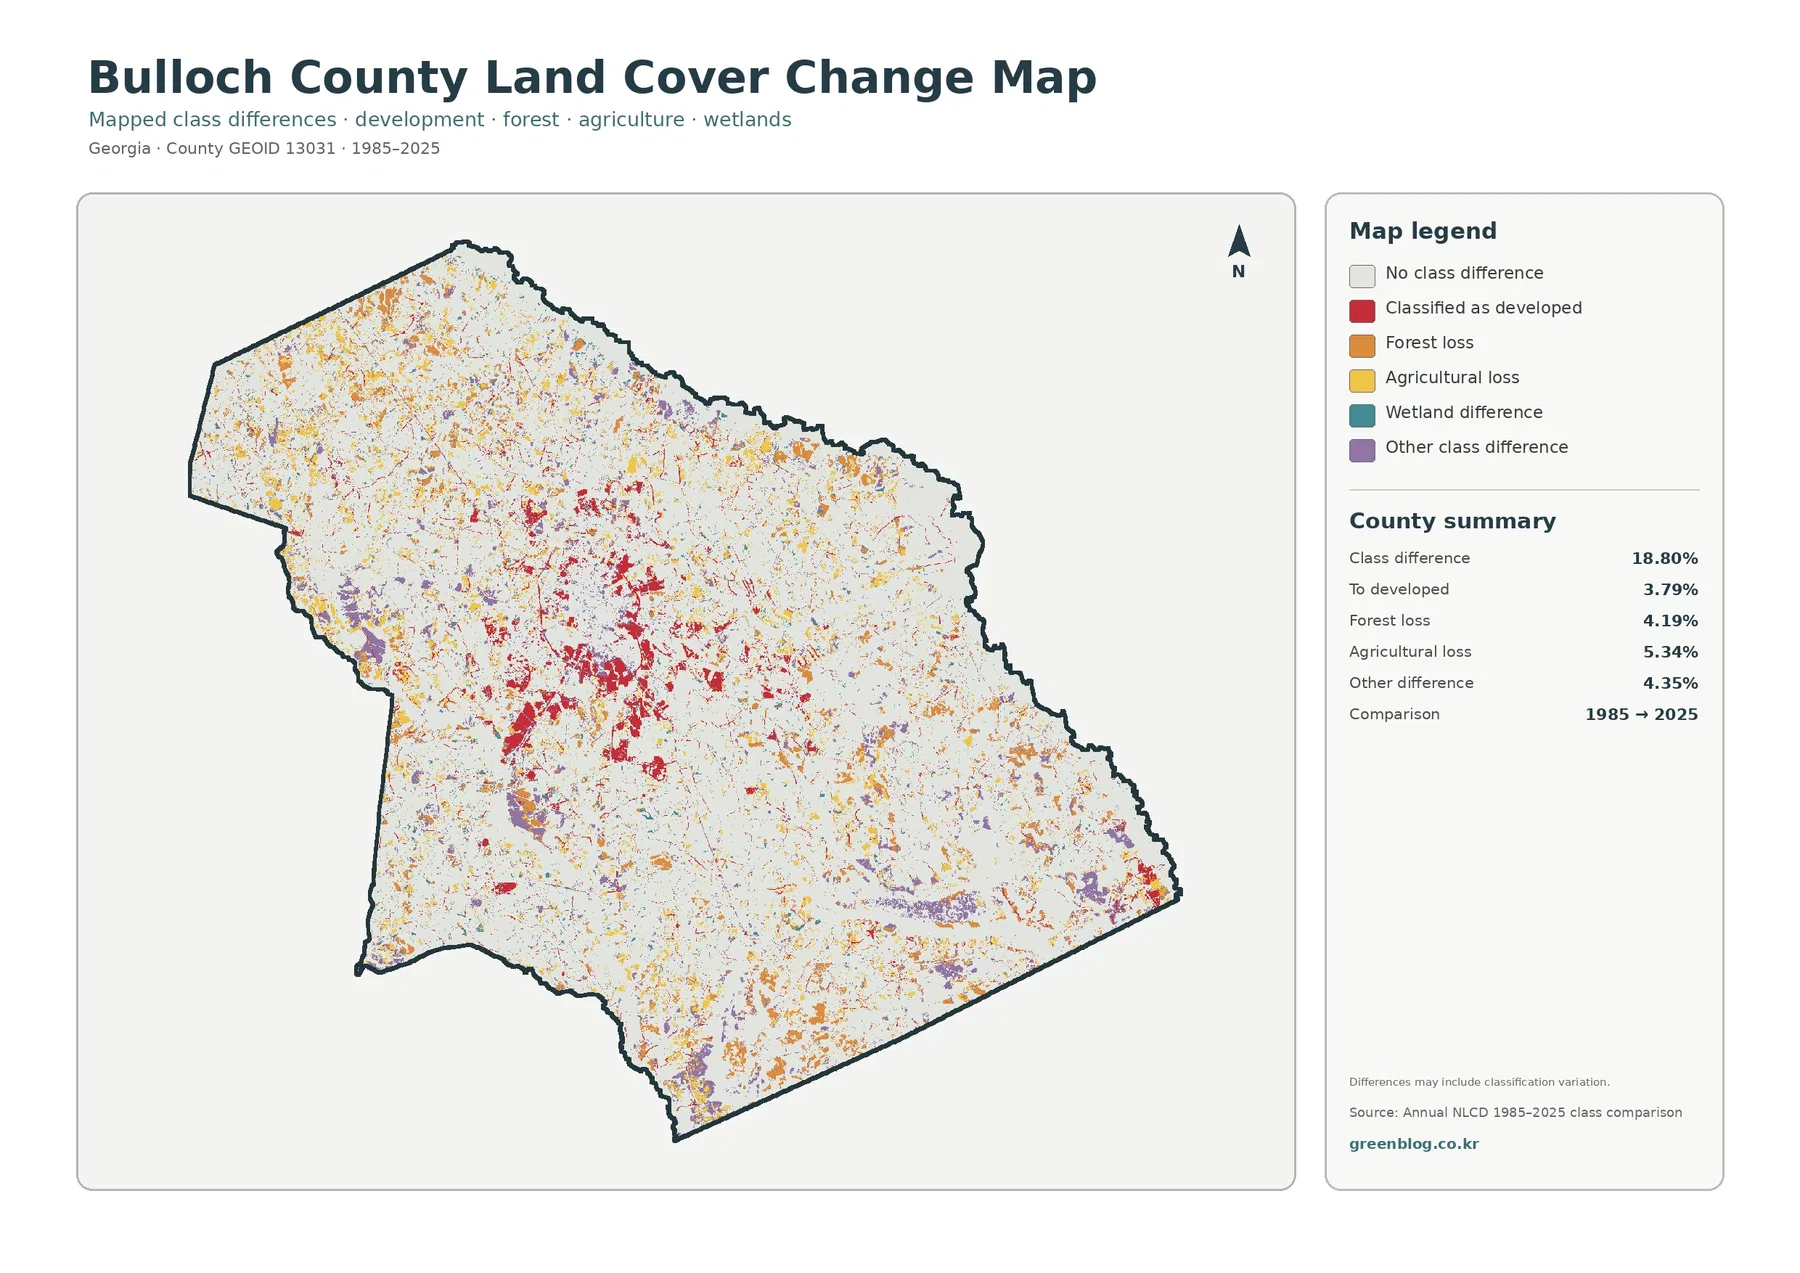
The comparison reports 18.80% total class difference. Listed components are 3.79% classified as developed, 4.19% forest loss, 5.34% agricultural loss, and 4.35% other difference. Wetland difference has no separate percentage, so a residual or visual estimate should not be presented as an official value.
Red is most noticeable around Statesboro and along some outward traces, with smaller patches in the south and southeast. Forest-loss and agricultural-loss cells are more widely scattered, while other differences appear in several western and southern areas. The countywide comparison therefore extends well beyond the central city.
“Loss” means that a forest or agricultural cell in 1985 received another class in 2025. It does not identify logging, abandonment, construction, storms, flooding, or classification error as the cause. Seasonal conditions and mixed pixels may also affect labels, so intermediate imagery, permits, and local records are needed for timing and explanation.
Hard surfaces remain concentrated around Statesboro
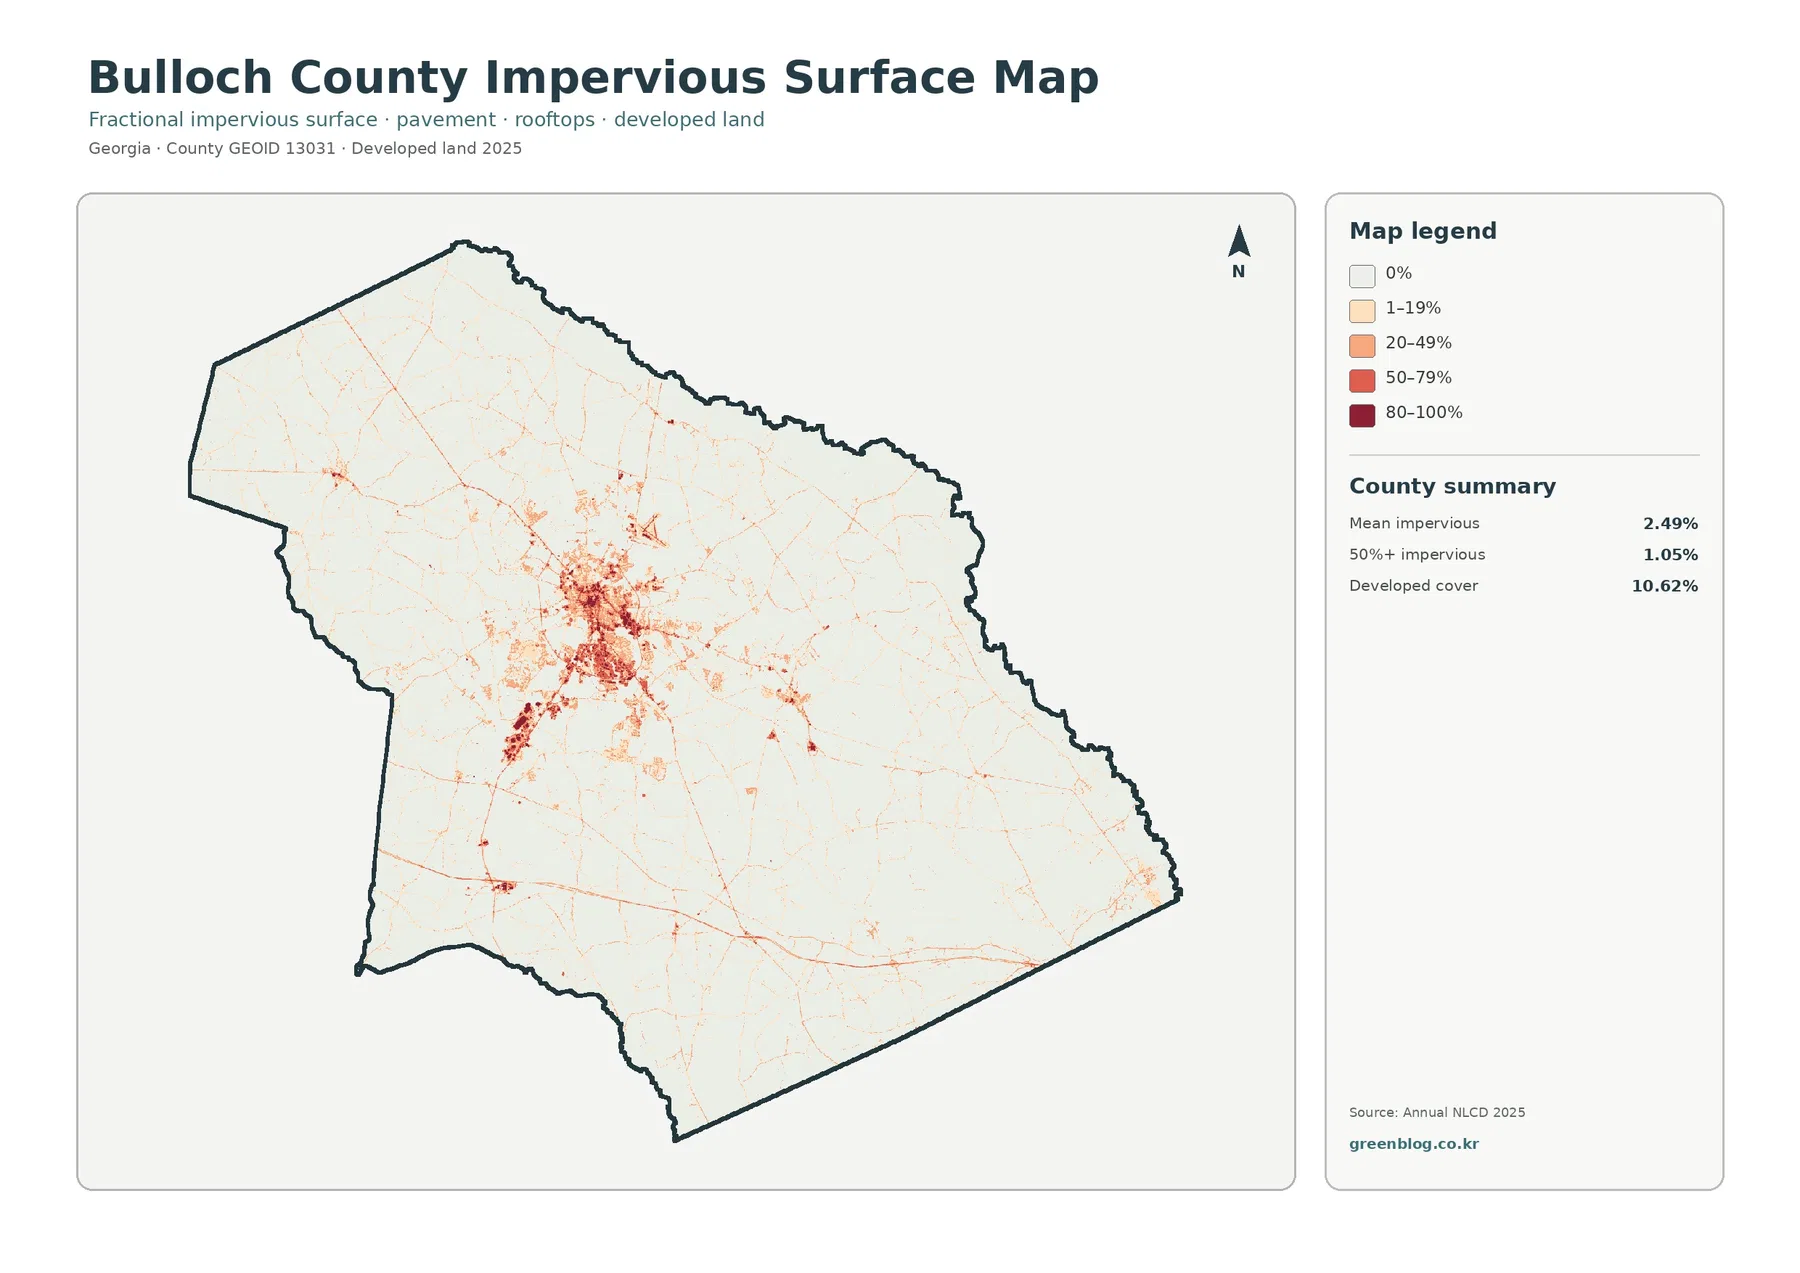
Mean impervious cover is 2.49%, and 1.05% of the county is mapped at 50% or greater. Both are below the 10.62% developed share because developed classes include lawns, trees, and open soil. The impervious layer focuses on roofs, pavement, parking areas, and similar hard surfaces.
The darkest tones form a dense Statesboro cluster. Fine lines and smaller concentrations extend outward, with other marks to the south and southwest. Some may align with transportation corridors, but the preview has no route labels or traffic data. Named roads require an official network map.
The countywide mean combines high central values with large rural areas near zero. Location and continuity are therefore more useful than the average alone when comparing development intensity. Impervious cover can frame runoff questions, but rainfall, soil, elevation, drainage, streams, and wetlands are also needed for flood analysis.
Ogeechee River rules and teal wetland cells serve different purposes
Bulloch County’s zoning ordinance identifies the Ogeechee River as protected and sets corridor standards in unincorporated areas. That legal framework is not the same as 30-meter Annual NLCD wetland classification. The broad teal areas provide drainage context, but named channels, buffers, floodplains, and jurisdictional wetlands require current hydrography and regulatory sources.
Municipal and planning boundaries require another map
Georgia’s Department of Community Affairs provides a plan page for Bulloch County with Brooklet, Portal, and Register, while Statesboro plans are listed separately. Those boundaries are absent from the previews. The central cluster can be associated broadly with Statesboro, but smaller patches need verified place and road layers before receiving a name.
Choose one map for the main question and one for comparison
Begin with the 2025 overview to show the wetland-agriculture balance, forest patches, and Statesboro center. Use the vegetation image for field-natural-cover contacts and the impervious map for roofs and pavement. Place the 1985–2025 layer after current cover so its change colors are not mistaken for present classes.
Annual NLCD uses 30-meter square cells. Each receives one predominant class even when crops, trees, a ditch, pavement, grass, and a building share the space. Zooming cannot recover missing parcel detail, so site questions require higher-resolution imagery, current records, and often field inspection.
The current maps represent the supplied 2025 observation year, so later construction, harvest, timber activity, vegetation recovery, storms, or standing water may not appear. Each JPG measures 2480 × 1754 pixels. The package does not mark the files as meeting an A3 high-resolution reference, so test large prints first.
Files included in the four-map JPG download
The ZIP contains one JPG for 2025 land cover, forest and farmland, impervious surface and developed land, and 1985–2025 land-cover change. Start with the countywide image, then add the view that directly supports the question. The files are reference graphics, not survey, parcel, wetland-jurisdiction, flood, or engineering products.
Frequently Asked Questions
Is Bulloch County mainly wetland or mainly agricultural?
Wetlands are the largest class at 34.57%, but agriculture follows closely at 30.28%. The county is better described as a wetland-farmland mix, with forest between many blocks and the strongest developed concentration around Statesboro.
Why is developed cover 10.62% when mean impervious cover is only 2.49%?
Developed classes may include lawns, trees, bare soil, and other permeable surfaces around buildings and roads. Impervious cover isolates roofs, pavement, parking areas, and similar hard materials, so its countywide mean is lower.
Does 3.79% classified as developed show every place built since 1985?
No. It is the share of cells that received a developed class at the 2025 endpoint after another class in 1985. It does not identify the exact year, project, or cause, and the comparison may include classification variation.
Sources and Reference Data
- MRLC Annual NLCD Data – official access point for annual land-cover and comparison products
- USGS Annual NLCD Land Cover Classification – definitions and guidance for forest, agriculture, wetlands, developed land, and related classes
- U.S. Census Bureau TIGER/Line Shapefiles – official county-boundary reference for Bulloch County
- Georgia DCA – Bulloch County Plans – county and municipal planning pages for Brooklet, Portal, Register, and Statesboro
- UGA Cooperative Extension – Bulloch County Agriculture and Natural Resources – local agriculture, natural-resource services, and county information
- Bulloch County Zoning Ordinance – official provisions addressing zoning and the protected Ogeechee River corridor
Map File Information
The ZIP contains four original JPG maps for comparing Bulloch County's wetlands, farmland, forest, Statesboro-area hard surfaces, and 1985–2025 class differences.
- Included Files: Use only the versions confirmed in the article and supplied images
- File Type: Use the confirmed download contents
- Intended Use: Printing, education, presentations, and map-based projects
Related Maps
- Appling County Georgia Land Cover Map
- Atkinson County Georgia Land Cover Map
- Bacon County Georgia Land Cover Map
Green Map creates custom-edited map images using open geographic data sources such as geoBoundaries, Natural Earth, OpenStreetMap, and government open data.
These maps are edited visual materials, not raw data files, and are provided for education, documents, presentations, and graphic reference.