The Berrien County Georgia Land Cover Map is led by agriculture, but wetlands and forest occupy nearly as much of the county when combined. Agriculture accounts for 35.25% of the supplied 2025 summary, wetlands 27.35%, and forest 23.16%. Developed land covers 6.90%, grassland 4.07%, shrubland 2.35%, and open water 0.82%. Farm cover is especially broad in the north and west, while wetland and forest colors become more prominent through the center and east. A compact developed area stands out south of the county’s center.
The article provides four distinct views: current land cover, forest and farmland, impervious surface, and a 1985–2025 endpoint comparison. WebP previews are embedded for quick reading, and the four original JPG maps are available together in one ZIP below. The set is useful for comparing the county’s agricultural base with its extensive wet and wooded cover, then separating the broad developed class from the much smaller concentration of hard surfaces.
Table of Contents
Agriculture is the largest class, but wetlands are almost as important visually
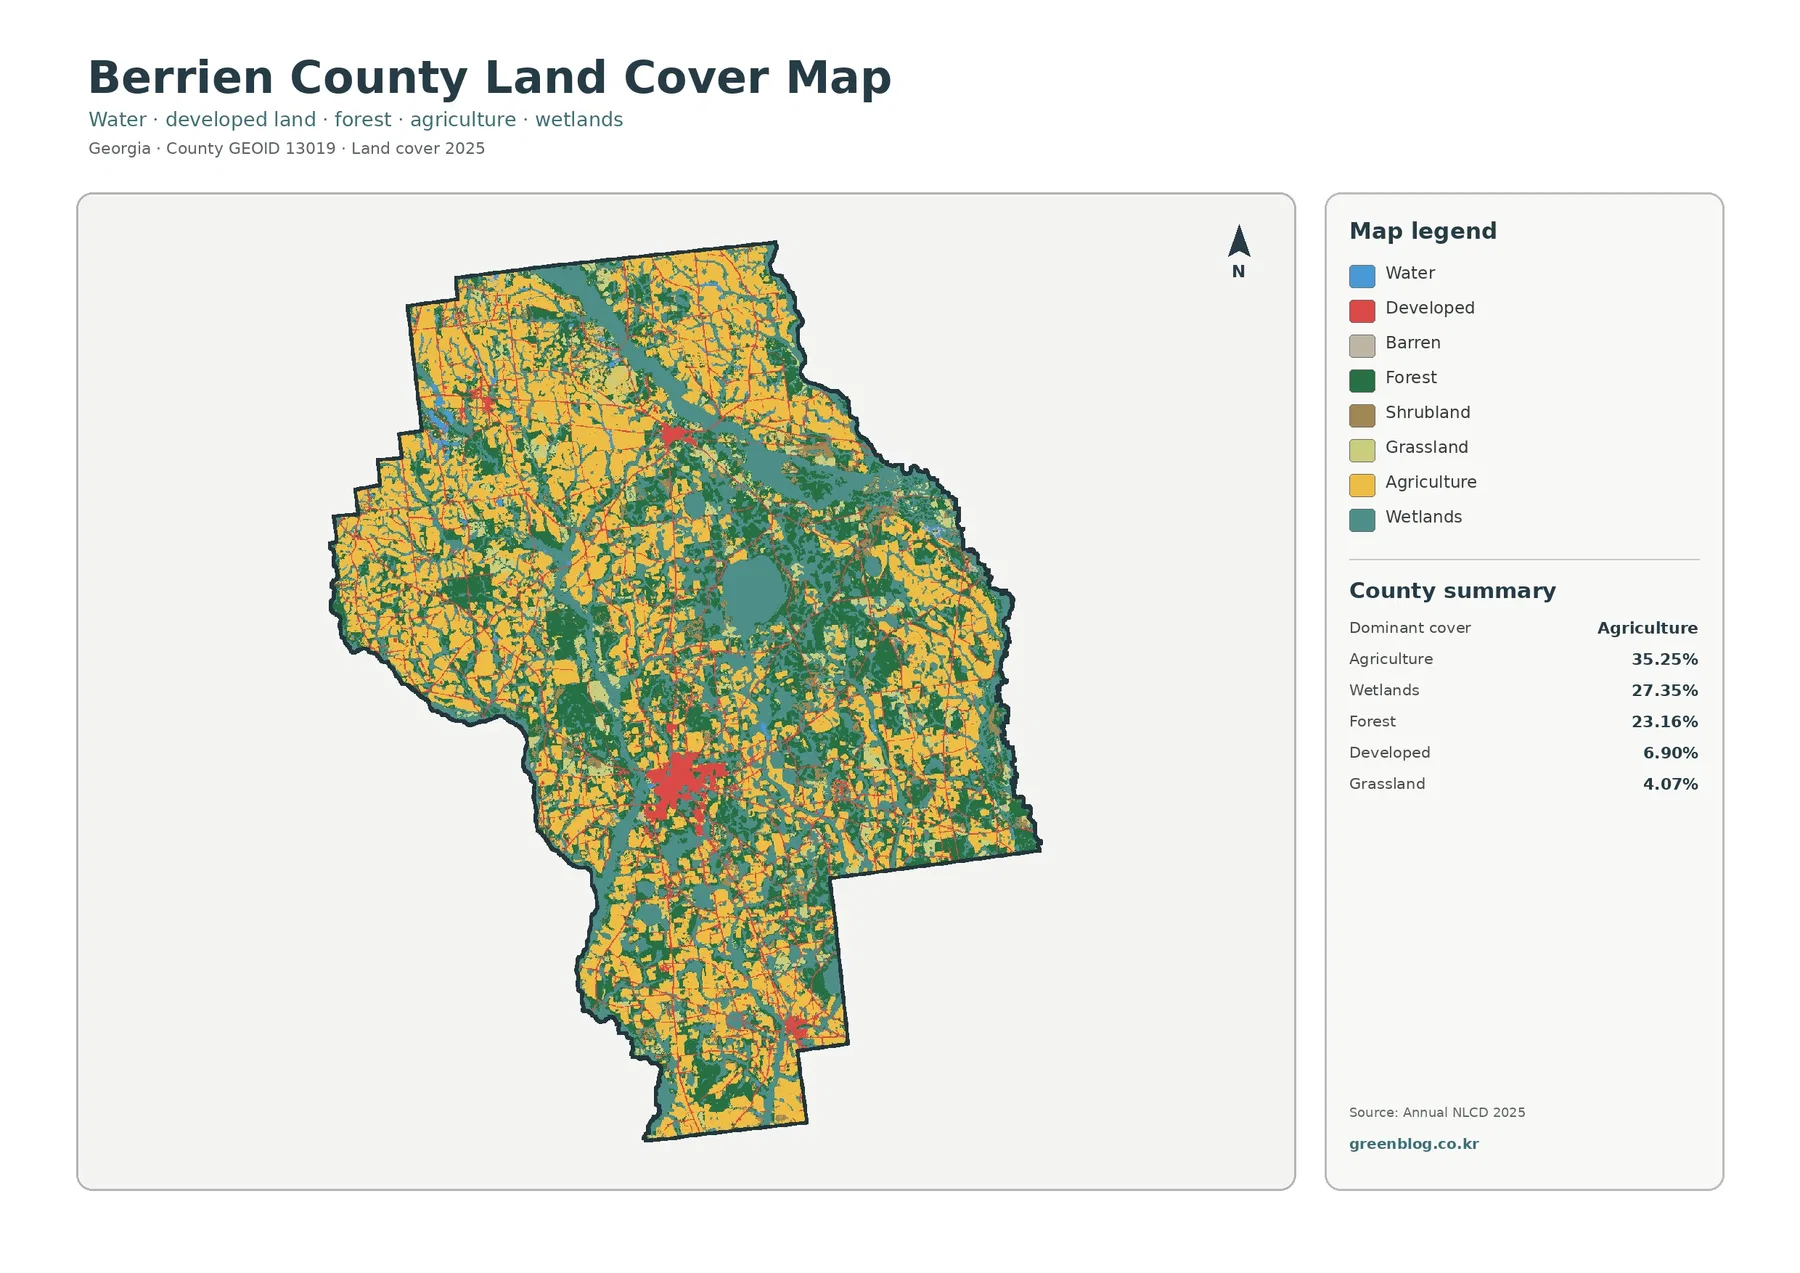
Yellow agricultural cover is especially broad across northern, northwestern, and western Berrien County and remains substantial through the long southern section. Farmland also appears in the east, although it is more frequently broken by wetland and forest cells there. The map therefore reads as a working rural landscape divided by natural cover rather than one uninterrupted agricultural block.
Wetlands cover 27.35%, only 7.90 percentage points less than agriculture. Teal areas are extensive through the center and east and recur throughout the north and south. Some form broad areas, while others narrow between fields and forest. Open water is only 0.82%, so the county’s large wetland share should not be described as if more than one quarter of Berrien County were covered by visible lakes or ponds.
Forest accounts for 23.16%. Dark-green cover is distributed across the center, east, and north and remains present among western agricultural areas. Forest and wetlands often touch or intermix, especially away from the largest farm blocks. That arrangement makes the natural portion of the county more varied than a simple forest-versus-farmland description would suggest.
Developed land reaches 6.90%. The most noticeable red concentration lies south of the county’s center, with smaller developed areas in the north and farther south. Thin red traces extend outward from the main cluster. Most of the county remains agricultural, wet, or wooded, so the developed footprint is visually compact even though it is easy to locate.
Nashville is the strongest municipal reference for the main developed cluster
Georgia’s Department of Community Affairs lists Alapaha, Enigma, Nashville, and Ray City in Berrien County’s current comprehensive plan. The plan identifies Nashville as the county seat and the county’s largest city. That official context makes Nashville the clearest municipal reference for the main south-central developed concentration, although the raster map itself does not display city limits.
The same plan places Enigma in the northwestern part of the county and documents the other municipalities as separate local communities. Small developed clusters elsewhere on the land-cover map are consistent with a county that has several towns rather than a single settlement. Identifying a particular red patch as Alapaha, Enigma, or Ray City still requires an administrative or transportation layer.
Fading developed areas reveals how farms, wetlands, and forest interlock
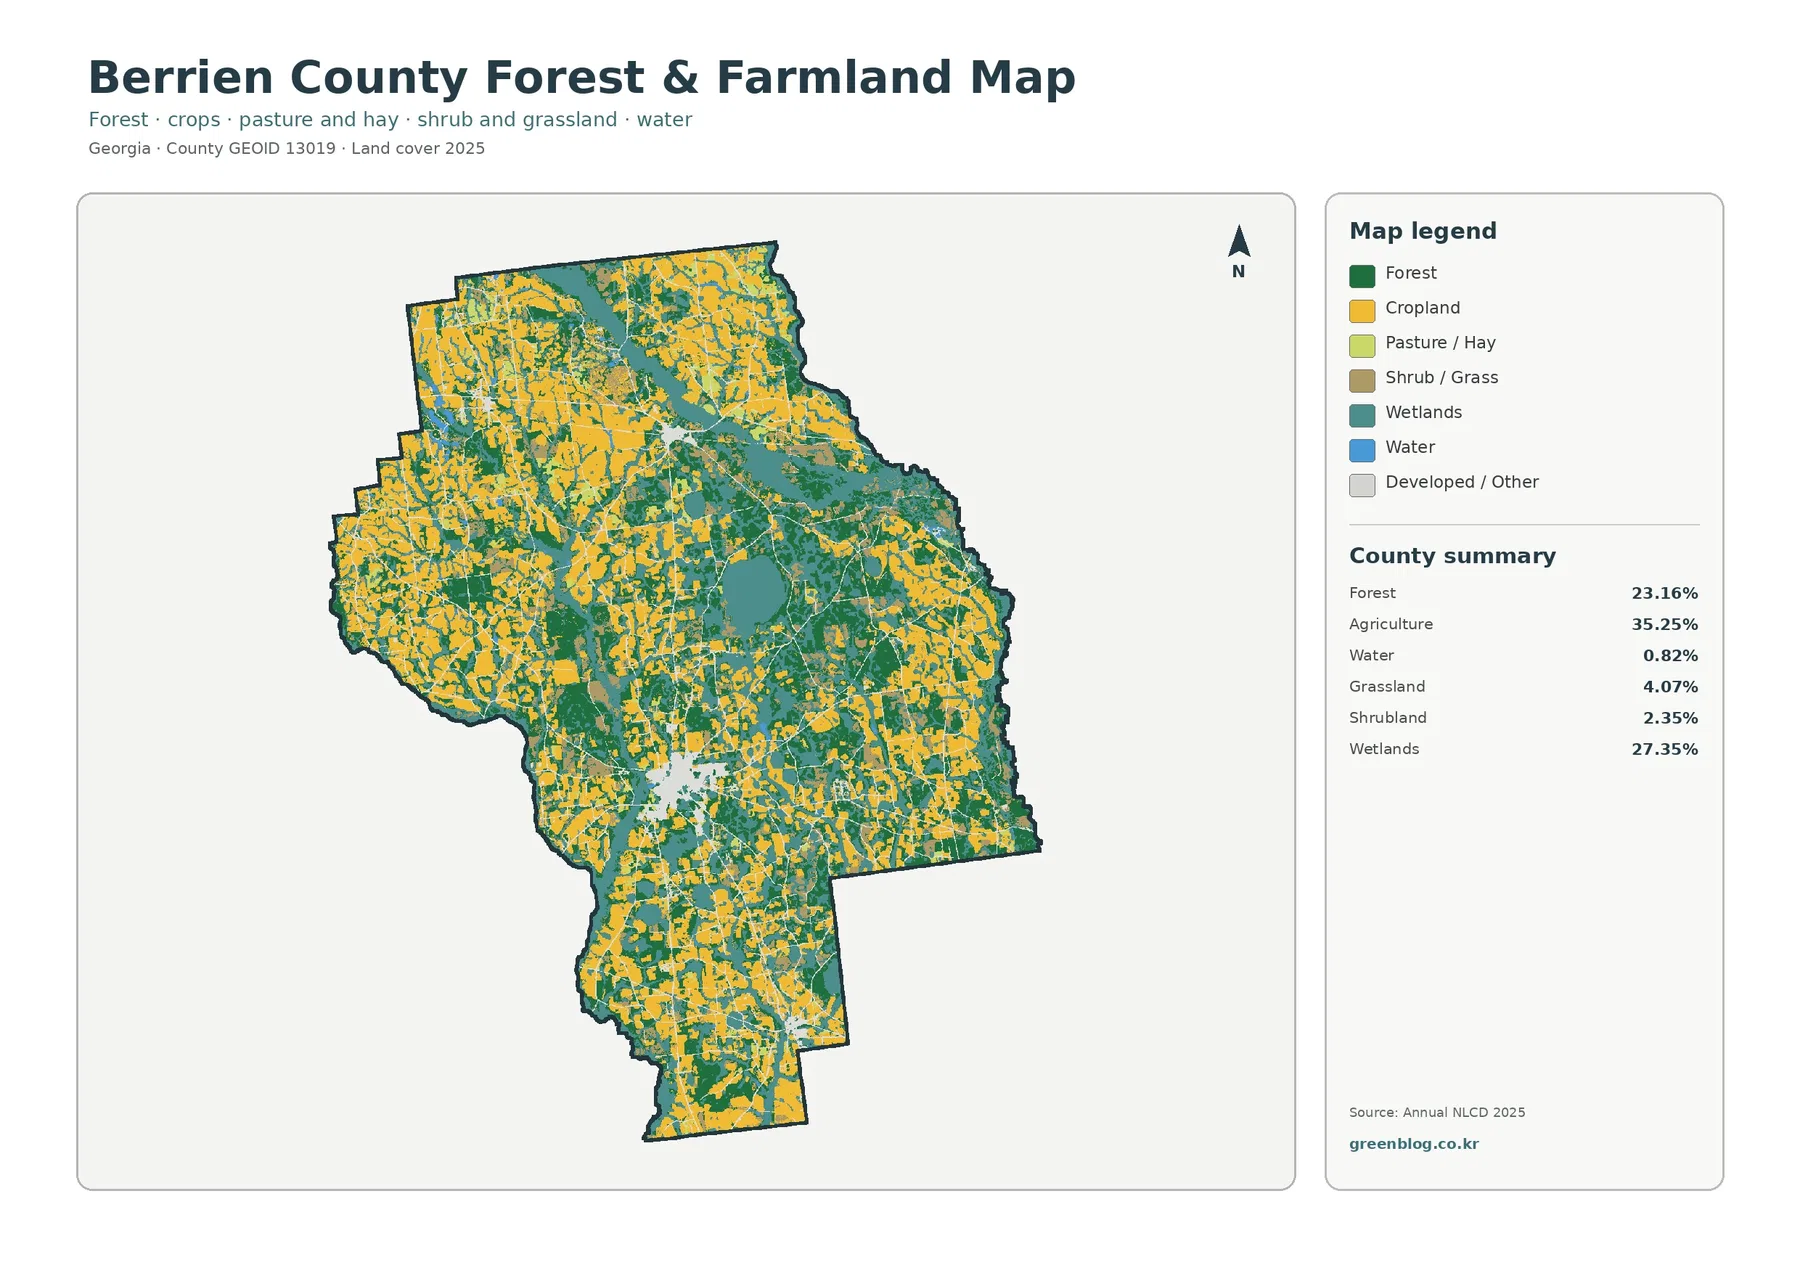
The vegetation-focused view makes the large farm blocks in the north and west much easier to follow. Cropland remains visible throughout the county, but central and eastern fields are more frequently divided by forest and wetlands. Pasture or hay is shown separately in the legend and occurs among those agricultural areas, while developed land is faded to keep the rural pattern prominent.
The package provides one verified agriculture total of 35.25%. Cropland and pasture or hay are visually distinct, but exact percentages for those subtypes are not supplied. Estimating their shares by counting colored pixels would create new statistics that the package does not support. Their locations and relative extent are the appropriate points to compare.
UGA Extension Berrien County provides agriculture and natural-resources programs and works with crop specialists on local field trials. Its recent impact information describes a 2025 peanut fungicide trial carried out in a non-irrigated field to compare disease-management programs. That is useful county-specific evidence of active production agriculture, but it does not identify any particular yellow raster cell as a peanut field.
Grassland contributes 4.07% and shrubland 2.35%. These classes appear in smaller patches among farms, woods, wetlands, and developed areas. Their presence is useful because it shows that open-looking rural land is not automatically agricultural. At county scale, several real surface types can occur within a small area even though each raster cell receives one representative class.
A 1.30% mean impervious value shows how lightly hardened most of the county remains
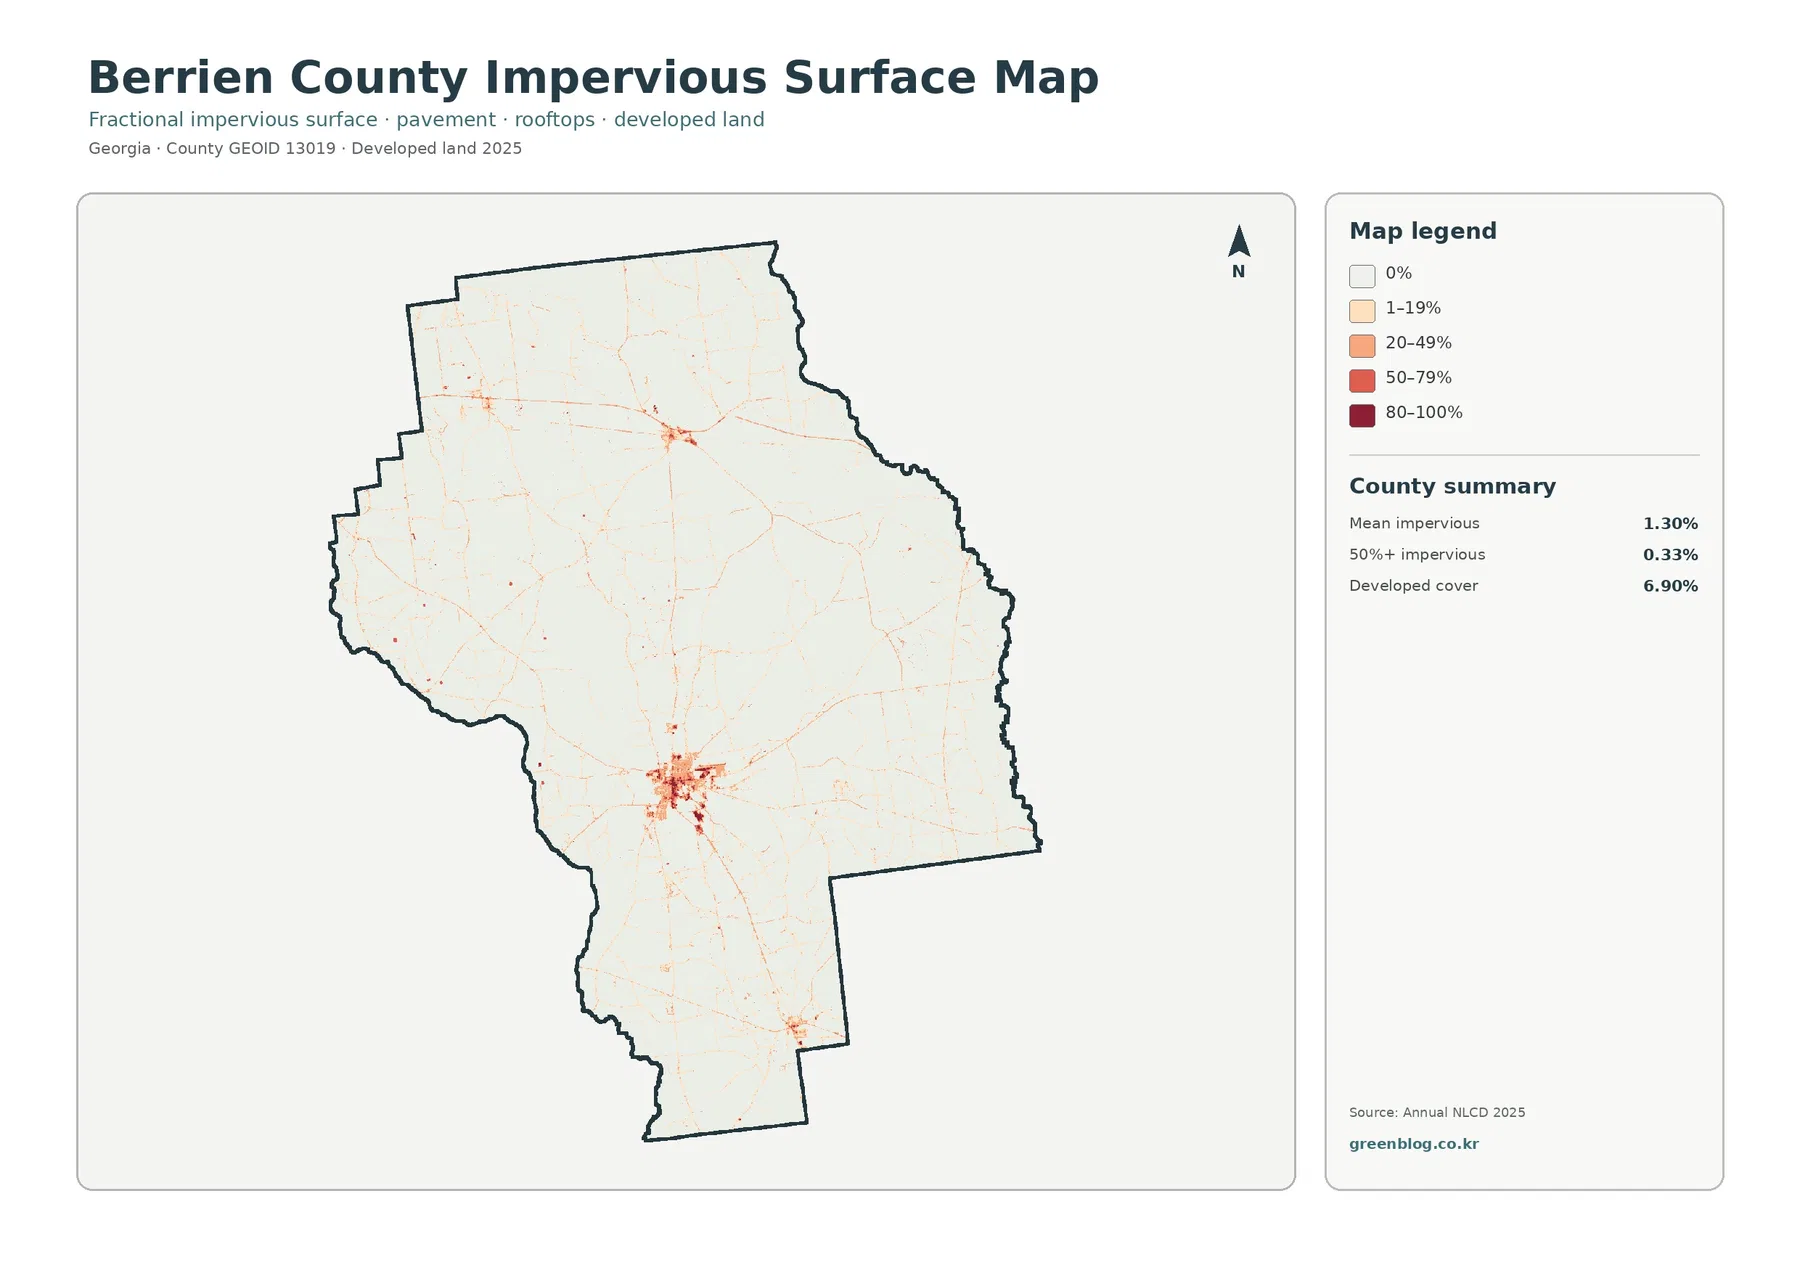
Impervious surface refers to rooftops, pavement, parking areas, and other hard materials that do not readily absorb rainfall. Berrien County’s mean impervious cover is 1.30%, and only 0.33% of the county is mapped at 50% or greater impervious surface. Both values are far below the 6.90% developed-land share because developed areas can also contain lawns, trees, soil, and other permeable ground.
The darkest reds are tightly grouped in the main south-central developed area. Thin high-value traces extend in several directions, and smaller concentrations appear farther north and south. In contrast, most farm, forest, and wetland areas remain near the lightest end of the legend. The map makes clear that hard-surfaced land is highly localized within an otherwise rural county.
Narrow red traces may coincide with roads, but this is not a transportation map. Route names, traffic counts, lane numbers, and ownership are not part of the layer. Impervious percentage also should not be used as a flood-risk score because rainfall, soils, drainage, streams, wetlands, and topography influence runoff separately.
Forest-loss differences dominate the named categories in the 1985–2025 comparison
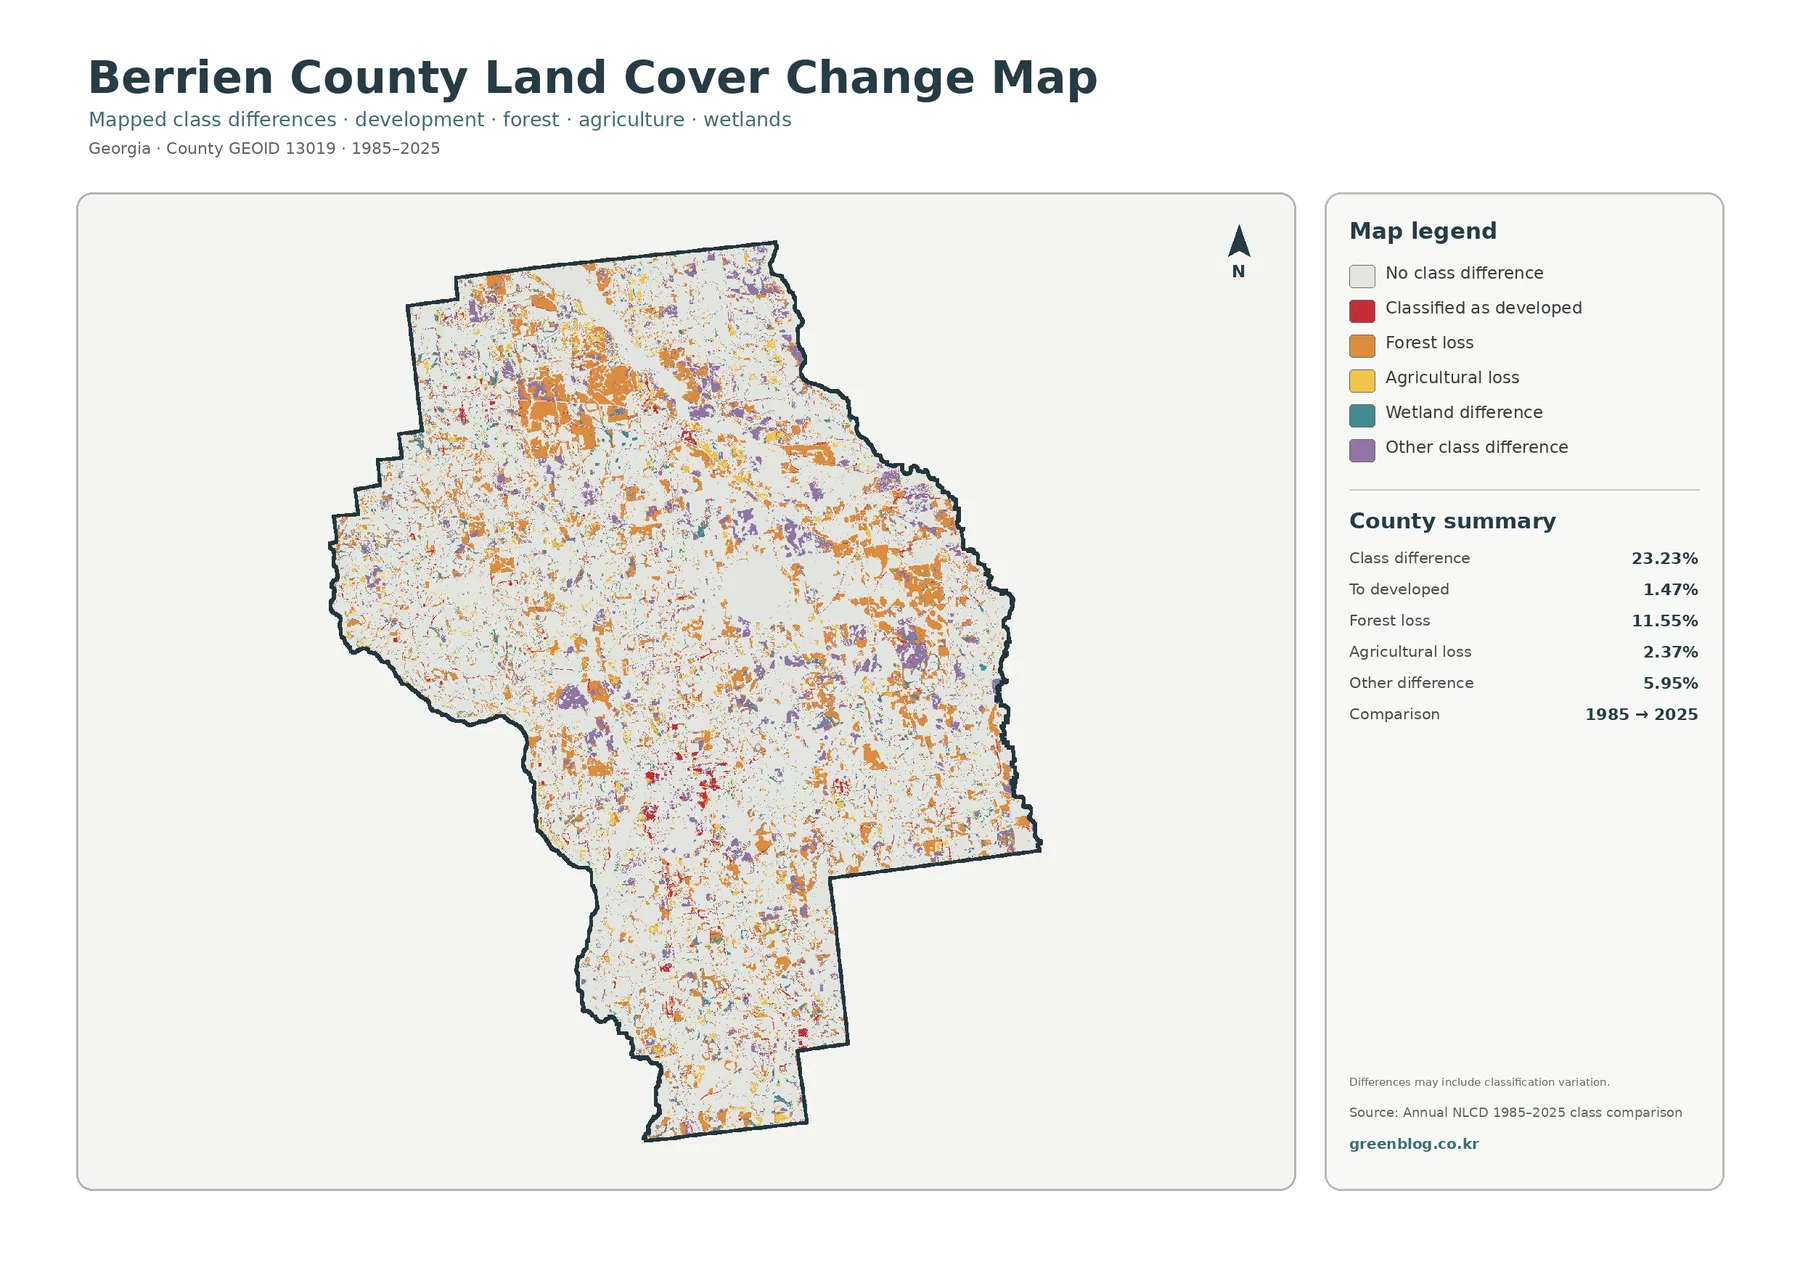
The total class difference between 1985 and 2025 is 23.23%. That percentage is not a direct measure of the land area that was physically transformed. It identifies grid cells assigned different land-cover classes at the two endpoints. Real land change can contribute, but seasonal imagery, mixed cells, and classification methods may also affect whether a location receives the same label in both years.
Forest loss is 11.55%, the largest supplied change component. Orange areas are widespread through the north, east, center, and parts of the south. The 23.16% current forest share and the 11.55% forest-loss category should remain separate: one describes the 2025 endpoint, while the other belongs to the two-date comparison.
Agricultural loss accounts for 2.37%, cells classified as developed for 1.47%, and other class difference for 5.95%. Red developed differences occur mostly around the current main developed area and several smaller settlements, whereas purple other differences are more broadly scattered. Wetland difference is shown in the legend but does not have a separate verified percentage in the summary.
Adjacent colors do not establish a cause. Forest-loss cells beside agricultural or developed differences could reflect land conversion, but forestry activity, vegetation recovery, moisture conditions, weather, or classification effects may also matter. Explaining any one site reliably requires imagery from additional years or local land-use documentation.
Current cover and endpoint differences should not be turned into new rates
Agriculture offers a simple example. The county is 35.25% agricultural in 2025, while 2.37% belongs to the agricultural-loss category in the endpoint comparison. Adding or subtracting those numbers would not reconstruct a valid 1985 agriculture share because the comparison map is not a complete accounting table for every transition.
The same separation is necessary when discussing developed land. Current developed cover is 6.90%, mean impervious cover is 1.30%, and the developed category in the two-date comparison is 1.47%. Those figures describe current extent, current hard-surface intensity, and endpoint classification difference respectively. Treating them as a single growth statistic would mix separate measurements.
Wetlands and open water also need to be read as separate categories. Wetlands occupy 27.35%, while open water is only 0.82%. A reader who focuses only on blue water would miss most of the county’s wet environment because the far larger share is mapped as wetland rather than open water.
For a presentation, begin with the farm-wetland balance and Nashville-area development
The 2025 overview is the strongest opening image for a county profile because it puts broad farm areas, wetlands, forest, and the main developed concentration in one frame. A rural-land discussion can then move to the forest-and-farmland view, where the county’s agricultural pattern and wetland-forest interruptions are easier to follow.
If the topic is development intensity, the impervious map is more informative than the developed percentage alone. The change map belongs later, after the reader understands that its colors represent endpoint differences rather than current cover. Comparisons with another Georgia county should use the same observation year and classification system whenever possible.
Raster land cover is not a city-limit, zoning, or parcel map
Annual NLCD divides the landscape into grid cells and assigns one representative cover class to each. A real location can contain crops, trees, wet ground, a road, a building, grass, and bare soil within a small area, while the raster simplifies that mixture. The mixed edges around Nashville and the irregular boundaries between fields, forest, and wetlands should therefore be read as generalized.
A developed cell does not define a municipal boundary or a building permit, an agricultural cell is not a legal farm zoning district, and forest or wetland colors do not establish ownership or regulatory status. Property and planning questions require Berrien County and municipal planning, parcel, or zoning records rather than the land-cover layer.
The four source JPGs in this package are each provided at 2480×1754 pixels. Enlarging them can improve visibility of smaller patterns but cannot create detail beyond the underlying source. The package manifest does not flag these files as meeting its A3 high-resolution reference. These files work well for screens, presentations, routine printouts, and county comparisons, while large-format printing should be tested at the intended size first.
Frequently Asked Questions
What is the largest 2025 land-cover class in Berrien County?
Agriculture is the largest class at 35.25%, followed by wetlands at 27.35% and forest at 23.16%. Developed land is 6.90%. Farm cover is especially broad in the north and west, while wetland and forest colors are more prominent through the center and east.
Why is developed land 6.90% while mean impervious cover is only 1.30%?
Developed land can contain lawns, trees, soil, and other permeable ground around buildings and roads. The impervious layer narrows that broader developed area to harder surfaces such as roofs and pavement. Only 0.33% of the county is mapped at 50% or greater impervious surface, so the hardest surfaces are concentrated in a much smaller area.
Does the 23.23% class difference equal the area that physically changed?
No. Instead, 23.23% is the portion of grid cells whose assigned classes differ between the 1985 and 2025 endpoints. Supplied components include 1.47% classified as developed, 11.55% forest loss, 2.37% agricultural loss, and 5.95% other difference. Because classification effects can contribute to the result, explaining a specific location requires additional evidence.
Sources and Reference Data
- MRLC Annual NLCD Data – annual source data for Berrien County’s 2025 map and 1985–2025 endpoint comparison.
- USGS Annual NLCD Land Cover Classification – definitions for agriculture, wetlands, forest, developed land, and other mapped classes.
- U.S. Census Bureau TIGER/Line Shapefiles – official county-boundary reference for Berrien County.
- UGA Extension Berrien County – Our Impact – county-specific agriculture, crop-trial, and natural-resources context.
- Georgia DCA – Berrien County Comprehensive Plan – official planning resources for Berrien County, Alapaha, Enigma, Nashville, and Ray City.
Map File Information
The ZIP contains four original JPG maps covering Berrien County's 2025 land cover, forest and farmland, impervious surface, and 1985–2025 class differences.
- Included Files: Use only the versions confirmed in the article and supplied images
- File Type: Use the confirmed download contents
- Intended Use: Printing, education, presentations, and map-based projects
Related Maps
- Appling County Georgia Land Cover Map
- Atkinson County Georgia Land Cover Map
- Bacon County Georgia Land Cover Map
Green Map creates custom-edited map images using open geographic data sources such as geoBoundaries, Natural Earth, OpenStreetMap, and government open data.
These maps are edited visual materials, not raw data files, and are provided for education, documents, presentations, and graphic reference.