The Banks County Georgia Land Cover Map is overwhelmingly wooded, but it also contains a clear contrast between rural interior areas and a stronger developed concentration near the southeastern edge. Forest represents 57.67% of the 2025 summary, agriculture 24.52%, and developed land 10.37%. Wetlands account for 3.15%, grassland 2.22%, shrubland 1.35%, and open water 0.55%. Farm openings are scattered through the forest, while the most noticeable built-up area sits apart from the smaller central settlements.
Four views are available on this page: the 2025 land-cover overview, forest and farmland, impervious surface, and a 1985–2025 endpoint comparison. The article uses WebP previews for quick reading, and the four original JPG maps are bundled in one download below. Reading them together makes it possible to separate the broad forest-and-farm landscape from the harder built surfaces around Homer, Banks Crossing, and the I-85 corridor.
Table of Contents
The county looks rural first because forest covers more than half of it
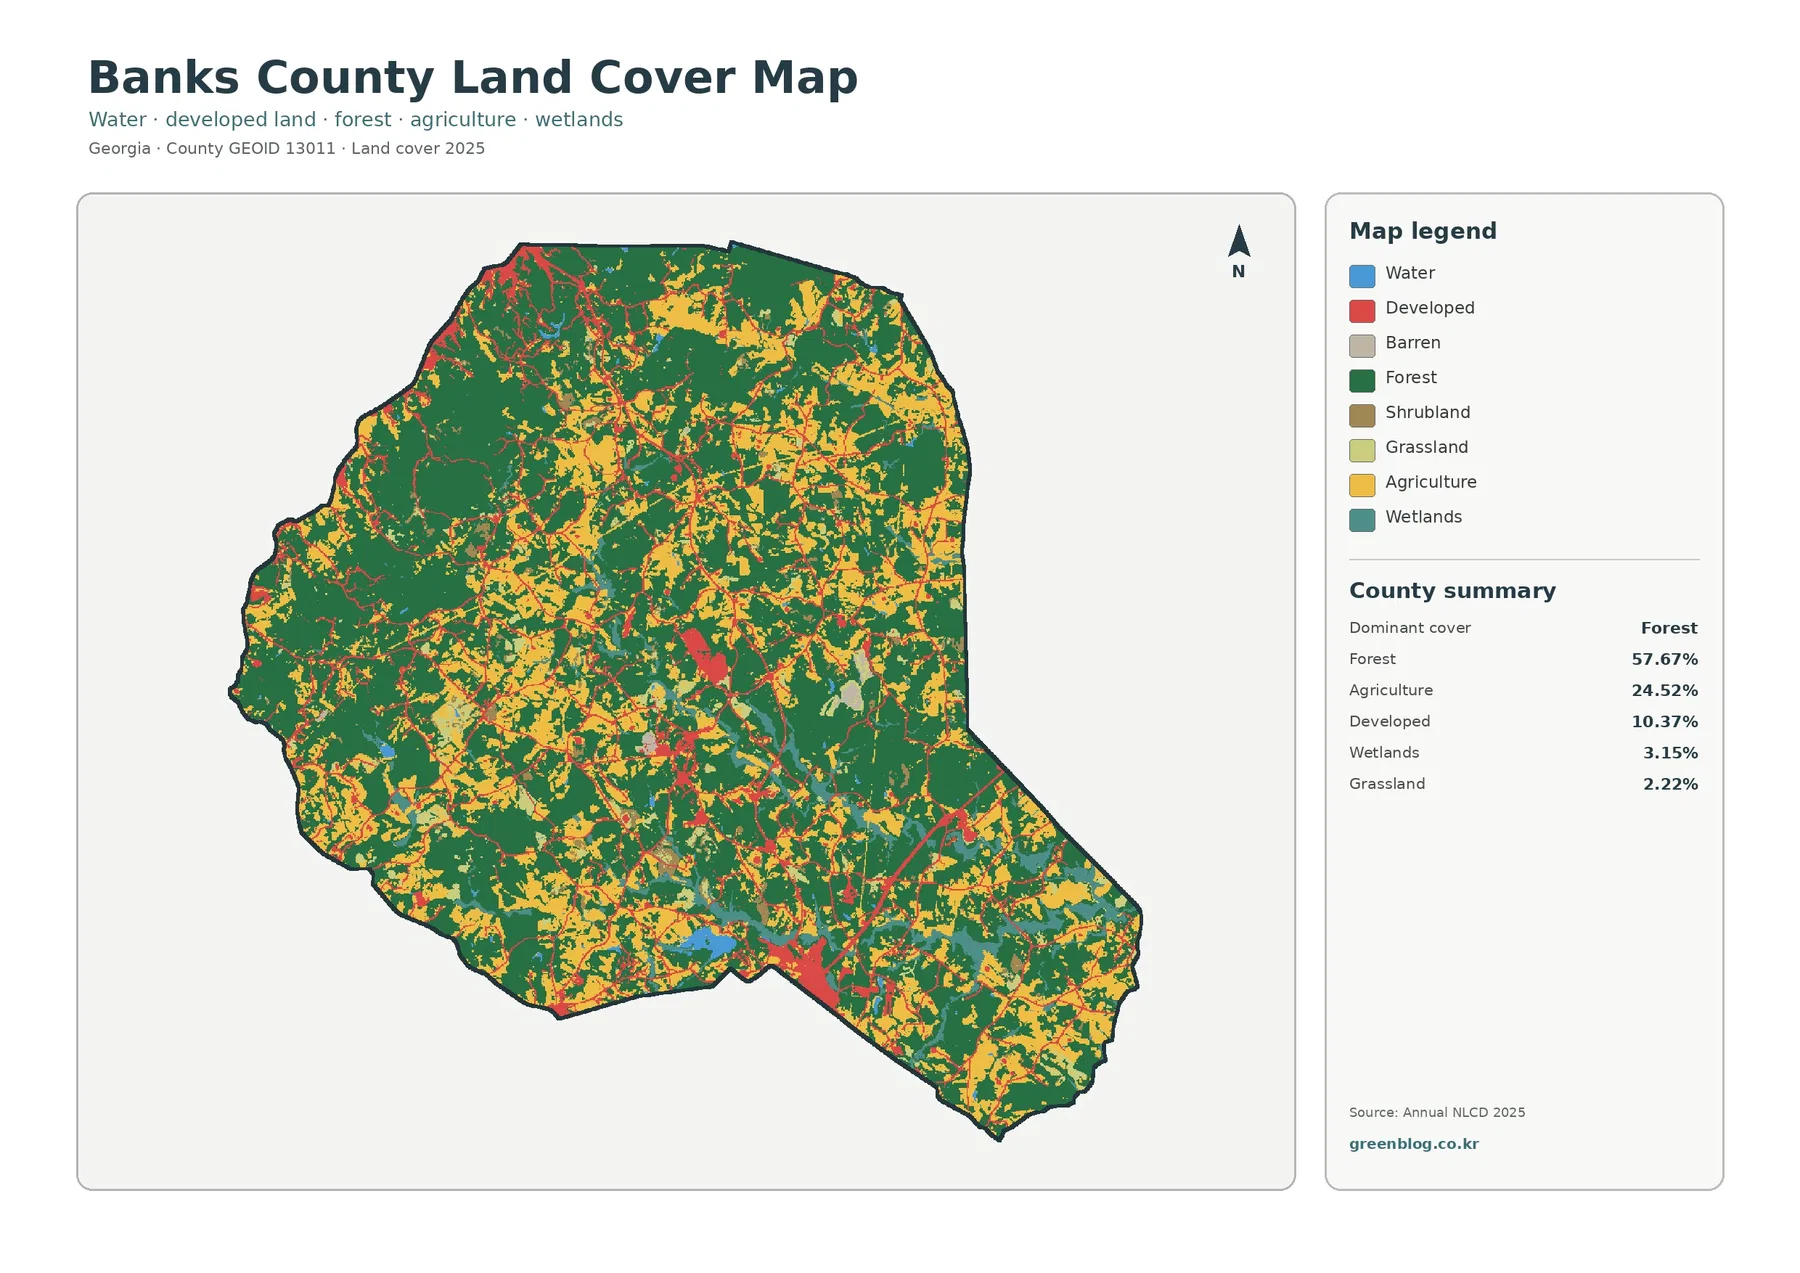
Dark green forms broad blocks across the west and north and remains extensive through the center and east. Even where agriculture becomes more common, wooded cover usually stays close by. The 57.67% forest share therefore matches the visual character of the county: most nonforest places appear as openings or corridors within a much larger wooded setting.
Agriculture is the second-largest class at 24.52%. Yellow fields are especially noticeable in the northeastern and central parts of the county, and more farm blocks occur through the south. The western side is more continuously forested, although small agricultural clearings still appear there. Rather than one continuous farming district, Banks County has fields dispersed among substantial woodland.
Developed land reaches 10.37%, but its distribution is uneven. One smaller concentration sits near the middle of the county, while a more prominent built-up area appears near the southeastern boundary. Georgia’s 2023 comprehensive plan identifies Homer as the county seat near the center and describes the I-85 corridor and Banks Crossing area in the southeast as the county’s main commercial and service hub. That local planning context helps explain why the two developed areas look different on the land-cover map.
Wetlands and open water occupy much smaller shares at 3.15% and 0.55%. Teal wetland patches are scattered through several parts of the county, while blue water features are limited. The county plan still treats waterways and floodplains as important environmental resources, including areas associated with the Hudson and Grove rivers. Small map percentages therefore should not be confused with low local importance.
Homer and Banks Crossing illustrate two different kinds of developed landscape
Homer lies near the center of Banks County and is the only municipality described by the county plan as being wholly inside the county. On the land-cover map, the central developed area is compact and immediately surrounded by forest and agricultural cover. That pattern fits a small county-seat setting rather than a broad continuous urban zone.
Banks Crossing is different. The comprehensive plan places it around the U.S. 441 and I-85 interchange and identifies it as a retail, service, and employment center. On the map, the southeastern developed cluster is both stronger and more concentrated than the central one. The impervious-surface view reinforces that contrast by showing some of the county’s highest hard-surface values in the same general area.
Land cover alone cannot identify whether a red cell is a store, home, warehouse, road, or industrial site. It only places the surface in a broad developed category. The planning document provides a trustworthy explanation of the surrounding area, but parcel use, municipal boundaries, and development rights require separate local records.
With development faded, the west becomes an especially strong forest block
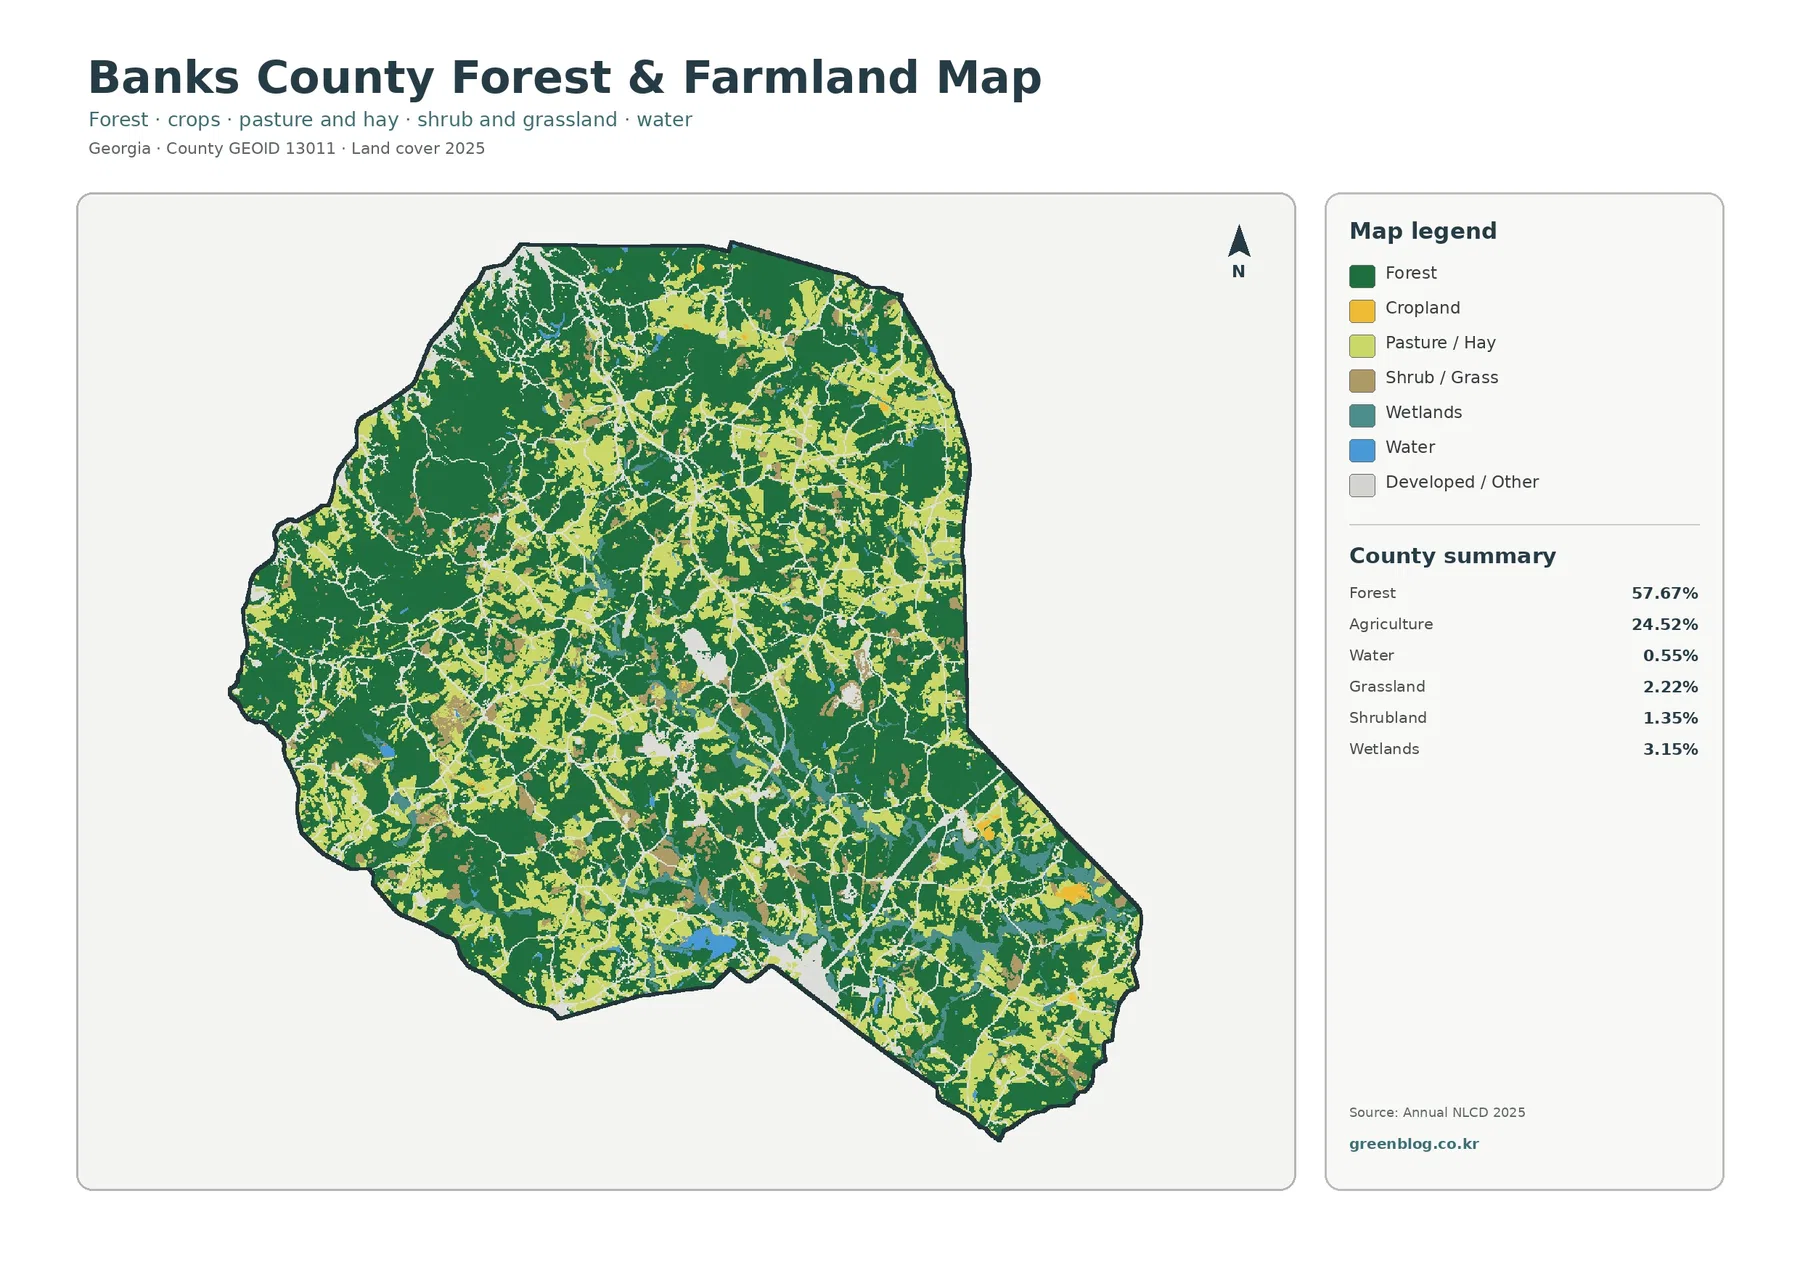
The vegetation-focused view makes the western half look even more heavily wooded because developed surfaces are pushed into the background. Agricultural colors become easier to follow through the center, northeast, and south. Some areas show cropland, others pasture or hay, but the overall impression is one of rural land broken into fields and wooded tracts rather than large uninterrupted agricultural plains.
The package provides a verified agriculture total of 24.52%. It does not provide separate county percentages for cropland and pasture or hay even though the legend displays those colors independently. Their distribution can be discussed, but a new percentage should not be calculated by estimating the colored areas from the image.
UGA Extension Banks County lists agriculture programming and research opportunities, conservation and management of natural resources, and water quality among its local initiatives. That is useful county-specific context for a map where forest and agriculture together account for more than four fifths of the land-cover summary. The Extension page does not turn individual map cells into crop types or forest-management units, so those finer claims should remain separate.
Grassland accounts for 2.22% and shrubland 1.35%. Those smaller open-vegetation classes appear around farm edges, forest openings, and developed areas. They help explain why not every light-colored rural patch belongs to agriculture. At this scale, a narrow strip or small patch should be treated as generalized cover rather than a surveyed field boundary.
Hard surface remains low countywide even though the I-85 area is visually intense
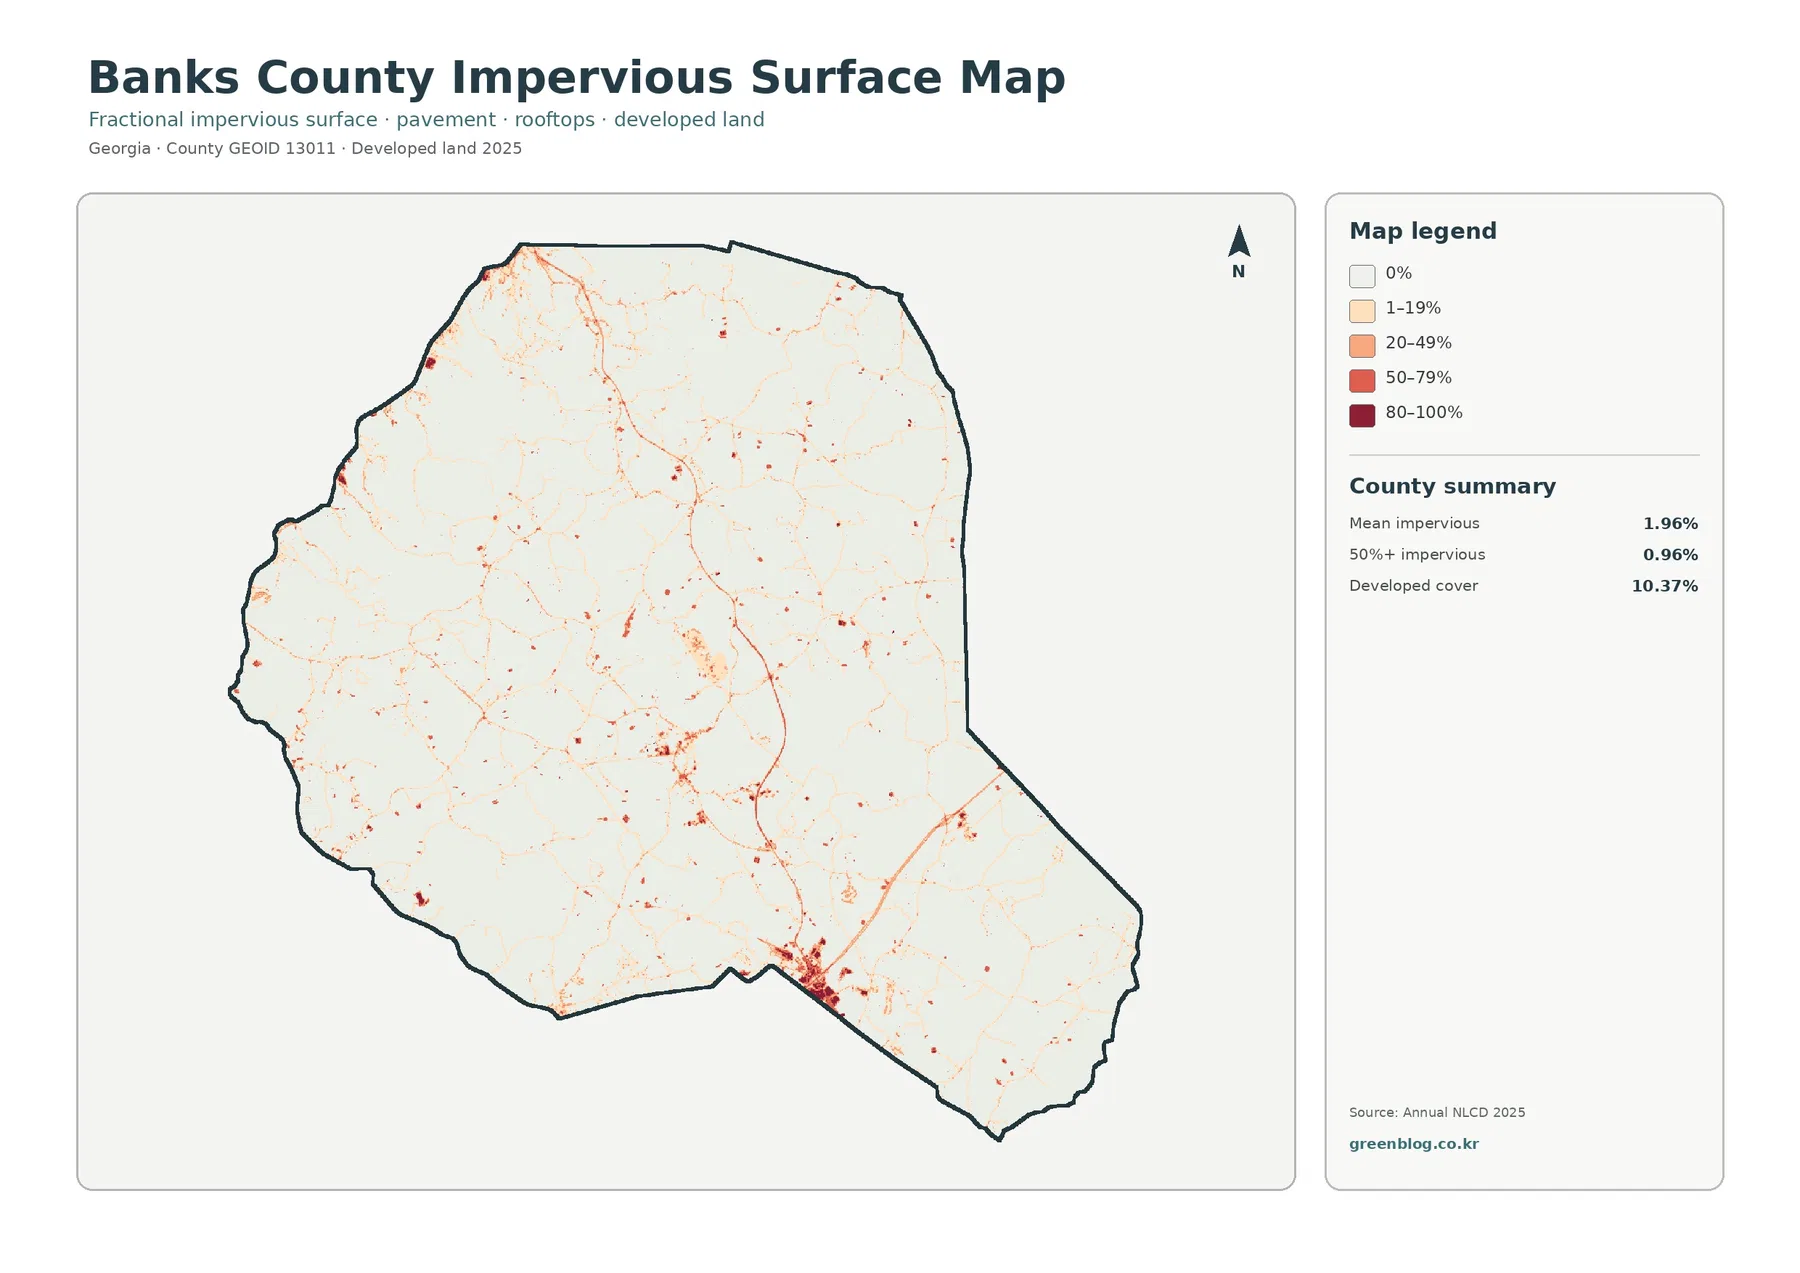
Mean impervious cover is 1.96%, and 0.96% of Banks County is mapped at 50% or greater impervious surface. Impervious cover refers to hard materials such as rooftops, pavement, and parking areas that do not readily absorb rainfall. The broader developed class is 10.37% because it also includes lawns, trees, soil, and other permeable ground inside developed settings.
The strongest hard-surface cluster appears near the southeastern edge, where Banks Crossing is located along I-85 and U.S. 441. A smaller concentration is visible near the county center, and thin orange traces connect several settled areas. Large western and northern forest tracts remain close to the lowest values. This contrast helps separate a visually important commercial interchange from the much larger rural county around it.
Several thin impervious lines resemble transportation corridors, but the layer is not a road map. It contains no route labels, lane counts, traffic volumes, or pavement-condition data. Official planning information can identify I-85 and U.S. 441 as important corridors, while the impervious map is better used to show where hard surfaces concentrate around those corridors.
The 1985–2025 comparison records a 26.70% class difference
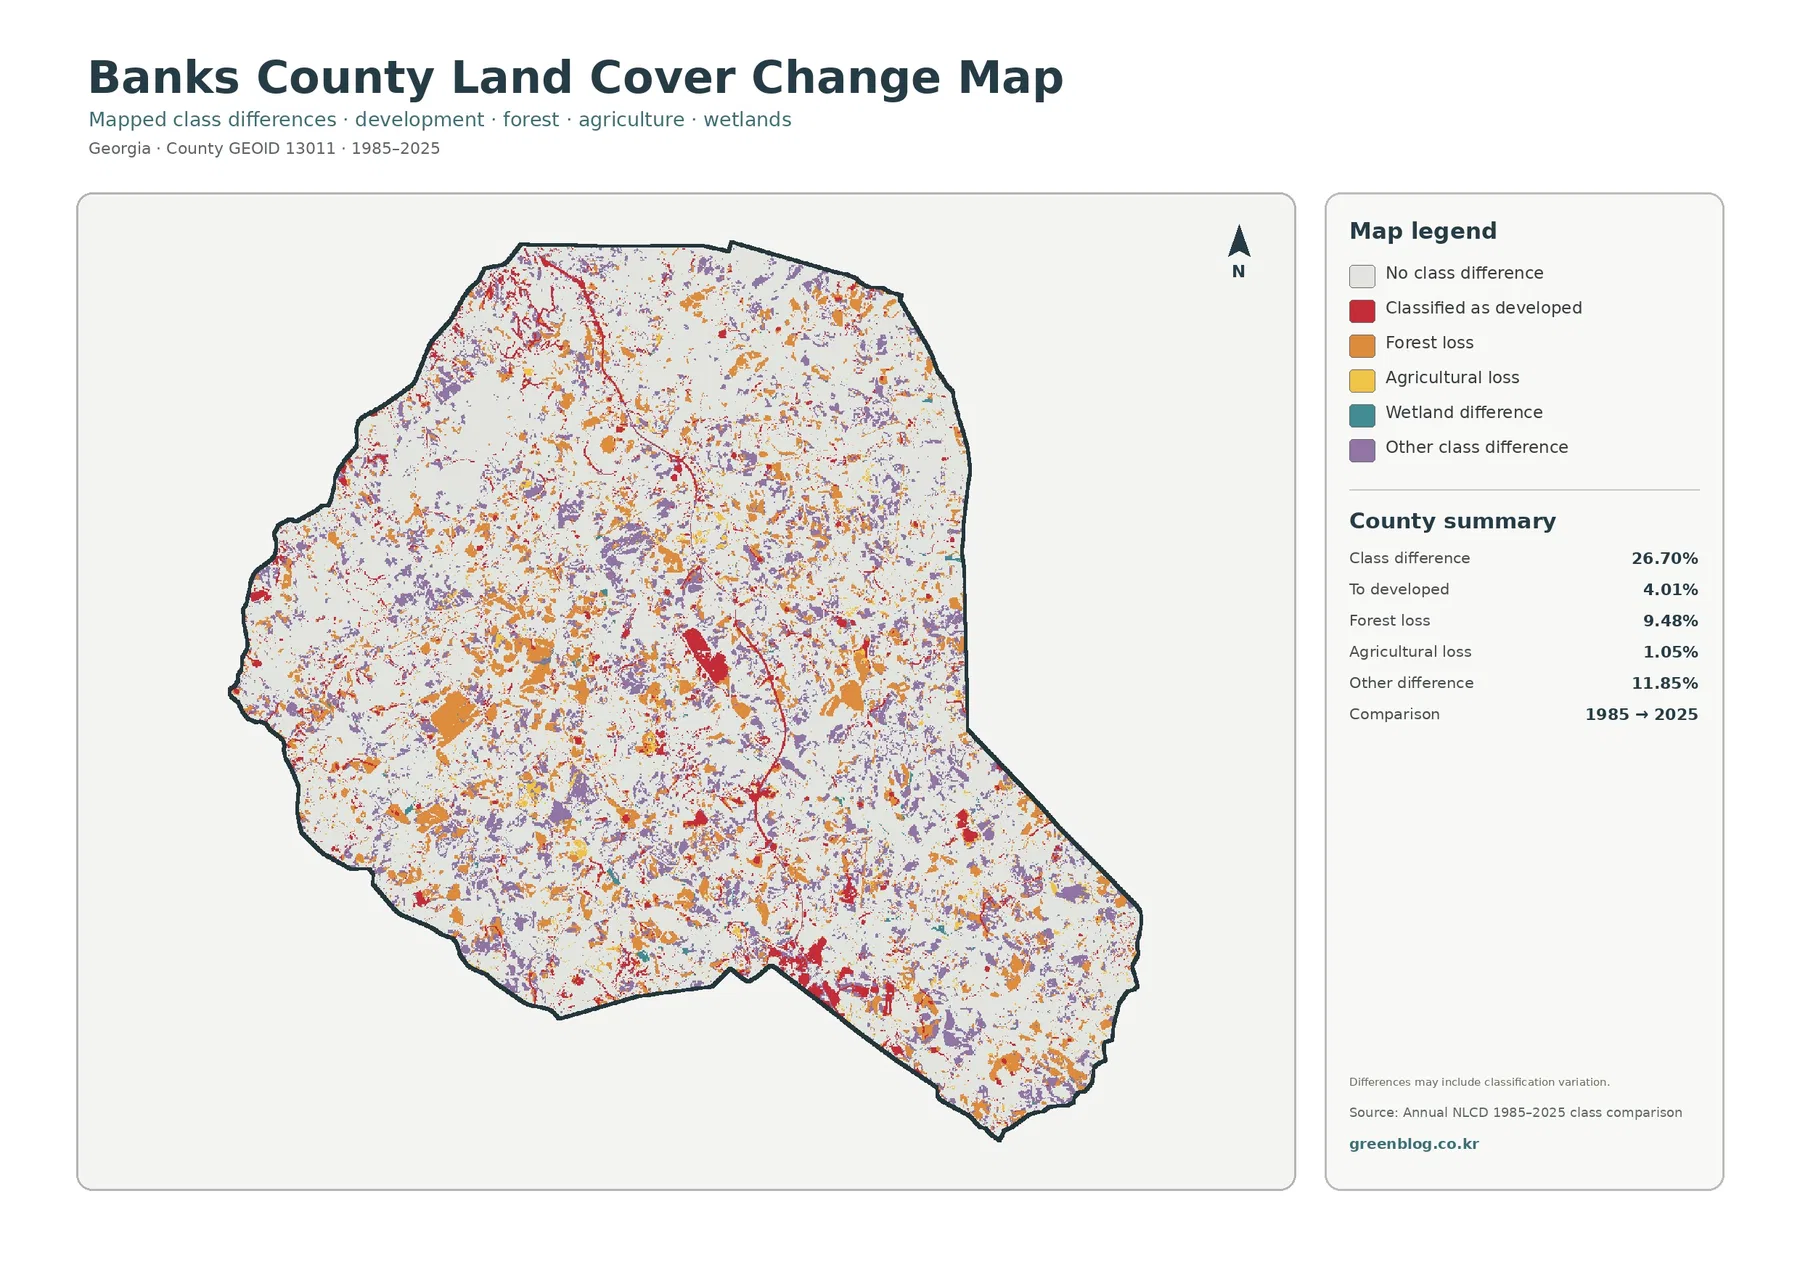
The endpoint comparison reports a 26.70% class difference. That number is not a direct measurement of the county area that was physically converted from one land use to another. It represents cells whose 1985 and 2025 land-cover classifications do not match. Real land change can be included, but image conditions, season, classification rules, and mixed cells can also influence the result.
Forest loss is listed at 9.48%. Orange cells appear across the west, north, center, and south rather than forming one isolated zone. The “to developed” category is 4.01% and is more noticeable near the southeastern developed cluster, the county center, and several connecting traces. Agricultural loss is 1.05%, while other class difference is 11.85%, the largest supplied comparison component.
Wetland difference appears in the legend without a separate verified percentage in the county summary. It is reasonable to describe visible locations, but not to invent a rate from the image. The same caution applies to causes: neighboring forest-loss and developed-difference colors show that classifications changed near one another, not that one change necessarily caused the other.
Current forest, current development, and endpoint differences should not be combined
Forest provides a clear example. The 57.67% figure measures forest in 2025, whereas 9.48% belongs to a forest-loss category in a comparison between 1985 and 2025. Subtracting one from the other would not recreate the earlier forest share because the endpoint map does not function as a complete accounting table for every gain and loss.
Development has three different measurements in this package. Developed cover is 10.37%, mean impervious surface is 1.96%, and the developed endpoint-difference category is 4.01%. The first describes the area mapped as developed today, the second measures hard-surface intensity, and the third marks a type of difference between the two dates. Keeping them separate is especially important when discussing growth around Banks Crossing.
The maps are most useful when rural Banks County and the I-85 corridor are compared separately
For a countywide introduction, the 2025 overview works well because it shows how a forest majority contains farm openings and a few concentrated developed areas. A reader focused on rural land can move next to the forest-and-farmland view, where the western woodland and eastern agricultural pattern are easier to follow without the visual weight of developed classes.
The impervious map is the stronger choice for discussing Banks Crossing because it distinguishes a hard-surface concentration from the broader developed class. The 2023 county plan similarly treats the I-85 corridor as a key development area while emphasizing rural character and agriculture elsewhere. The two sources answer different questions, but together they help explain why development can be locally intense without dominating the countywide land-cover percentages.
The change map belongs later in a presentation or lesson. Its colors describe disagreement between the 1985 and 2025 endpoint classes, not current land cover. When Banks County is compared with another Georgia county, keeping the observation year and classification system consistent prevents changes in data vintage from being confused with geographic differences.
Raster land cover is not a parcel, zoning, or road layer
Annual NLCD divides the landscape into raster cells and assigns one representative land-cover class to each cell. Real ground can contain trees, grass, crops, pavement, buildings, water, and bare soil within a small area, so the mapped class is a simplification. Narrow streams, field edges, small roads, and forest openings are more generalized than they would be in detailed local mapping.
A green forest cell does not establish public ownership, a yellow agricultural cell is not a zoning designation, and a red developed cell does not prove that a parcel can be developed. Questions about property, permitting, or future development around Homer, Banks Crossing, or U.S. 441 require current county planning and parcel sources.
The downloadable source images measure 2480×1754 pixels apiece. Enlarging the image makes small colors easier to inspect but does not add detail beyond the source. The asset record does not mark the files as meeting the package’s A3 high-resolution reference. They remain suitable for screen use, presentations, ordinary handouts, and county-scale comparisons; very large printing should be checked at the intended output size first.
Frequently Asked Questions
What dominates the 2025 Banks County land-cover map?
Forest is the largest class at 57.67%, followed by agriculture at 24.52% and developed land at 10.37%. The west and north are especially wooded, while agricultural openings become more frequent through the center and east. Development is concentrated rather than evenly distributed.
Why does the southeastern development stand out so strongly?
The county’s comprehensive plan identifies Banks Crossing at the I-85 and U.S. 441 interchange as its major retail and service center. The impervious map also shows one of the strongest hard-surface concentrations in that area. Homer has a separate central developed cluster, but it is smaller and more immediately surrounded by forest and farmland.
Does the 26.70% class difference mean that much land physically changed?
No. It is the share of cells whose 1985 and 2025 classifications differ. The supplied components include 4.01% to developed, 9.48% forest loss, 1.05% agricultural loss, and 11.85% other difference. Some of the difference may come from classification variation rather than a simple physical conversion.
Sources and Reference Data
- MRLC Annual NLCD Data – source data for the 2025 land-cover view and the 1985–2025 endpoint comparison.
- USGS Annual NLCD Land Cover Classification – definitions for forest, agriculture, developed land, wetlands, and other classes.
- U.S. Census Bureau TIGER/Line Shapefiles – official county-boundary reference for Banks County.
- UGA Extension Banks County – local agriculture, natural-resource conservation, and water-quality program context.
- Georgia DCA – Banks County Comprehensive Plan – official context for Homer, I-85, Banks Crossing, U.S. 441, rural character, and county waterways.
Map File Information
The ZIP contains four original JPG maps for comparing Banks County's 2025 land cover, vegetation, hard surfaces, and 1985–2025 endpoint differences.
- Included Files: Use only the versions confirmed in the article and supplied images
- File Type: Use the confirmed download contents
- Intended Use: Printing, education, presentations, and map-based projects
Related Maps
- Appling County Georgia Land Cover Map
- Atkinson County Georgia Land Cover Map
- Bacon County Georgia Land Cover Map
Green Map creates custom-edited map images using open geographic data sources such as geoBoundaries, Natural Earth, OpenStreetMap, and government open data.
These maps are edited visual materials, not raw data files, and are provided for education, documents, presentations, and graphic reference.