Indian River County has a clear east-to-west contrast in the 2025 land-cover data. Wetlands account for 34.08% and agriculture for 30.94%, while developed land becomes much more prominent toward the Atlantic side of the county. Water also occupies a substantial 11.89%, so the countywide picture combines inland working land and wetlands with a more developed coastal side.
This page provides four views of the same county: 2025 land cover, forest and farmland, impervious surface, and mapped class differences from 1985 to 2025. The WebP images are intended for on-page viewing, and the four original JPG maps can be downloaded together in one ZIP. Using the views side by side is especially helpful here because no single map captures the full contrast between the lagoon-side communities and the broad inland landscape.
Table of Contents
The countywide map is split between broad wetlands, farm blocks, and an eastern developed side
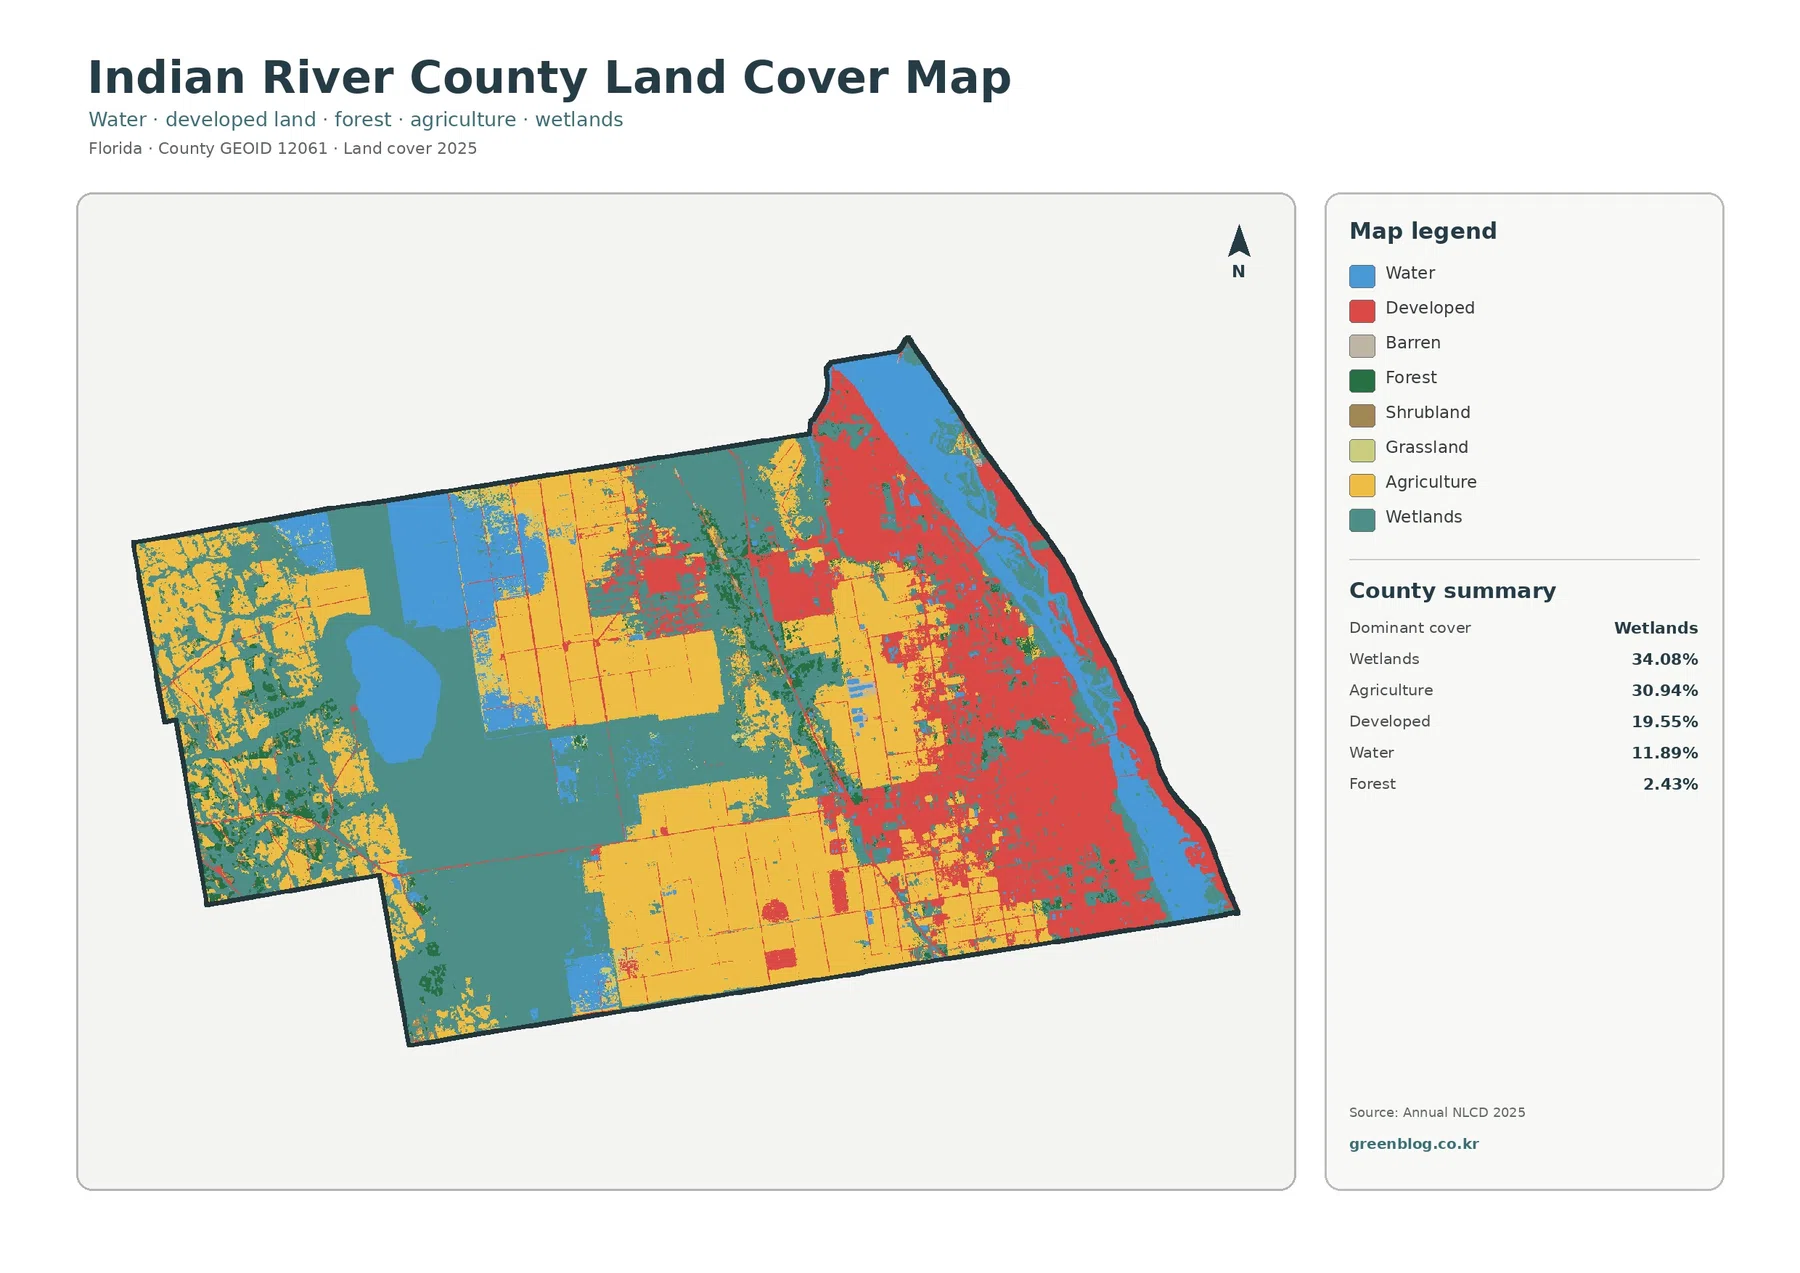
Wetlands are the largest mapped class at 34.08%. They occupy broad areas through the center and west, with additional wetland cover near water and developed areas in the east. The pattern is not a single isolated wetland block; wet areas repeatedly meet farmland, water, and other cover types. That intermixing is one reason a countywide percentage alone cannot describe where the wetland class actually occurs.
Agriculture is nearly as extensive at 30.94%. Large yellow blocks stand out in the west, south-central part of the county, and several northern interior areas. Many have straighter edges than the surrounding natural classes, which makes the farm pattern easy to recognize at this scale. The classification describes the visible surface category from the land-cover dataset, not legal agricultural zoning, ownership, or a parcel-by-parcel inventory of crop types.
Developed land makes up 19.55% and is strongly weighted toward the eastern side. The broadest red areas occupy the coastal half of the county, while the western interior contains far fewer developed patches. This directional difference matters when presenting Indian River County: an image cropped to the east can make the county appear much more urban than the full map, while an inland crop can hide a substantial share of its population and built surface.
Water covers 11.89%, including the long eastern water corridor and notable inland water bodies. Forest is only 2.43% in the county summary and appears mainly as smaller green areas among wetlands, farms, and other cover. For a first reading, the most useful hierarchy is therefore wetlands and agriculture first, followed by the eastern developed footprint and water rather than trying to make the relatively small forest share the central story.
Impervious surface isolates the built footprint more sharply than the developed class
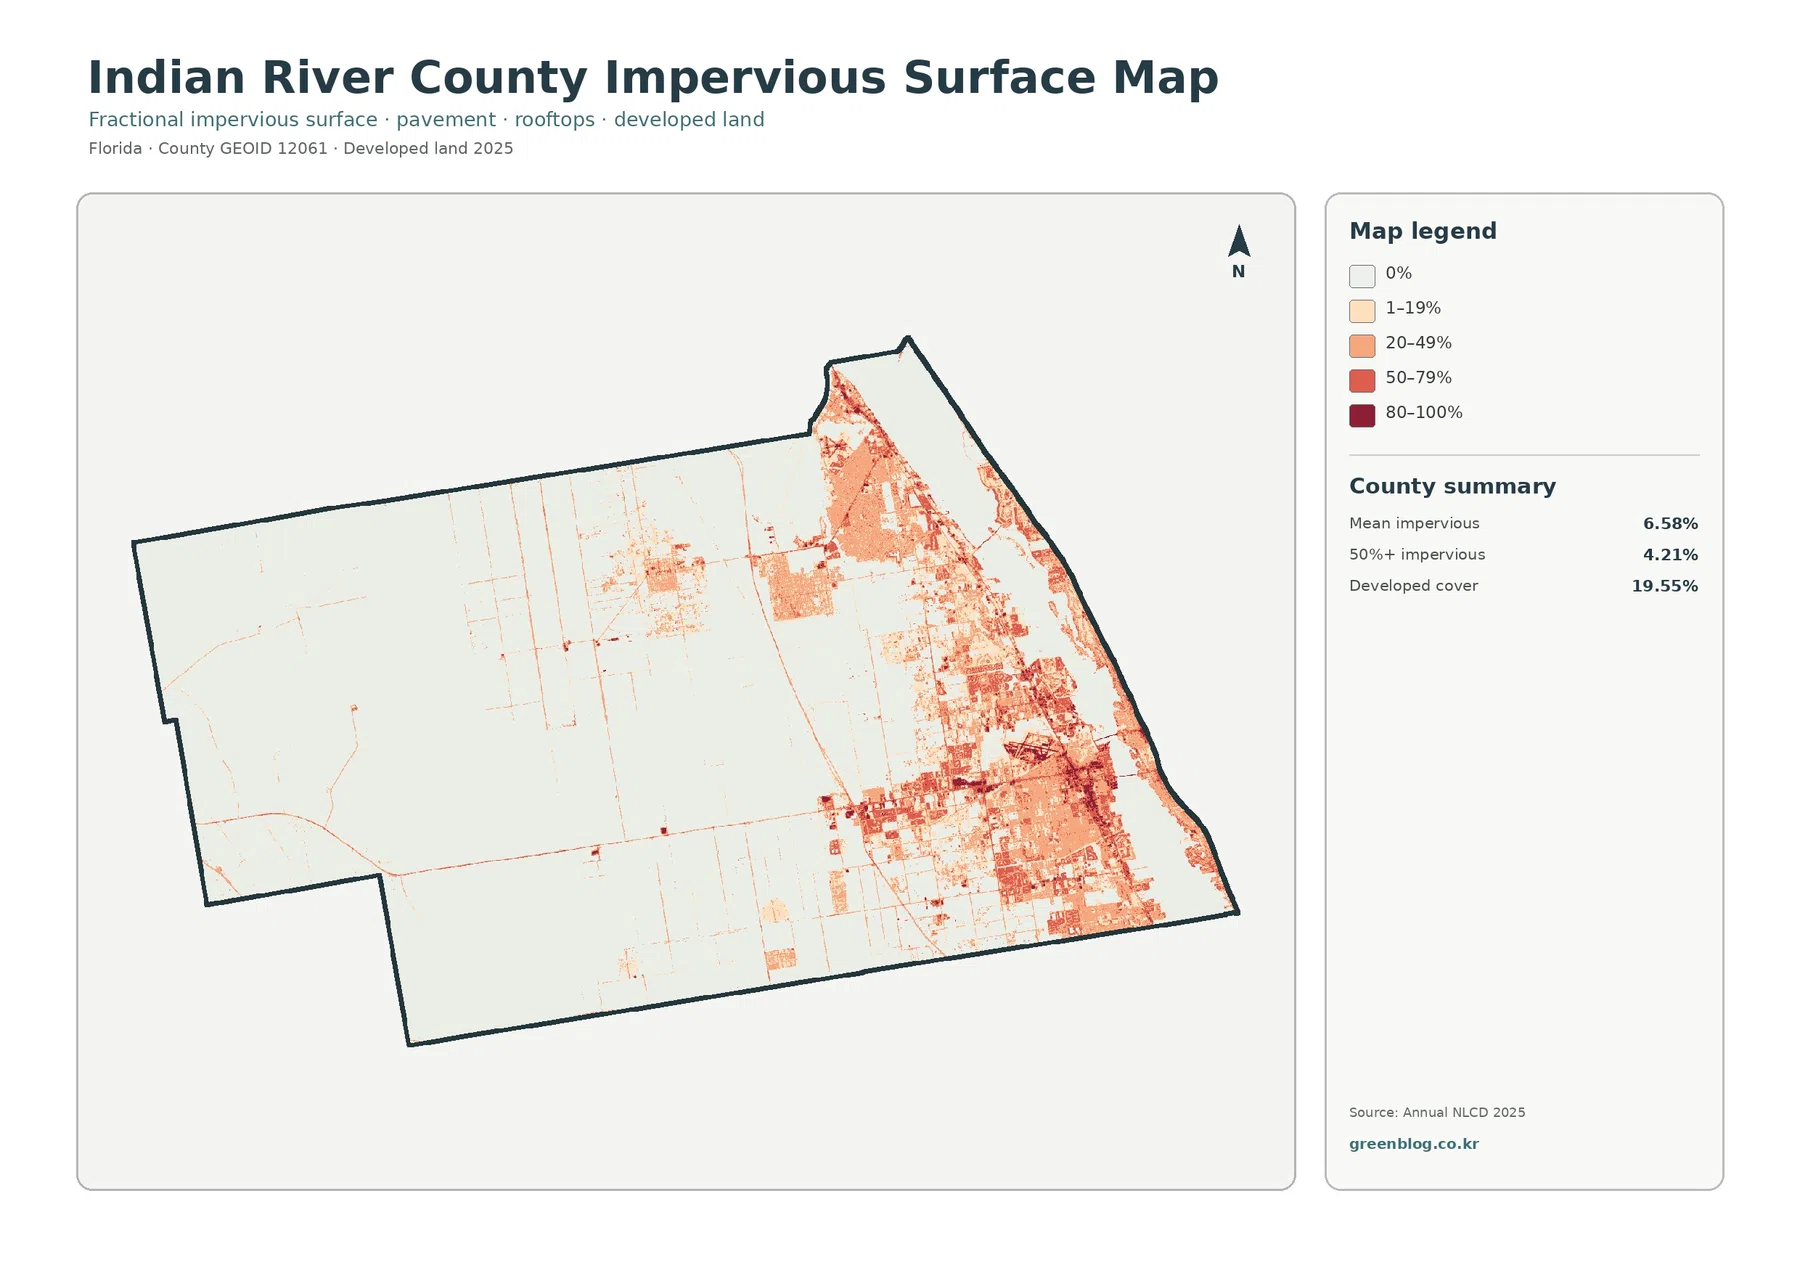
Impervious surface means pavement, rooftops, parking areas, and similar hard surfaces that do not readily absorb rainfall. The countywide mean is 6.58%, and 4.21% of the mapped area is at least 50% impervious. Those numbers are well below the 19.55% developed land-cover share because developed classes can also include lawns, trees, soil, and other permeable surfaces.
The darkest impervious values are concentrated in the east, where the general land-cover map also shows the largest developed areas. A much lighter pattern dominates most of the western interior. Even within the eastern corridor, however, hard surfaces are uneven: dense patches are interspersed with lighter residential or open areas. The map is useful for comparing the intensity of hard surface at a county scale, but it is not detailed enough to trace every individual roof, driveway, or road edge.
Indian River County’s Natural Resources Department manages lagoon and stormwater programs, which provides useful local context for why hard surfaces and water are often studied together. Impervious cover can influence how rainfall reaches drainage systems, but this image is not a runoff or flood-risk model. Soil, elevation, canals, rainfall intensity, and engineered drainage all matter, so the map should be treated as a broad surface indicator rather than a site-specific hazard assessment.
The farm-focused view makes the inland landscape easier to separate from coastal development
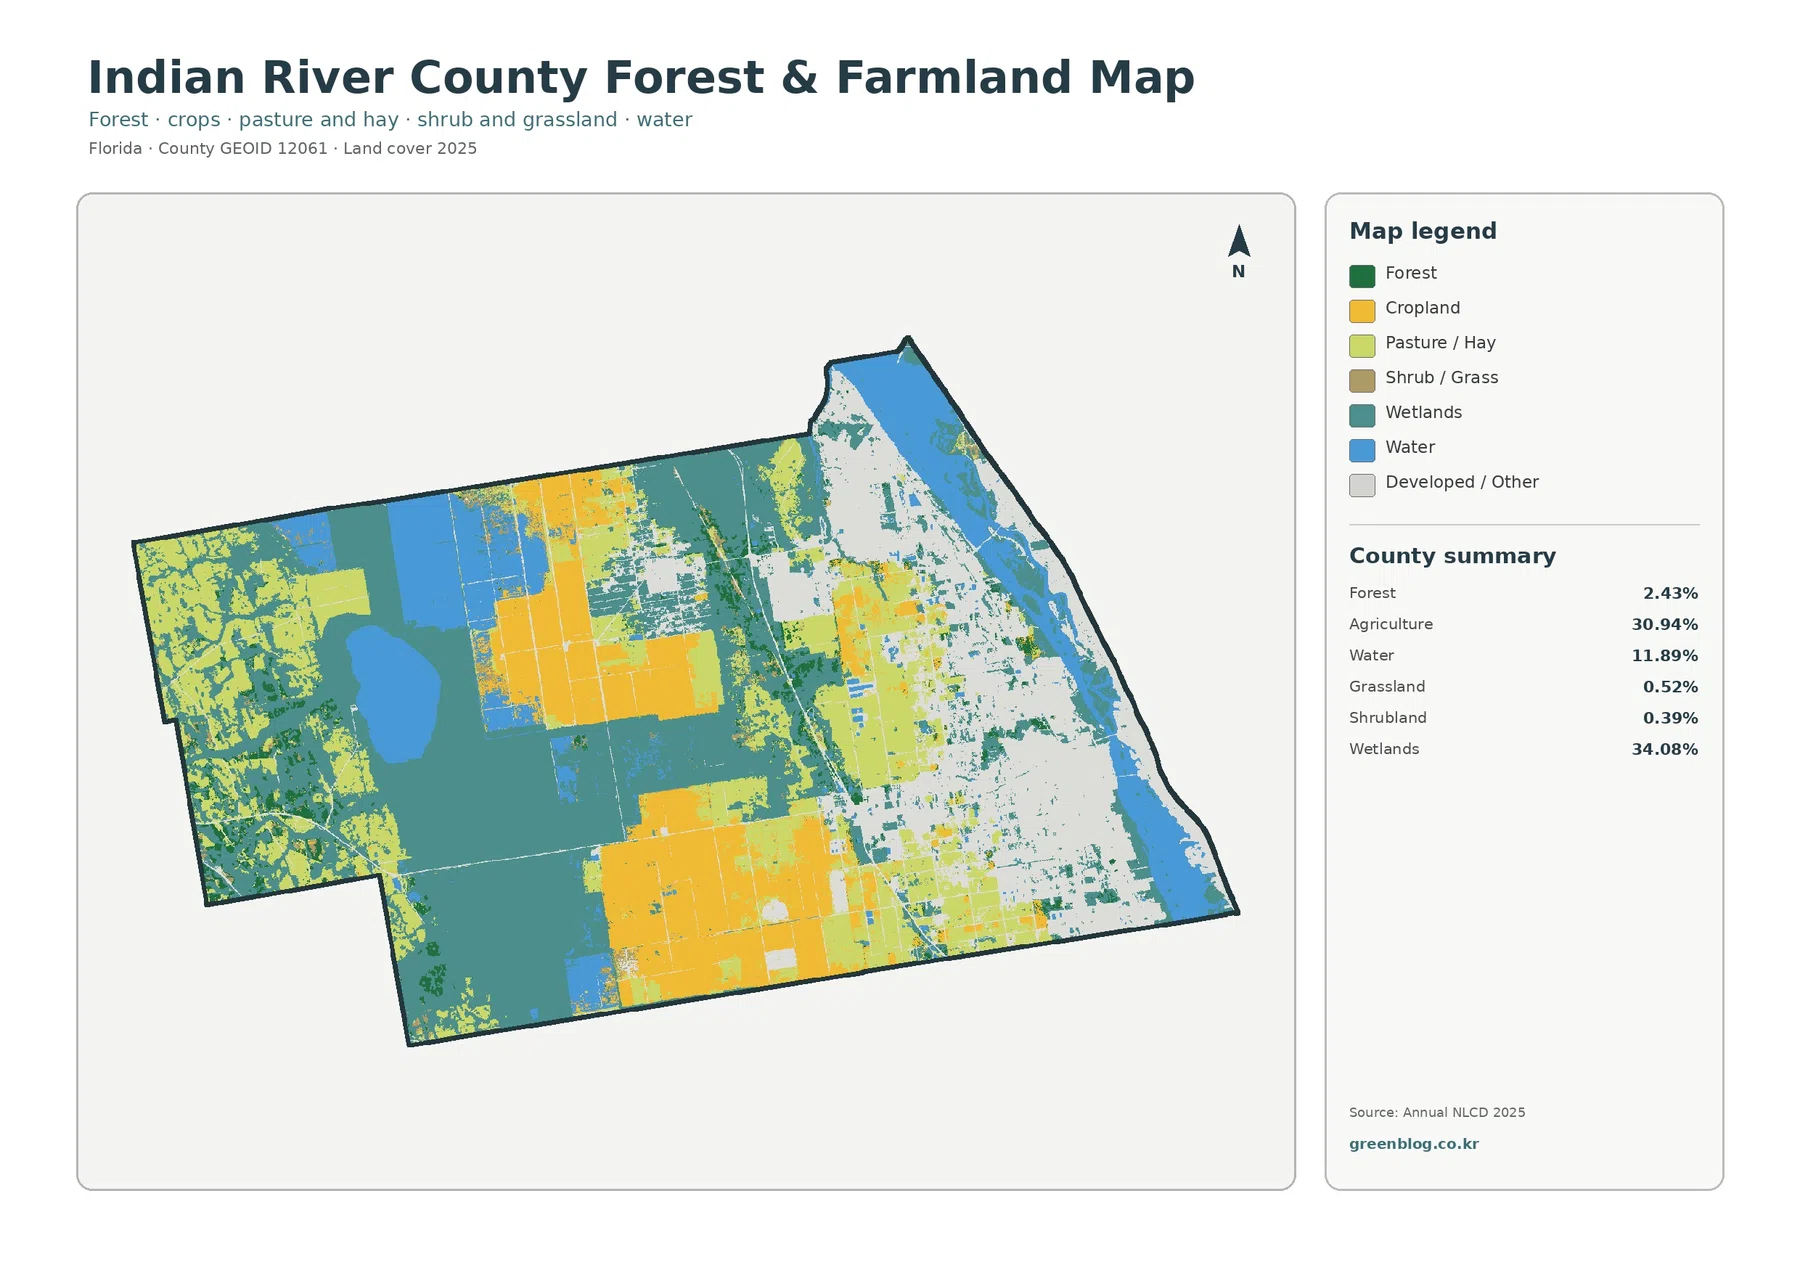
Removing most of the detailed developed classes from the visual emphasis makes the agricultural pattern much easier to follow. Broad farm blocks appear through the western and southern interior, while wetlands fill extensive areas around and between them. Forest contributes only 2.43%, grassland 0.52%, and shrubland 0.39%, so those smaller classes do not dominate the countywide view even though they can still matter locally.
UF/IFAS Extension Indian River County describes a long local agricultural history that includes cattle and citrus, and its current programs cover agriculture and natural resources. That county-specific background fits the large 30.94% agricultural share visible in the map. The image does not identify individual commodities, though, so a yellow area should not be labeled as citrus, pasture, or another crop unless a more detailed agricultural source confirms it.
Wetlands at 34.08% are just as important when reading the farm pattern. Many agricultural areas directly adjoin wetland cover, so focusing on farms alone would miss a major part of the interior landscape. For classroom or report use, one effective approach is to mark the largest agricultural blocks first and then trace the adjoining wetlands and water. That exercise shows how closely working land and wet environments occupy the same county.
The downloadable JPG is useful when small wetland strips, water cells, or residual forest patches are difficult to distinguish in the web preview. Enlargement still does not turn the raster map into a parcel map. Annual NLCD represents land as grid cells, and a cell can contain more than one real-world surface, so color boundaries should be read as generalized land-cover boundaries rather than survey lines.
The lagoon and barrier-island setting explains why water is a major part of the county map
Indian River County’s official lagoon page describes the Indian River Lagoon as a bar-built estuary between the mainland and barrier island and places the county in the central portion of the lagoon. That geographic setting helps explain why the eastern side of the county map contains a long water feature beside developed land. The same official source notes Sebastian Inlet to the north of the county’s lagoon section, giving the eastern water corridor a clear local context beyond the generic “water” class in the legend.
The county also maintains a Lagoon Management Plan focused on the health and resilience of the estuary. For a land-cover reader, this is a useful reminder that mapped water and wetlands are connected to a broader environmental system, even though the land-cover product itself does not measure water quality, seagrass condition, salinity, or habitat health. Those topics require dedicated lagoon monitoring and management data.
Likewise, teal wetland cells should not be treated as a regulatory wetland delineation. Satellite classification identifies the dominant surface condition in each cell, while legal wetland boundaries may depend on field indicators, hydrology, soils, and agency rules. The countywide land-cover map is excellent for broad context and comparison, but a project involving permits or property decisions needs the appropriate official regulatory records.
From 1985 to 2025, mapped differences are widespread rather than confined to one growth area
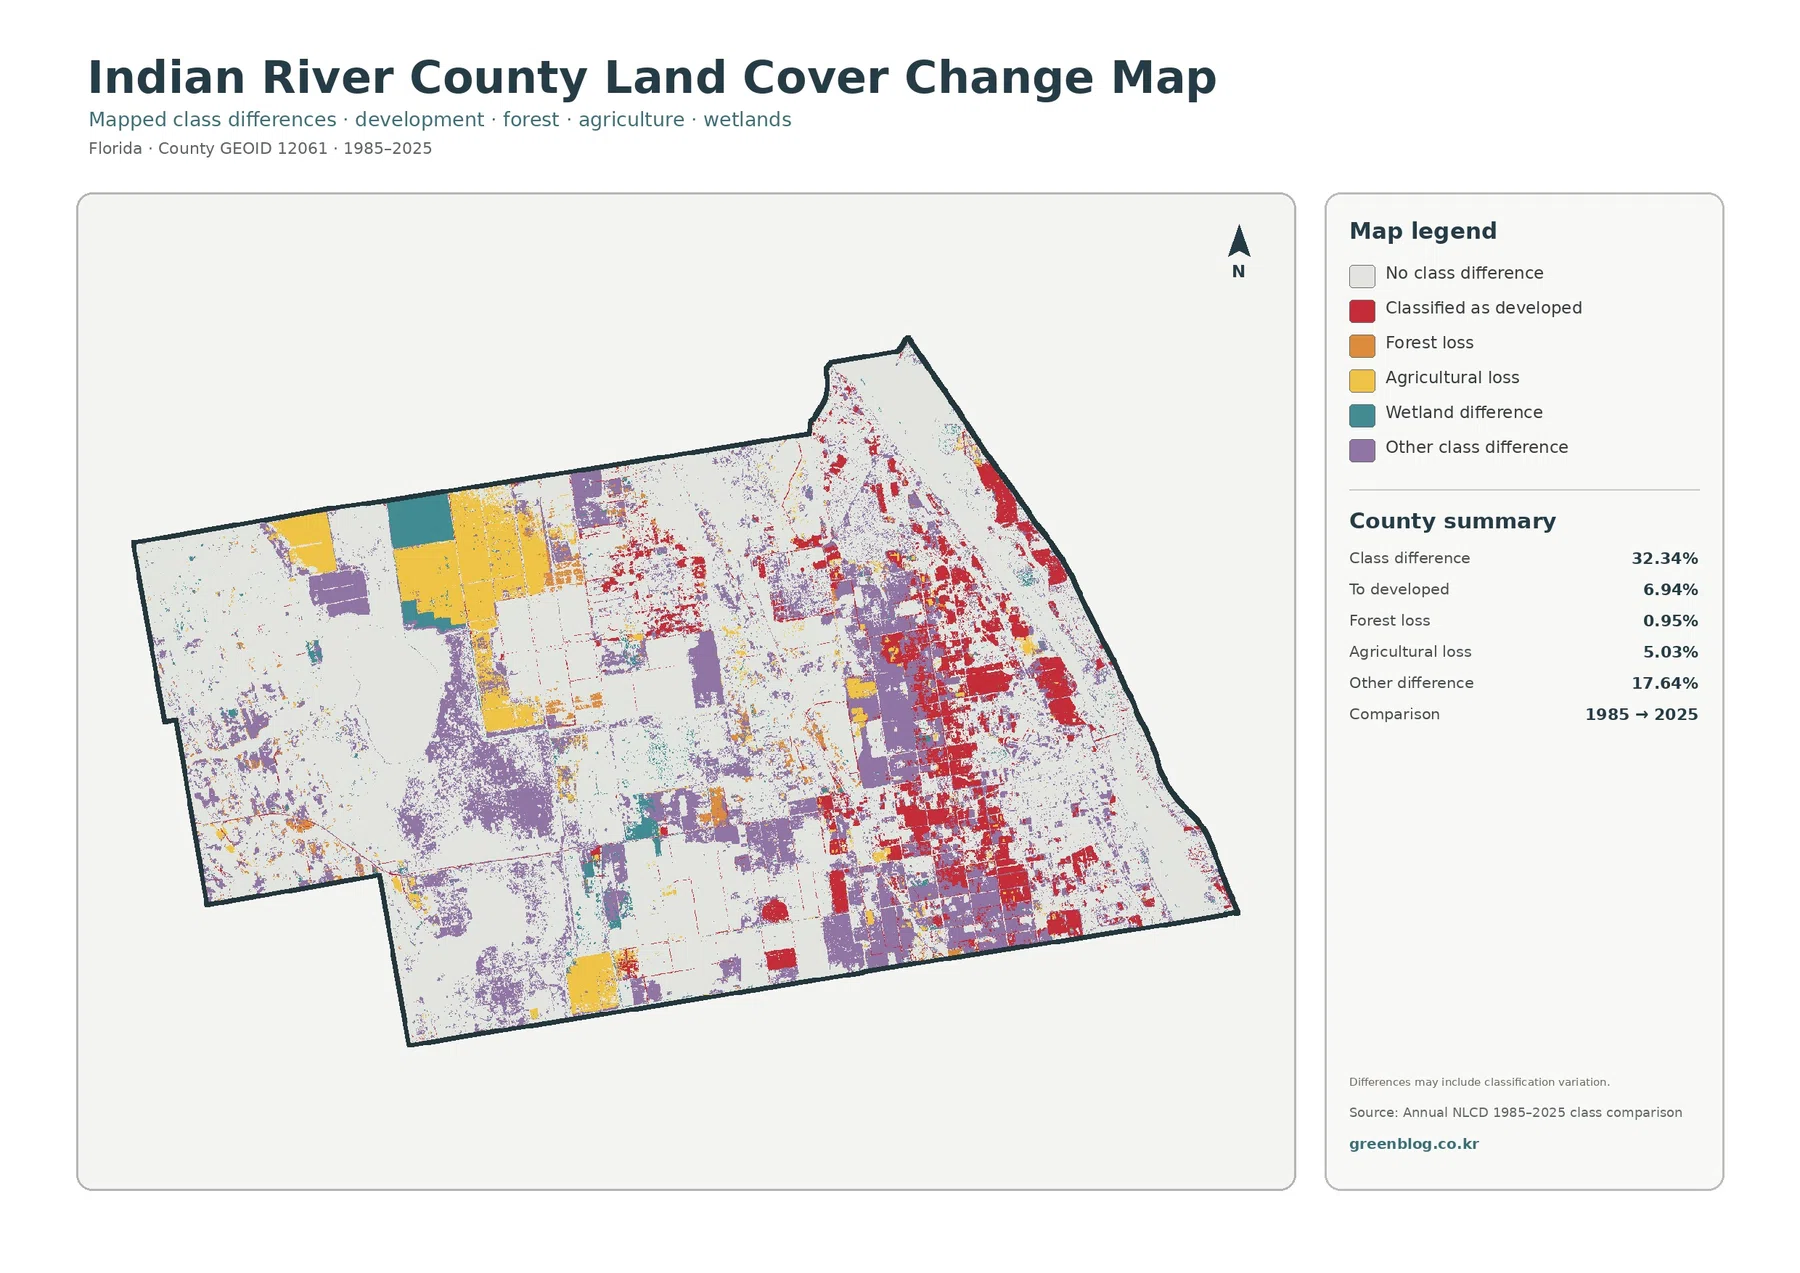
The comparison marks 32.34% of the county as having a different mapped class in 1985 and 2025. Transitions classified as developed account for 6.94%, agricultural loss for 5.03%, forest loss for 0.95%, and other class differences for 17.64%. The colored cells are especially noticeable through the eastern and south-central areas, but the west also contains agricultural and other differences.
Red developed-transition areas overlap broadly with parts of the current eastern developed corridor. That makes them useful places to examine with historical imagery, but the spatial overlap alone does not establish why a class changed. Growth, infrastructure, land management, imagery conditions, or classification behavior may all be relevant, and identifying the actual cause requires a source that records the timing and nature of the change.
Yellow agricultural-loss areas appear around several large farm blocks, while the comparatively small 0.95% forest-loss value reflects the limited forest share in the current county summary. Because agriculture still occupies 30.94% in 2025, agricultural-loss colors should not be described as the disappearance of farming from the county. They identify cells whose mapped category differs between the two endpoint years.
A note printed on the change map says that the differences may include classification variation. The 32.34% figure therefore is not a direct measurement of confirmed physical conversion. Sensor conditions, classification methods, mixed pixels, and changes in how a surface is represented can all create differences between two dates. Use this layer as a screening map, then check additional annual imagery or local records before making a strong statement about change.
Choose the map according to the question, then use the JPG set for closer inspection
For a quick overview, start with the general 2025 map because it makes the 34.08% wetland and 30.94% agricultural shares easy to place within the county. Use the forest-and-farmland view when the relationship between working land and wet areas is the main question. Impervious surface is better for comparing the intensity of the eastern built footprint, while the 1985–2025 layer is most useful for locating areas that deserve a historical follow-up.
A useful classroom sequence is to compare the two largest classes, locate the eastern development corridor, and then ask why developed cover is 19.55% while mean impervious surface is only 6.58%. Students can finish by checking whether the places with high current impervious cover also contain red developed-transition cells. The exercise demonstrates both what the maps can reveal and why correlation on a map should not automatically be turned into a causal claim.
Planning and property decisions should use a different source. Indian River County’s comprehensive planning documents address future land use and policy, while this page describes observed surface cover from satellite-based classification. Agricultural cover does not guarantee agricultural zoning, and developed cover does not establish development rights. Keeping those purposes separate prevents a visually useful map from being used beyond what the data supports.
The ZIP contains four JPG files at 2480×1754 pixels: 2025 land cover, forest and farmland, impervious and developed land, and the 1985–2025 land-cover comparison. The files work well for reports, presentations, classroom handouts, and moderate enlargement. They are below the pixel dimensions normally associated with full A3 output at 300 dpi, so check legend and label readability before making a large print.
Frequently Asked Questions
What are the two largest 2025 land-cover classes in Indian River County?
Wetlands are largest at 34.08%, followed closely by agriculture at 30.94%. Developed land accounts for 19.55% and water for 11.89%. The county is therefore better described as a mix of broad wetlands and farm areas with a strongly developed eastern side than as a landscape dominated by only one class.
Why does the impervious map look much more concentrated than the developed-land map?
Developed land includes both hard and permeable surfaces, while impervious cover focuses on pavement, rooftops, and similar hard surfaces. Indian River County has 19.55% developed cover but a mean impervious value of 6.58%, so the impervious layer naturally highlights a smaller and more concentrated part of the built landscape.
Can the 32.34% class-difference value be treated as confirmed land conversion?
No. The map specifically notes that classification variation may be included. The value identifies cells mapped differently in 1985 and 2025, but confirming physical conversion requires additional annual imagery, local records, or another source that documents what changed and when.
Map File Information
Download the four original Indian River County land-cover JPG maps together in one ZIP file.
- Included Files: Use only the versions confirmed in the article and supplied images
- File Type: Use the confirmed download contents
- Intended Use: Printing, education, presentations, and map-based projects
Related Maps
- Alachua County Florida Land Cover Map
- Baker County Florida Land Cover Map
- Bay County Florida Land Cover Map
Sources and References
- MRLC Annual NLCD Data – official access point for annual land-cover datasets.
- USGS Annual NLCD Land Cover Classification – explanation of the major land-cover classes used in Annual NLCD products.
- U.S. Census Bureau TIGER/Line Shapefiles – official county-boundary data.
- Indian River County – Indian River Lagoon – official local information about the lagoon, its setting, and county natural-resource programs.
- UF/IFAS Extension Indian River County – Agriculture & Natural Resources – local agriculture and natural-resource education and background.
Green Map creates custom-edited map images using open geographic data sources such as geoBoundaries, Natural Earth, OpenStreetMap, and government open data.
These maps are edited visual materials, not raw data files, and are provided for education, documents, presentations, and graphic reference.