Columbia County in north Florida has a clear north-to-south contrast in the supplied 2025 land-cover data. Forest is the largest class at 37.49%, followed by wetlands at 24.45% and agriculture at 18.79%. Developed cover accounts for 10.33%, while shrubland makes up 4.92%. Forest and wetlands dominate much of the north, agriculture becomes more prominent toward the south, and the main developed concentration sits near the center of the county.
This page includes four views of the same county: overall land cover, forest and farmland, impervious surface and developed land, and a 1985–2025 class comparison. The WebP images are convenient for on-screen reading, while the download box provides the four original JPG maps together in one ZIP for printing, classroom work, presentations, and county comparison.
Table of Contents
The central developed core is compact compared with the surrounding rural landscape
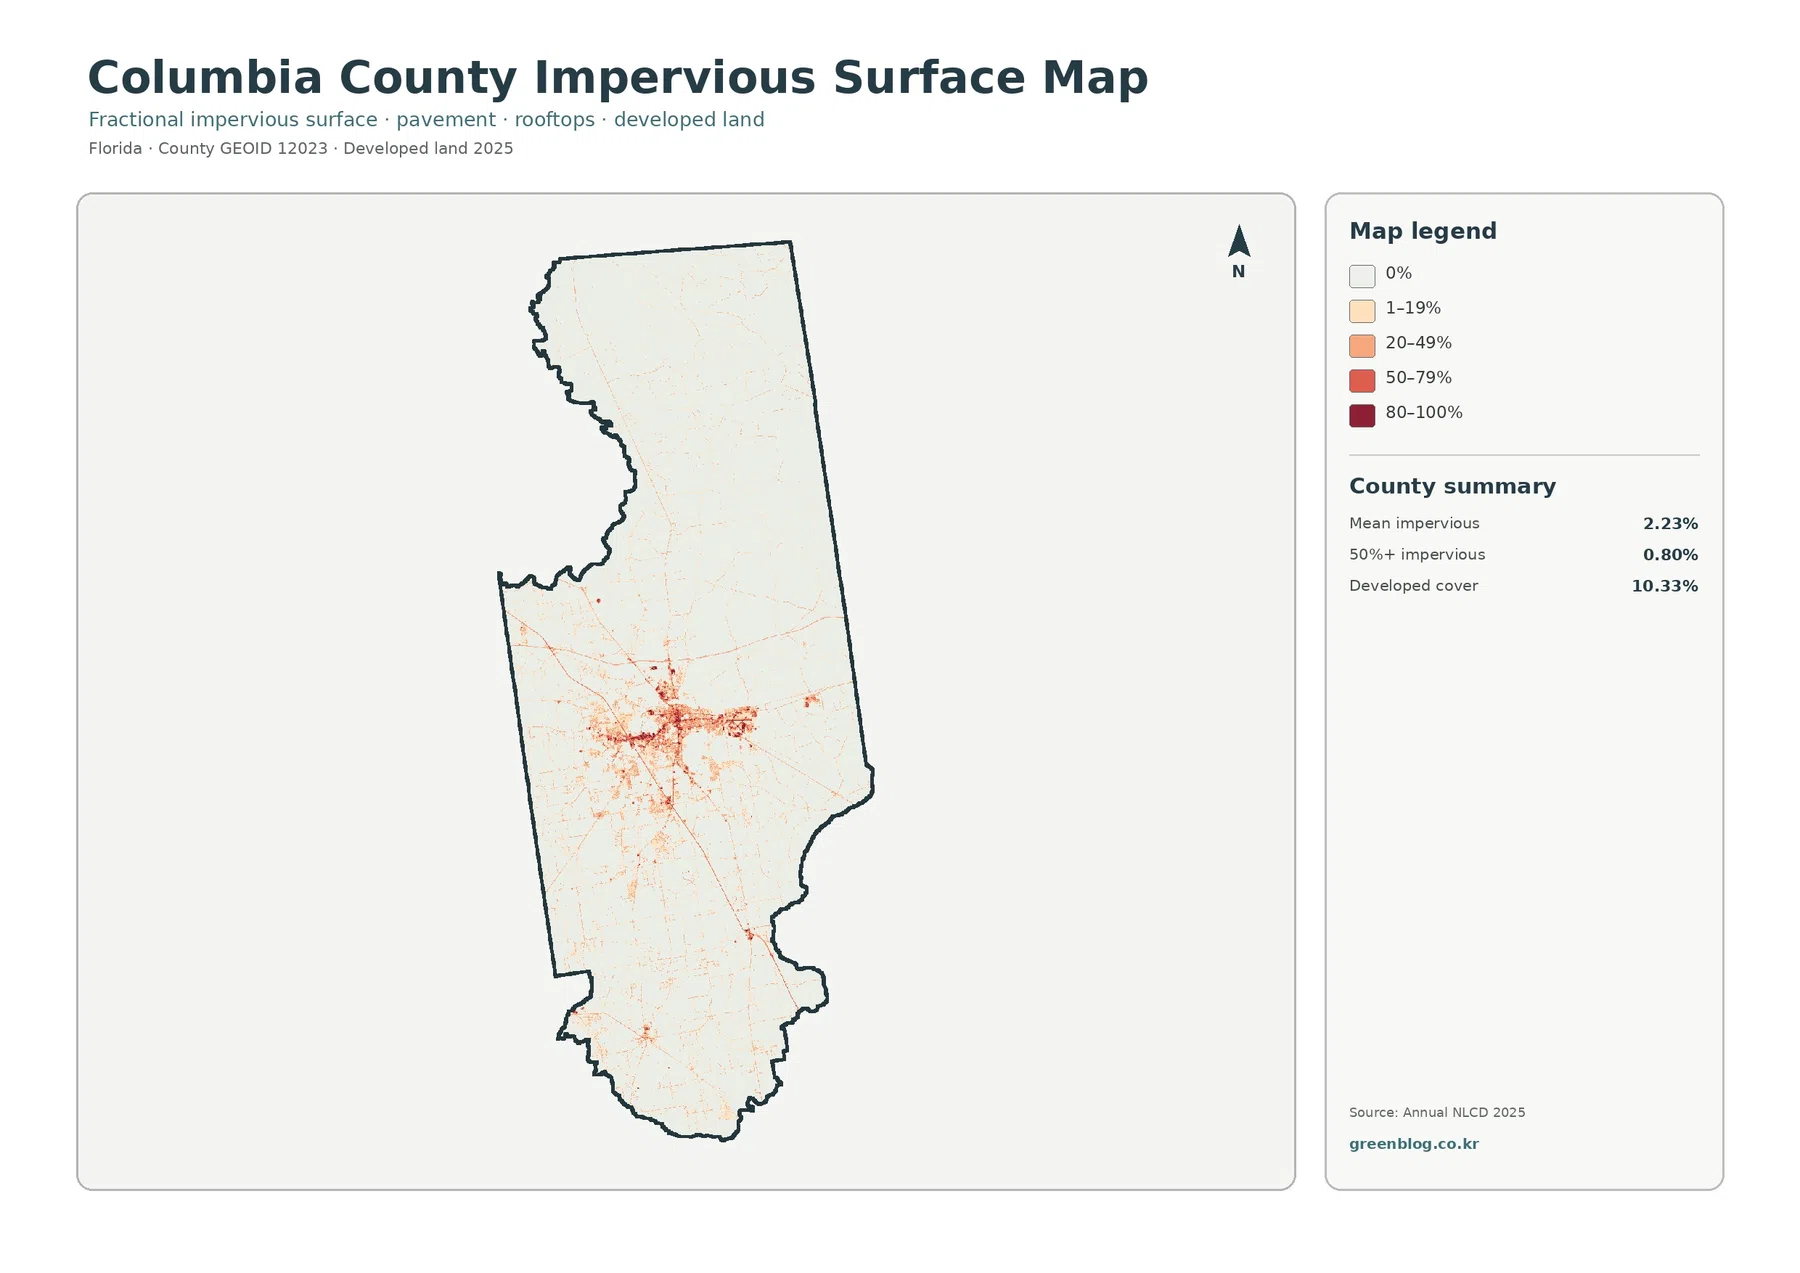
Impervious surface means pavement, rooftops, parking areas, and other hard surfaces that do not readily absorb rainfall. The countywide mean is 2.23%, and only 0.80% of the county is mapped at 50% impervious or higher. Those values are far below the 10.33% developed-cover share because developed classes can include lawns, trees, and open surfaces that still allow water to infiltrate.
The darkest values gather near the middle of Columbia County, corresponding to the Lake City area and the main developed concentration on the general map. Outside that core, high impervious values become sparse very quickly. The northern forest-wetland landscape is mostly pale, and the agricultural south contains only thin lines and small spots of stronger imperviousness.
Thin lines may resemble roads, but this is not a transportation map. Raster cells simplify narrow features, so the image cannot provide road names, exact widths, drainage detail, or engineering information. Imperviousness also should not be treated as a flood-risk layer; it is best used for comparing development intensity.
The full 2025 map shows a forest-wetland north and an agricultural south
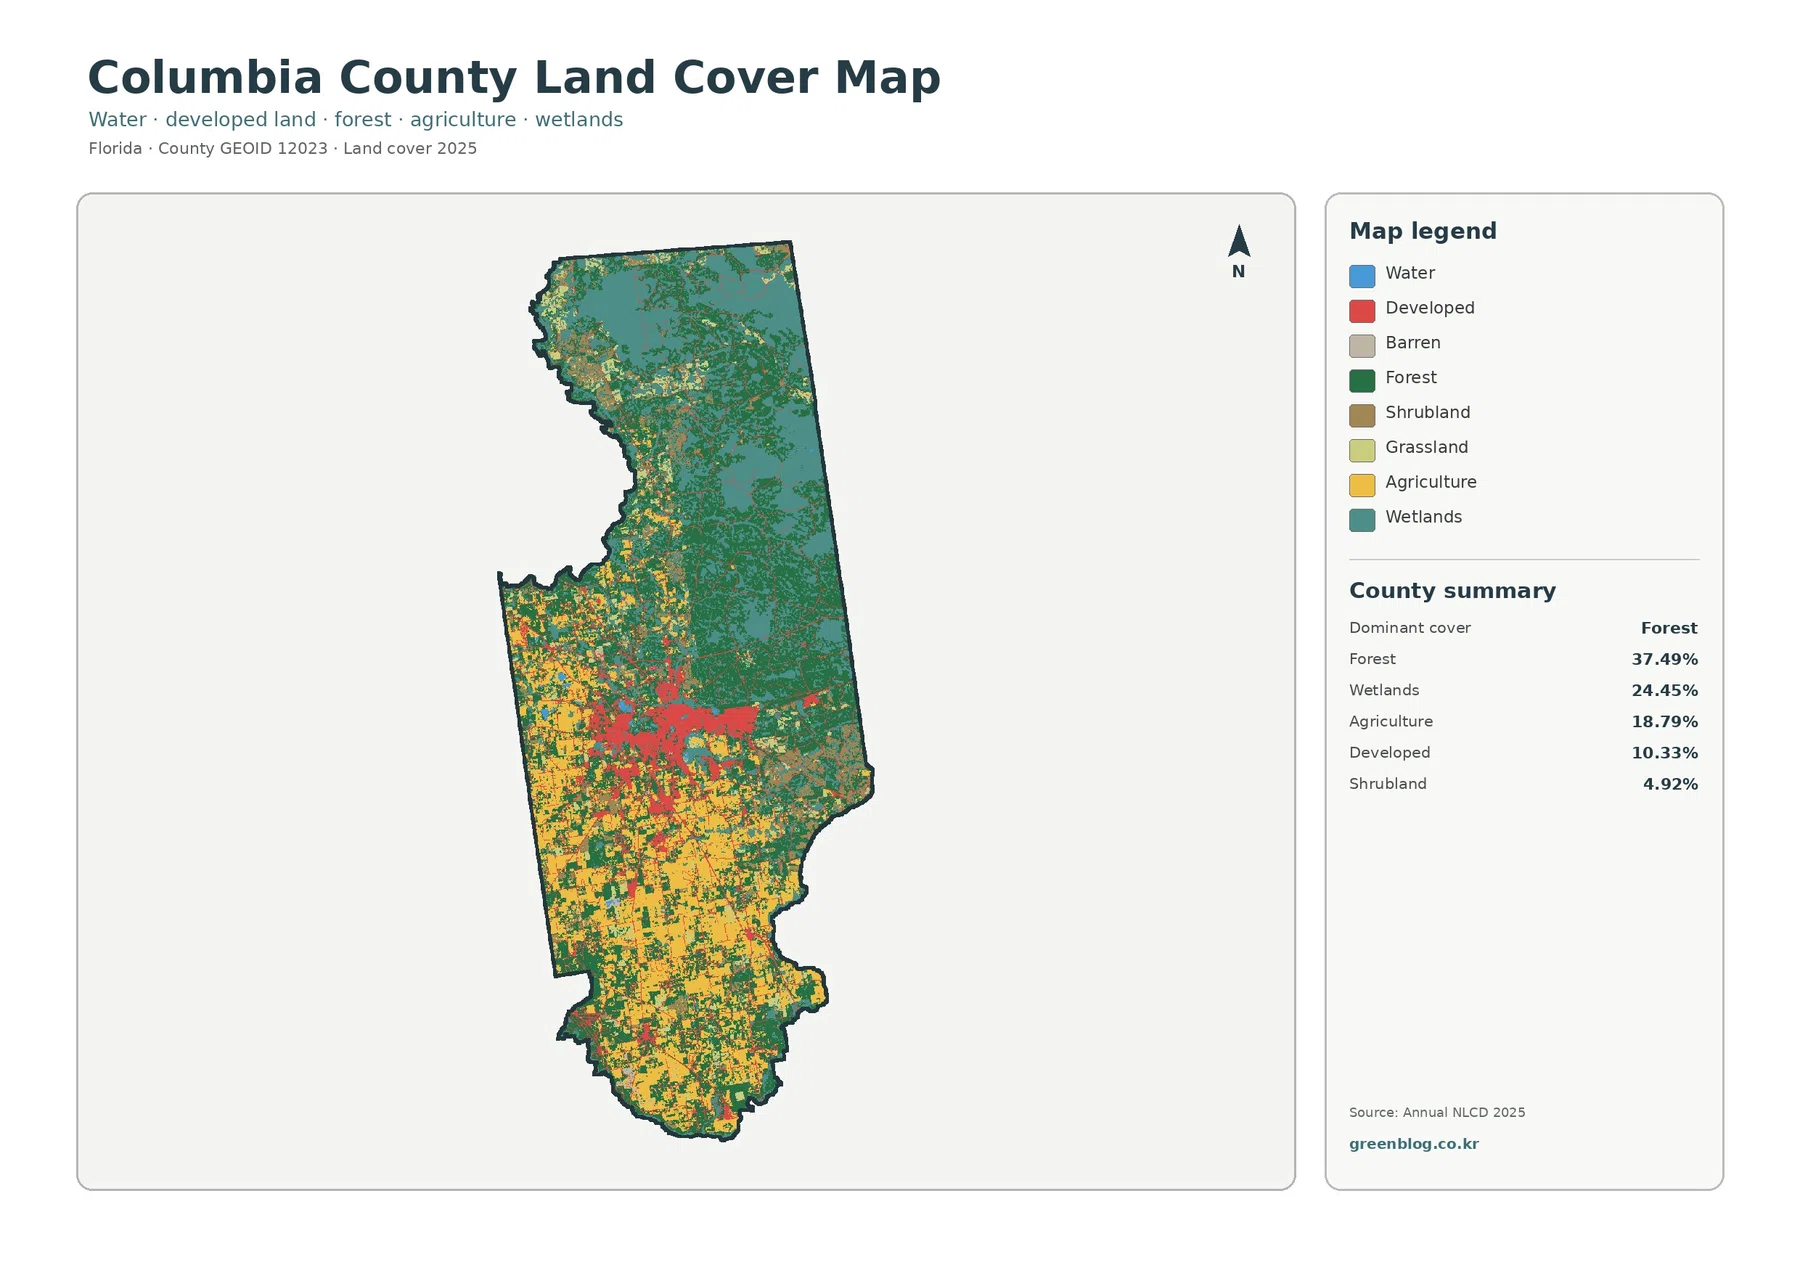
The general land-cover map is the best first image for orientation. Dark green forest and teal wetlands dominate the northern half, agricultural colors become common in the south, and a red developed concentration sits between them. The county’s surface pattern changes noticeably over a relatively short north-south distance.
Forest at 37.49% is the largest class, but it is not equally continuous everywhere. Broad northern blocks are interrupted less often, while southern forest is more frequently bordered by agriculture and development. Wetlands reach 24.45% and are especially extensive in the north; open water is only 0.26%, so wetland cover is far more important than large blue water areas in the countywide summary.
Agriculture reaches 18.79% and becomes one of the most visible classes in the south. Fields and pasture-like areas appear in larger blocks there, with forest remaining between many of them. Developed cover is only 10.33%, yet its concentration near the center makes it easy to locate on the map.
Land cover describes what covers the ground surface. It is not zoning, ownership, tax classification, a parcel boundary, or a statement about whether development is legally permitted. Columbia County’s Zoning Department maintains separate planning and future-land-use resources for those questions.
Forest and farmland become easier to compare when developed classes are pushed into the background
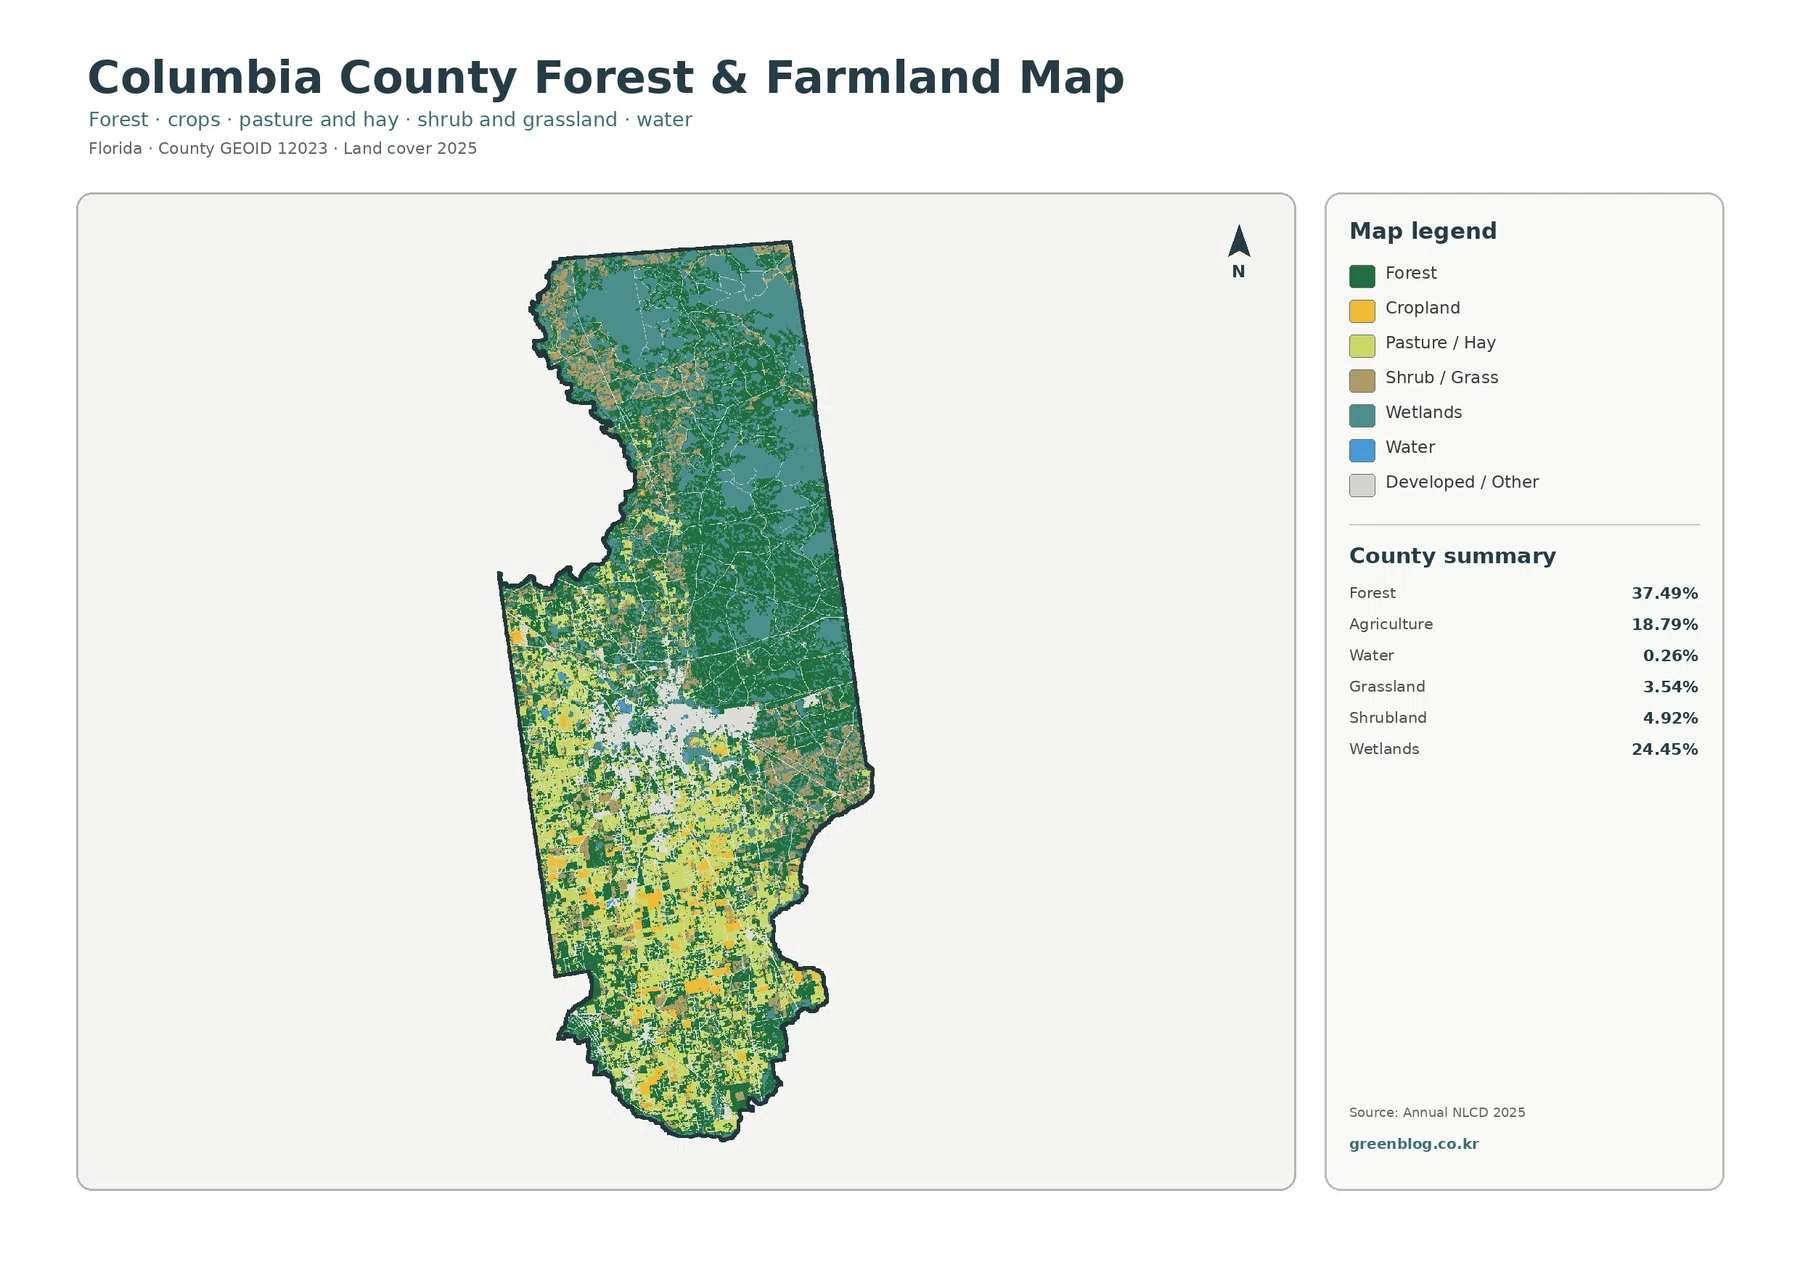
The forest-and-farmland view clarifies the north-south contrast. Forest remains the dominant green class in the north, while wetlands fill many of the spaces within and beside it. Farther south, agricultural colors appear more frequently and form larger blocks between forest remnants.
UF/IFAS Extension Columbia County describes local agriculture as including row crops such as peanuts, corn, and soybeans, along with pasture and hay for cattle production. That information gives local context to the 18.79% agricultural share, but the map does not identify a specific crop in an individual field. The legend itself separates cropland from pasture or hay.
Forest cover changes character toward the south. Instead of one broad block, many green areas are bordered by agriculture, development, or wetlands. Small patches may represent true fragmentation, but a 30-meter raster cell can also summarize mixed surfaces near roads and field edges, so the image should not be read as a parcel survey.
Wetlands remain prominent in this simplified view. Their 24.45% share means that any discussion of Columbia County’s forest or agriculture should also recognize the extensive wet areas, particularly in the northern half of the county.
Rivers help explain the county outline, while wetlands explain more of the mapped water-related surface
Florida’s statutory description of Columbia County follows named waterways in several places. The Suwannee River forms part of the northwestern boundary, while the Santa Fe River and Ichetucknee River appear in the southern boundary description. These waterways help explain the curved and irregular portions of the county outline.
The land-cover percentages tell a complementary story. Open water is only 0.26%, yet wetlands cover 24.45%. Similar teal wetland colors do not mean every site has the same hydrology, vegetation, or regulatory status; dedicated wetland and water-resource data are needed for those details.
This distinction is useful when combining map types. A legal boundary source explains why a river helps define a county edge, while the land-cover image shows the broad surface classes inside that boundary. One should not be substituted for the other.
The 1985–2025 comparison shows substantial class difference, with forest loss as a major category
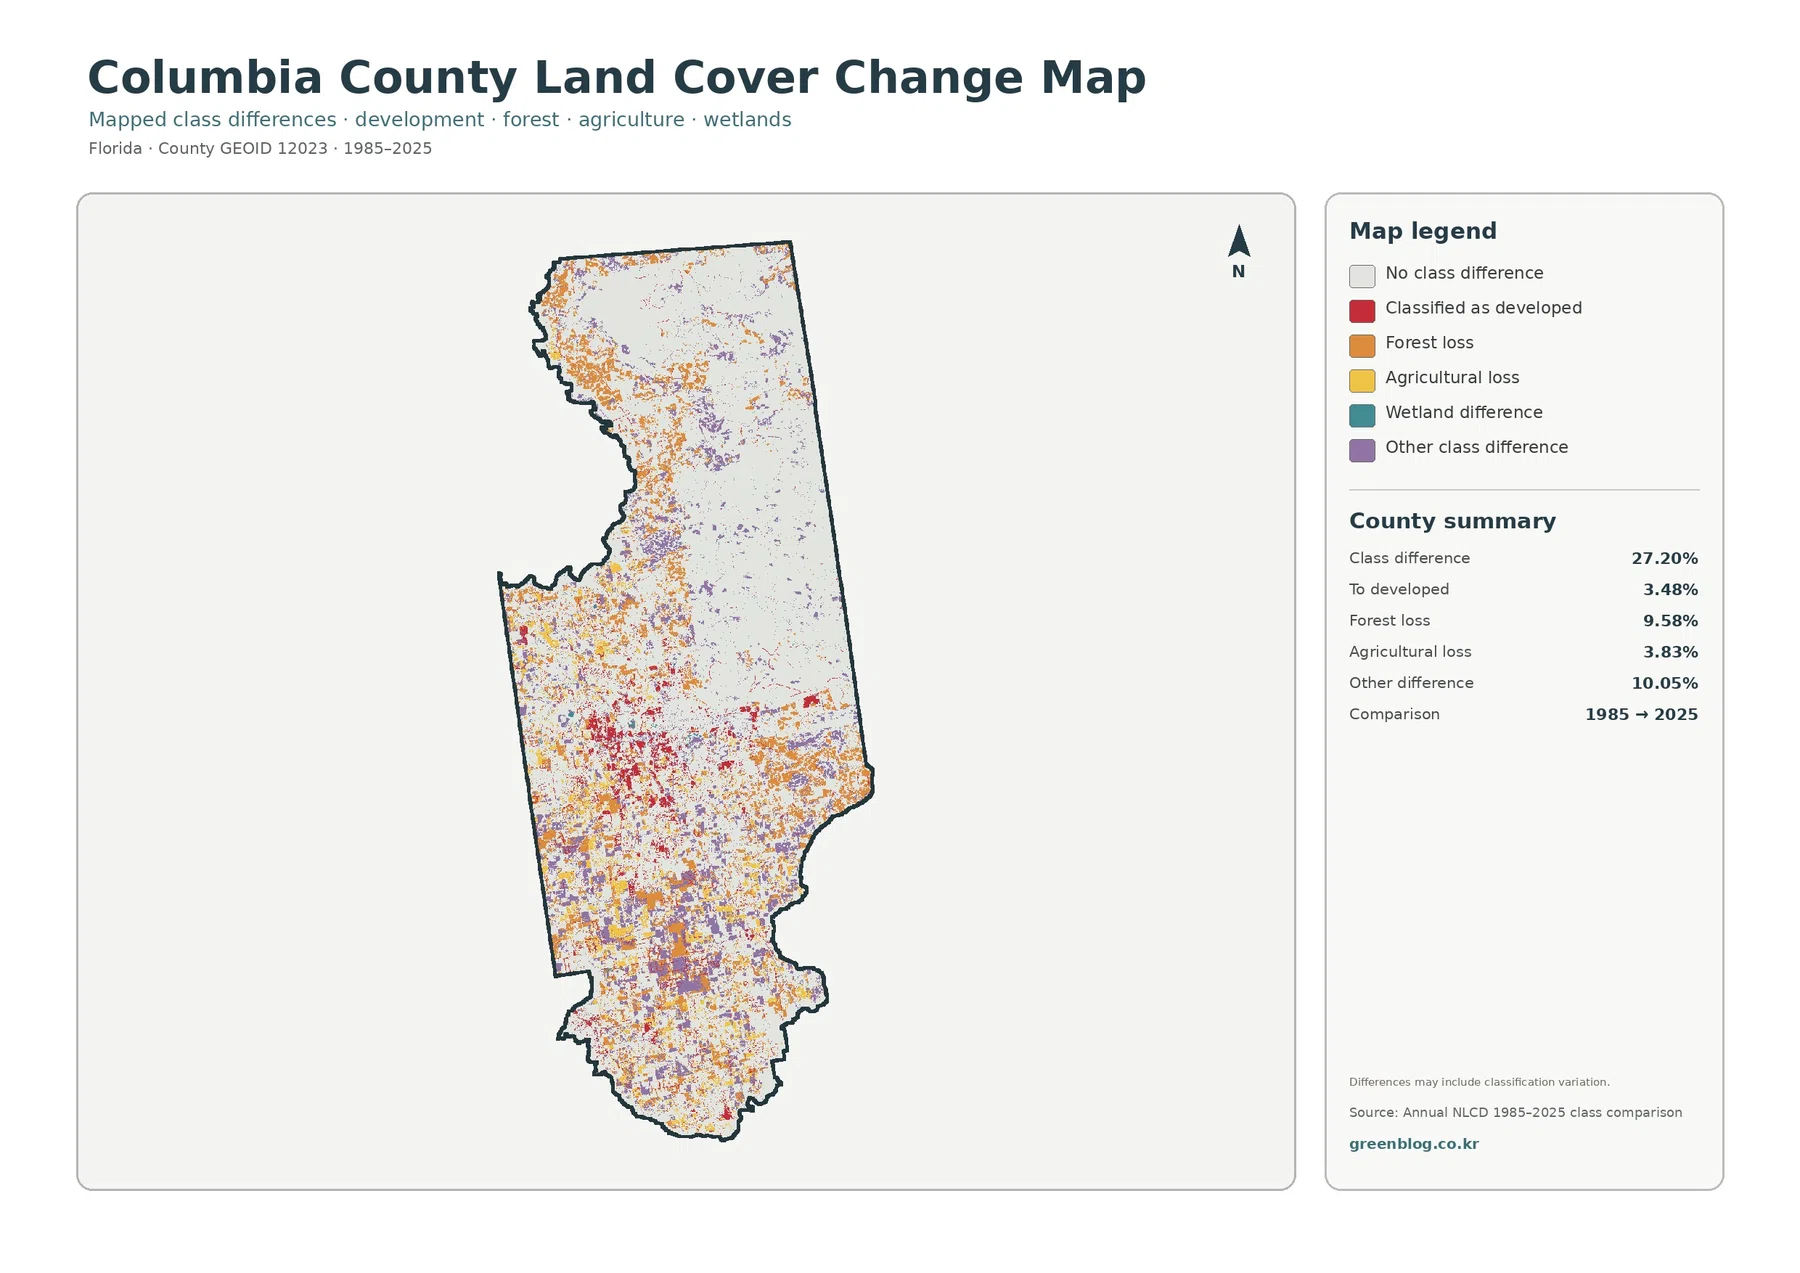
The comparison map reports class difference across 27.20% of Columbia County. This means the mapped class in 1985 differs from the mapped class in 2025 at those cells. It should not be read as a statement that 27.20% of the county was physically transformed, because the map note warns that classification variation can be included.
Forest loss is listed at 9.58%, while the mapped shift to developed cover is 3.48% and agricultural loss is 3.83%. Orange forest-loss cells are spread across the northwest, central, and southern portions, and red developed-change cells are most evident near the central developed area. These patterns are useful for screening, but the map cannot establish a cause.
Other class difference is 10.05%, the largest single category in the summary. Purple cells are widely distributed, and wetland-difference cells also appear in parts of the county. Any accurate presentation should keep those categories visible instead of reducing the comparison to a simple story of urban growth or forest removal.
A two-date comparison also misses intermediate history. Crop rotation, temporary fallow land, storms, timber activity, vegetation change, and classification differences can all affect how a cell appears. Additional annual imagery, records, and field information are needed to determine when and why a specific place changed.
Planning and agriculture sources add local context without changing what the map measures
Columbia County’s Zoning Department administers land development regulations and the county comprehensive plan and provides zoning and future-land-use mapping. Those resources answer legal and policy questions that the land-cover maps do not. A red developed class in this article shows a mapped surface condition, not a zoning designation.
UF/IFAS Extension Columbia County focuses on agriculture, livestock, horticulture, and natural resources. Its row-crop information describes a mix of field crops, pasture, hay, and specialty crops, which helps explain why working land is an important part of the southern county landscape. The supplied map remains the source for the 18.79% land-cover value used here.
Keeping these sources separate avoids unsupported causal claims. The map may show development concentrated near Lake City and agriculture farther south, but it does not prove why those patterns formed. Historical, economic, transportation, and policy explanations require evidence beyond the land-cover images.
Choosing the right map for a specific question
Use the full 2025 land-cover map when you need one image that summarizes the county. It places 37.49% forest beside 24.45% wetlands and 18.79% agriculture and shows where the 10.33% developed cover is concentrated. It is the most useful first page for a printed set.
Choose the forest-and-farmland map for agriculture, forestry, habitat, or rural-landscape discussions. Use the impervious map for questions about hard-surface concentration; the 2.23% mean becomes more meaningful when readers can see that darker values are clustered near the central developed area.
Use the 1985–2025 comparison after the current pattern is understood. The 9.58% forest-loss category, 3.48% shift to developed, 3.83% agricultural loss, and 10.05% other difference are useful screening measures, but they do not provide a complete history of every cell.
Raster resolution and date limits define the right scale of use
Annual NLCD is raster data: the landscape is divided into grid cells and each cell receives a class or value. A real 30-meter area can contain trees, grass, pavement, water, and buildings at the same time, so narrow roads, field edges, small wetlands, and fragmented forest are simplified.
The current maps summarize the supplied 2025 classification. Construction, harvesting, crop changes, storms, restoration, or vegetation shifts after that observation period may not appear. The change layer compares 1985 and 2025 endpoints and does not record every transition that happened between them.
These maps are well suited to countywide education, broad environmental comparison, presentations, and regional screening. Zoning, property ownership, legal wetlands, flood determination, and construction decisions require the appropriate current legal or technical source. Enlarging the JPG improves print readability but does not create parcel-level detail.
Practical uses in lessons, presentations, and Florida county comparisons
A classroom exercise can begin by asking students to identify the dominant colors in the north and south, then connect those observations to the summary: 37.49% forest, 24.45% wetlands, and 18.79% agriculture. The central developed area provides a third, clearly different setting within the same county.
An agriculture presentation can pair the forest-and-farmland map with UF/IFAS information about row crops, pasture, and hay. A development slide can compare 10.33% developed cover with 2.23% mean imperviousness to show that a developed class is not the same as continuous pavement.
For comparisons with another Florida county, use the same data year and classification system. Columbia County’s strongest reference points are its forest-wetland north, agricultural south, compact central development, low countywide imperviousness, and 27.20% two-date class difference. Map pattern and percentages should be compared together.
Frequently Asked Questions
What is the largest land-cover class in Columbia County in 2025?
Forest is the largest class at 37.49%. Wetlands follow at 24.45%, agriculture at 18.79%, and developed cover at 10.33%. Forest is most continuous in the north, while the southern half contains a larger mix of agriculture and smaller forest patches.
Which map is best for seeing the Lake City development concentration?
Use the full land-cover map to see the overall developed footprint and the impervious-surface map to see where hard surfaces are most concentrated. The two layers answer different questions: developed cover is 10.33% of the county, while mean imperviousness is 2.23%.
Does the 27.20% class difference mean that more than a quarter of the county physically changed?
Not necessarily. The 27.20% figure represents cells with different mapped classes in 1985 and 2025 and may include classification variation. Categories such as 9.58% forest loss and 3.48% shift to developed are useful for screening, but the cause and timing of change need additional imagery, records, or field information.
Map File Information
The four original JPG maps used in this Columbia County article are packaged together in one ZIP file.
- Included Files: Use only the versions confirmed in the article and supplied images
- File Type: Use the confirmed download contents
- Intended Use: Printing, education, presentations, and map-based projects
Related Maps
- Alachua County Florida Land Cover Map
- Baker County Florida Land Cover Map
- Bay County Florida Land Cover Map
Sources and References
- MRLC Annual NLCD Data – Annual NLCD data used for current land cover and long-term class comparison
- USGS Annual NLCD Land Cover Classification – Definitions and documentation for land-cover classes
- U.S. Census Bureau TIGER/Line Shapefiles – County boundary source
- Columbia County Zoning Department – County planning, land development regulations, zoning, and future-land-use resources
- UF/IFAS Extension Columbia County – Row Crops – Local information on row crops, pasture, hay, and agricultural conditions
- Florida Statutes – Columbia County Boundary – Official county-boundary description referencing the Suwannee, Santa Fe, and Ichetucknee rivers
Green Map creates custom-edited map images using open geographic data sources such as geoBoundaries, Natural Earth, OpenStreetMap, and government open data.
These maps are edited visual materials, not raw data files, and are provided for education, documents, presentations, and graphic reference.