Western Connecticut has one of the clearest forest-versus-development contrasts in this set of Connecticut planning-region maps. In the 2025 summary, forest covers 43.87% and developed land 42.69%, a difference of only 1.18 percentage points. The two classes are not evenly mixed, however. Developed cover is much more prominent along the southern end and around several major centers, while broader forest blocks remain across much of the northern and inland part of the region.
Four map views are provided here: current land cover, forest and farmland, fractional impervious surface with developed land, and a 1985–2025 land-cover class comparison. The four original JPG maps are available together in one ZIP download. They can be used for classroom work, presentations, regional environmental comparisons, watershed context, or as a visual starting point before consulting more detailed municipal GIS. Land cover describes what is physically covering the ground; it does not establish zoning, ownership, parcel boundaries, or whether land can legally be developed.
Table of Contents
A planning region where forest and developed cover are almost evenly matched
The map identifies the area as Western Connecticut Planning Region, GEOID 09190, one of the county-equivalent planning regions used by the U.S. Census Bureau in Connecticut. The Western Connecticut Council of Governments, or WestCOG, lists eighteen member municipalities. Its membership spans coastal communities such as Greenwich, Stamford, Darien, Norwalk, and Westport as well as inland municipalities including Danbury, New Milford, Newtown, Bridgewater, and Sherman. That mix helps explain why a single regional average hides strong differences from one part of the map to another.
At first glance, the southern end is dominated by developed cover, with broad red areas and connected corridors near Long Island Sound. Another large concentration appears farther inland around the middle of the region. Moving north, green forest becomes more continuous and occupies larger blocks, although development never disappears completely. The pattern is therefore more complicated than a simple urban south and rural north. Pockets of forest remain within the more developed south, and developed strips and centers extend well into the interior.
WestCOG’s 2020–2030 Regional Plan of Conservation and Development addresses natural-resource protection, open space, transportation, housing, and community centers across its eighteen municipalities. Those planning topics provide useful context for the map, but the two sources should not be treated as interchangeable. A forest pixel is not automatically protected open space, and a developed pixel does not mean that additional development is permitted. Policy decisions require municipal plans, zoning, wetland rules, and parcel-level records in addition to land-cover data.
The 2025 land-cover map shows the region’s two dominant surfaces
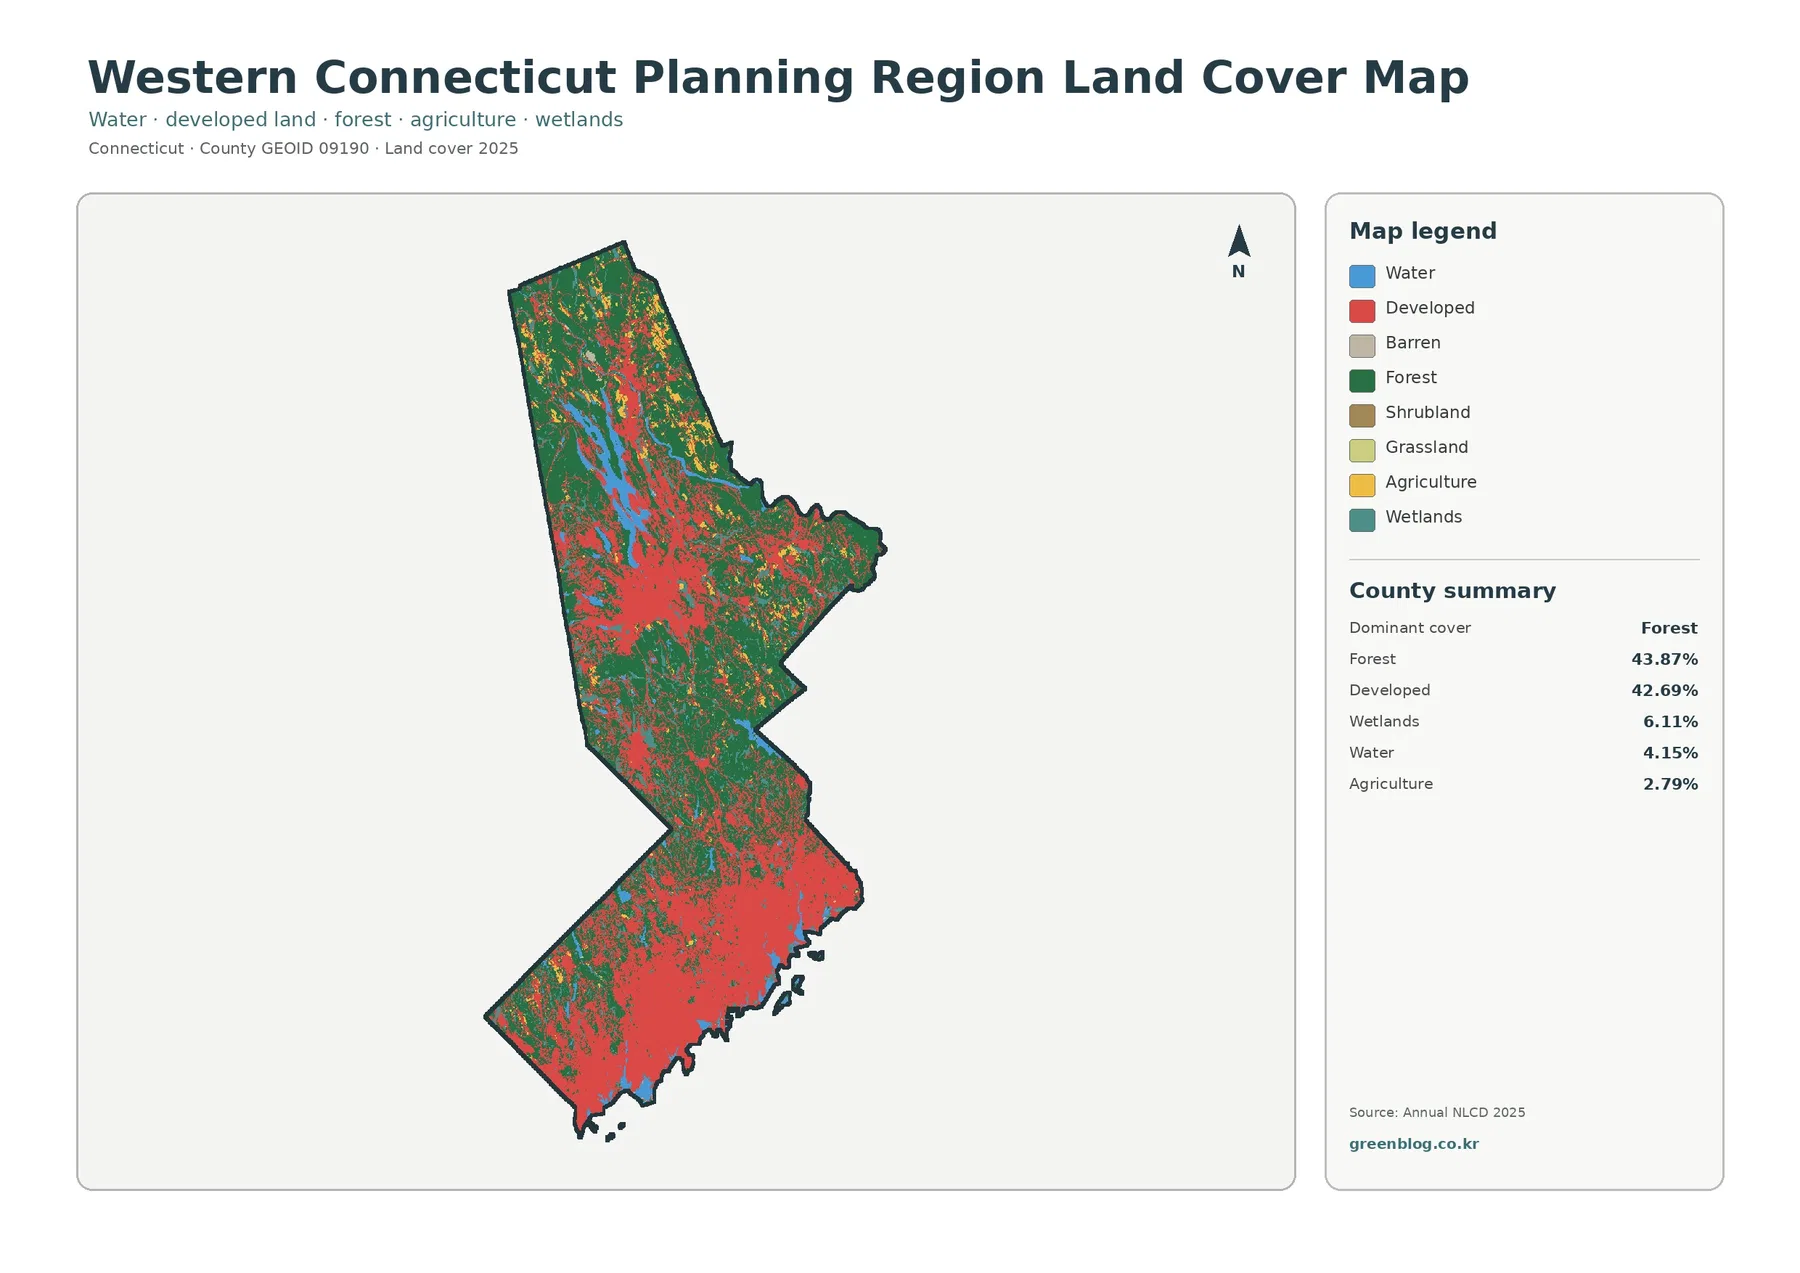
Forest is the largest individual class at 43.87%, but developed land follows closely at 42.69%. Wetlands account for 6.11%, water for 4.15%, and agriculture for 2.79%. The legend also includes barren land, shrubland, and grassland, although those smaller classes do not dominate the regional summary. Because forest and development together account for most of the mapped area, comparing their location is the fastest way to understand the overall pattern before looking at the smaller natural-cover classes.
Development is broadest near the southern shoreline and in several inland concentrations. Some linear red features connect larger developed areas, but the map does not label roads, so it would be inappropriate to assign a specific highway name to every visible corridor. Likewise, the image does not show municipal boundaries. A red patch may cross more than one town, and a green block can extend across jurisdictional lines. The map is best read as a regional surface pattern rather than as a municipal land-use map.
Water is especially noticeable in the northern half and in several central locations, while smaller blue features appear elsewhere. Wetlands occur in scattered patches associated with low-lying and water-adjacent areas on the map. Along the southern edge, the coast adds another strong water boundary to a landscape that is otherwise heavily developed. These smaller classes matter because they interrupt both the forest and developed surfaces, creating transitions that are easy to miss if attention is limited to the two largest percentages.
Forest and farmland become easier to separate when development is muted
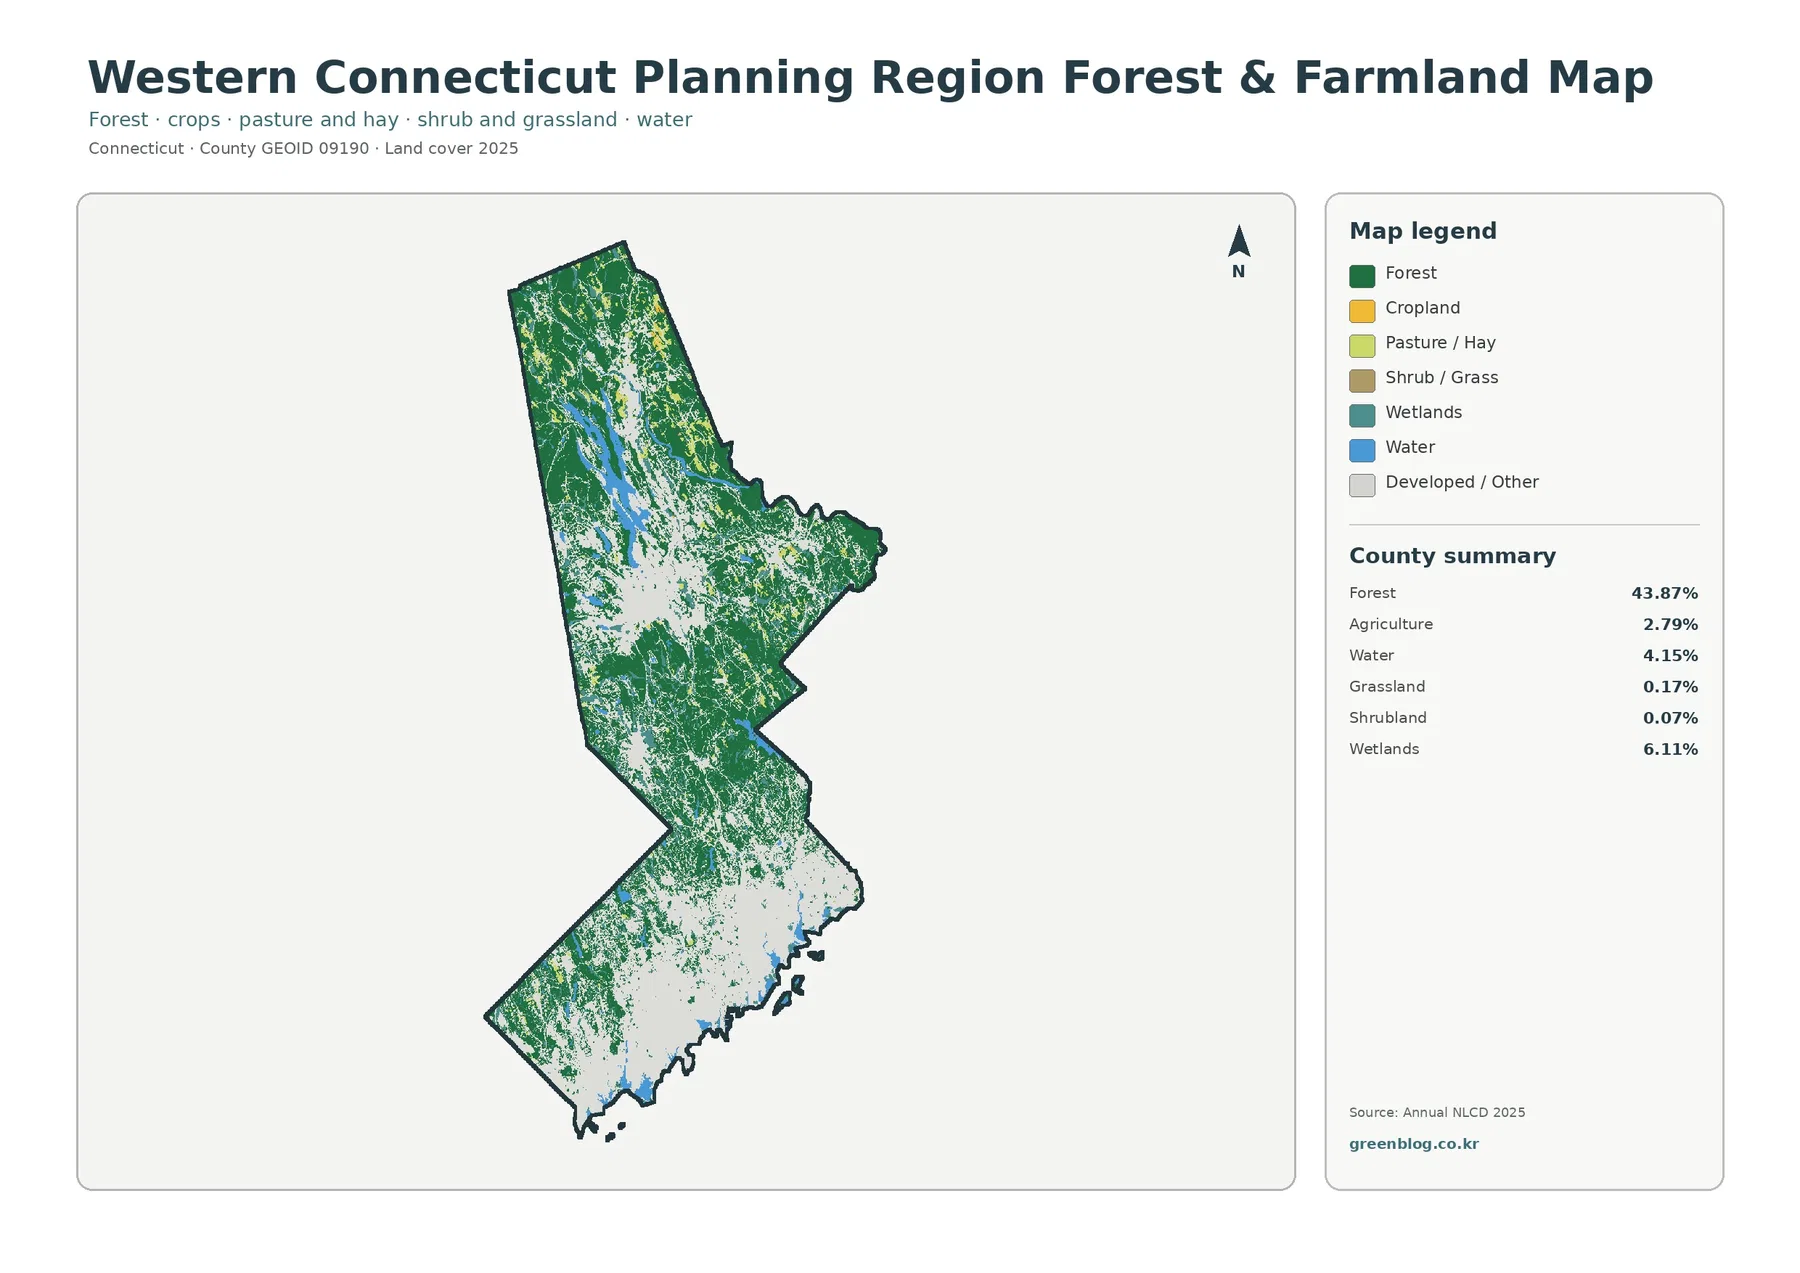
The forest-and-farmland view fades developed and other cover into a pale background. That change makes the 43.87% forest share much easier to follow across the northern and interior portions of the region. Large green areas remain connected in the north, while the south contains smaller and more fragmented forest patches around developed land. The map is useful when the purpose is to discuss green cover rather than the full land-cover legend.
Agriculture represents 2.79% of the regional area. It appears as relatively small and dispersed patches instead of one large continuous agricultural plain. Grassland is only 0.17% and shrubland 0.07% in the map summary. Those values reinforce what the image suggests: open agricultural and grass-dominated surfaces are present but occupy much less land than either forest or development. They are still useful for identifying local openings within a landscape otherwise shaped by trees, settlements, roads, and water.
Wetlands cover 6.11% and water 4.15%. In this view, their distribution can be compared directly with forest without the visual weight of the red developed class. The wetland category is a remote-sensing land-cover class, not a regulatory wetland boundary. Anyone evaluating permitting, buffers, or protected wetland status should use Connecticut and municipal regulatory mapping. The same caution applies to water edges and small ponds, which may be generalized at the raster resolution.
Impervious cover reveals where developed land is most intensely built
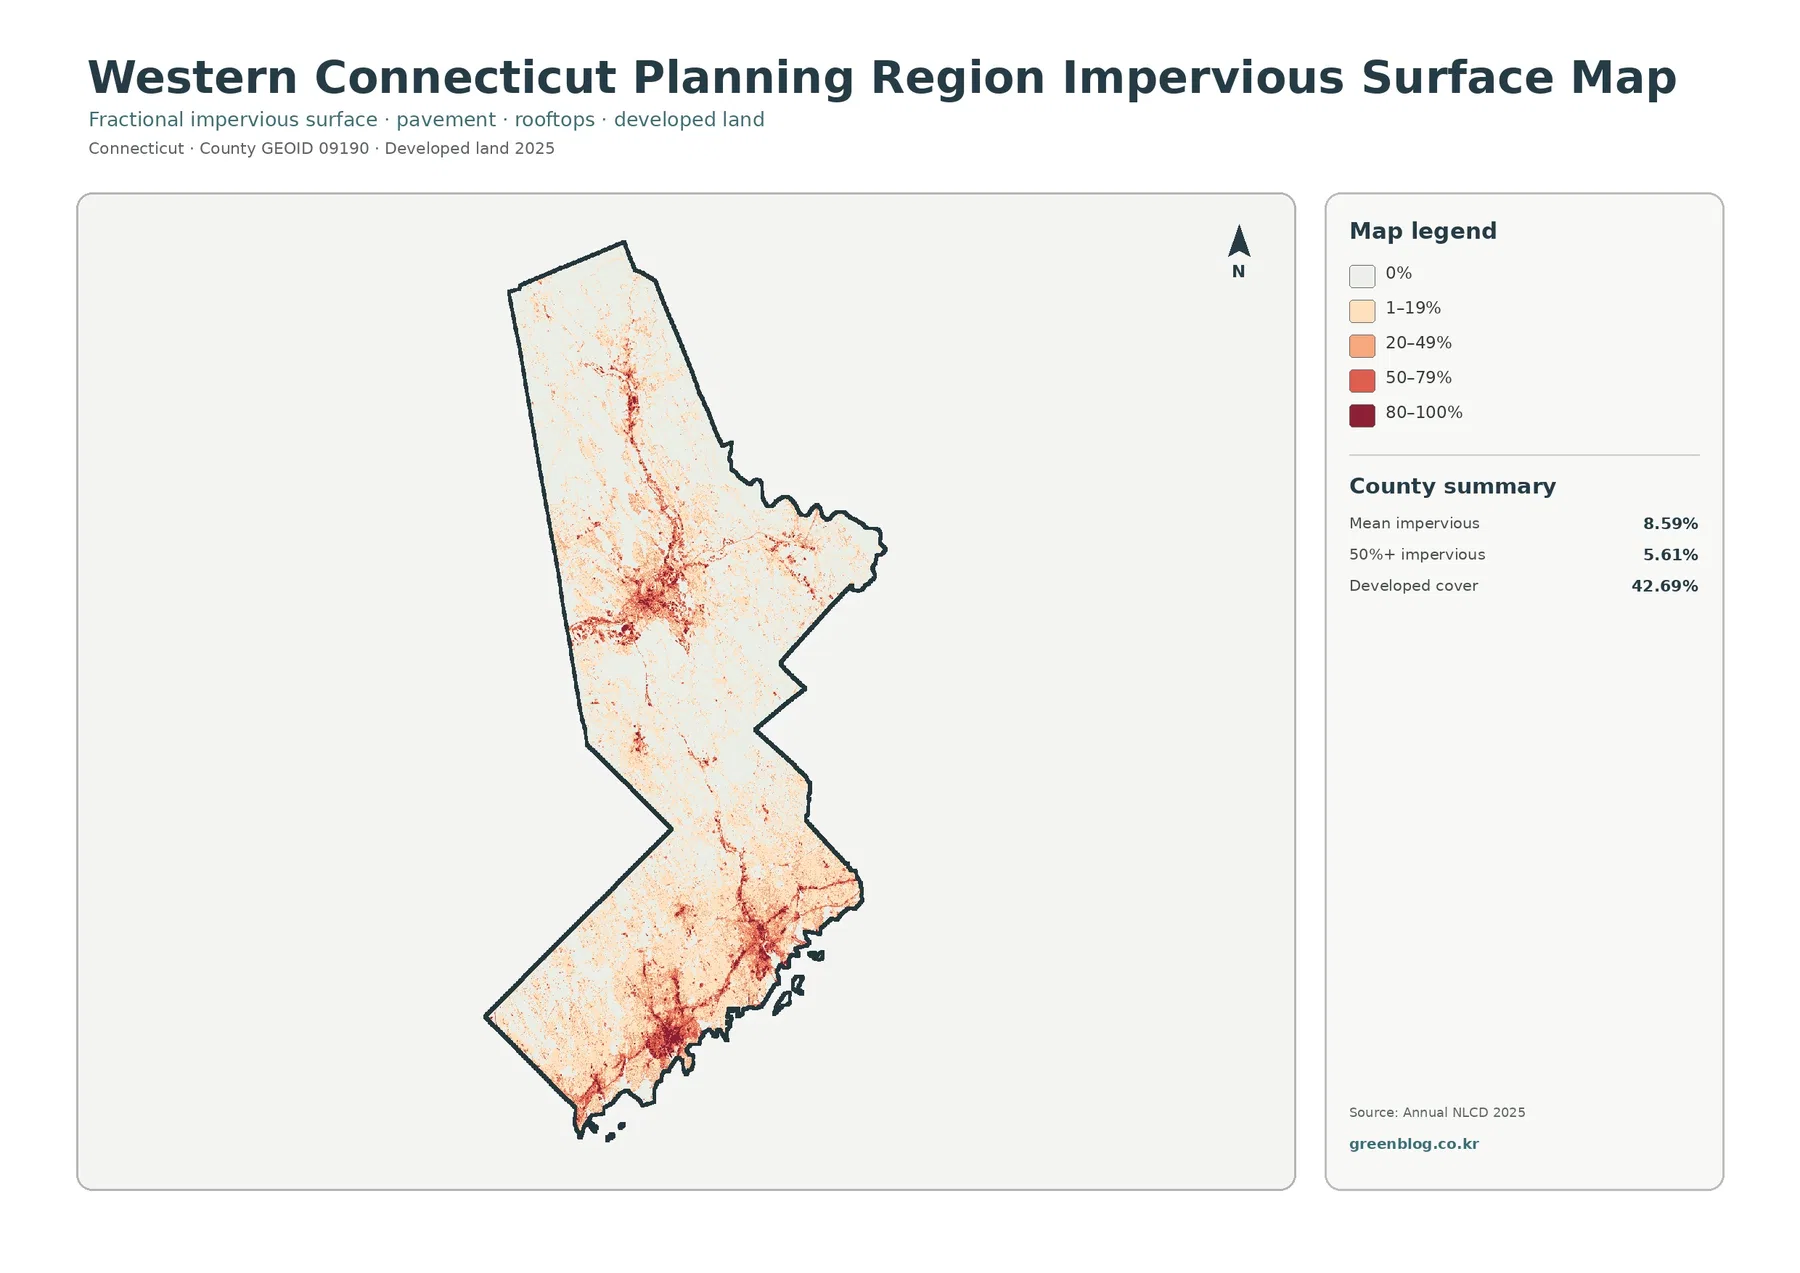
Impervious surface means pavement, rooftops, parking areas, and similar built materials that do not readily absorb water. The regional mean is 8.59%, and 5.61% of the planning region is mapped at 50% impervious or greater. Those numbers are far below the 42.69% developed-land share because a developed land-cover class can also contain lawns, trees, bare soil, and other permeable surfaces. The two measures answer different questions and should not be substituted for each other.
The darkest impervious values cluster along the southern end and around the major inland developed concentration visible near the center of the region. Smaller high-value lines and nodes extend outward from those areas, while much of the northern landscape remains pale. This map therefore distinguishes compact built surfaces from lower-intensity developed areas more effectively than the categorical land-cover map. A place can be classified as developed without being mostly pavement or roof.
For watershed education, impervious cover is useful because it identifies where a larger share of the ground surface may generate runoff rather than absorb rainfall. It is not a stand-alone flood or water-quality model. Slope, soils, drainage systems, precipitation, stream connectivity, and local engineering all affect how water moves. The map can highlight locations worth examining more closely, but hazard conclusions require hydrologic and municipal infrastructure data.
The 1985–2025 comparison marks class differences, not a simple development rate
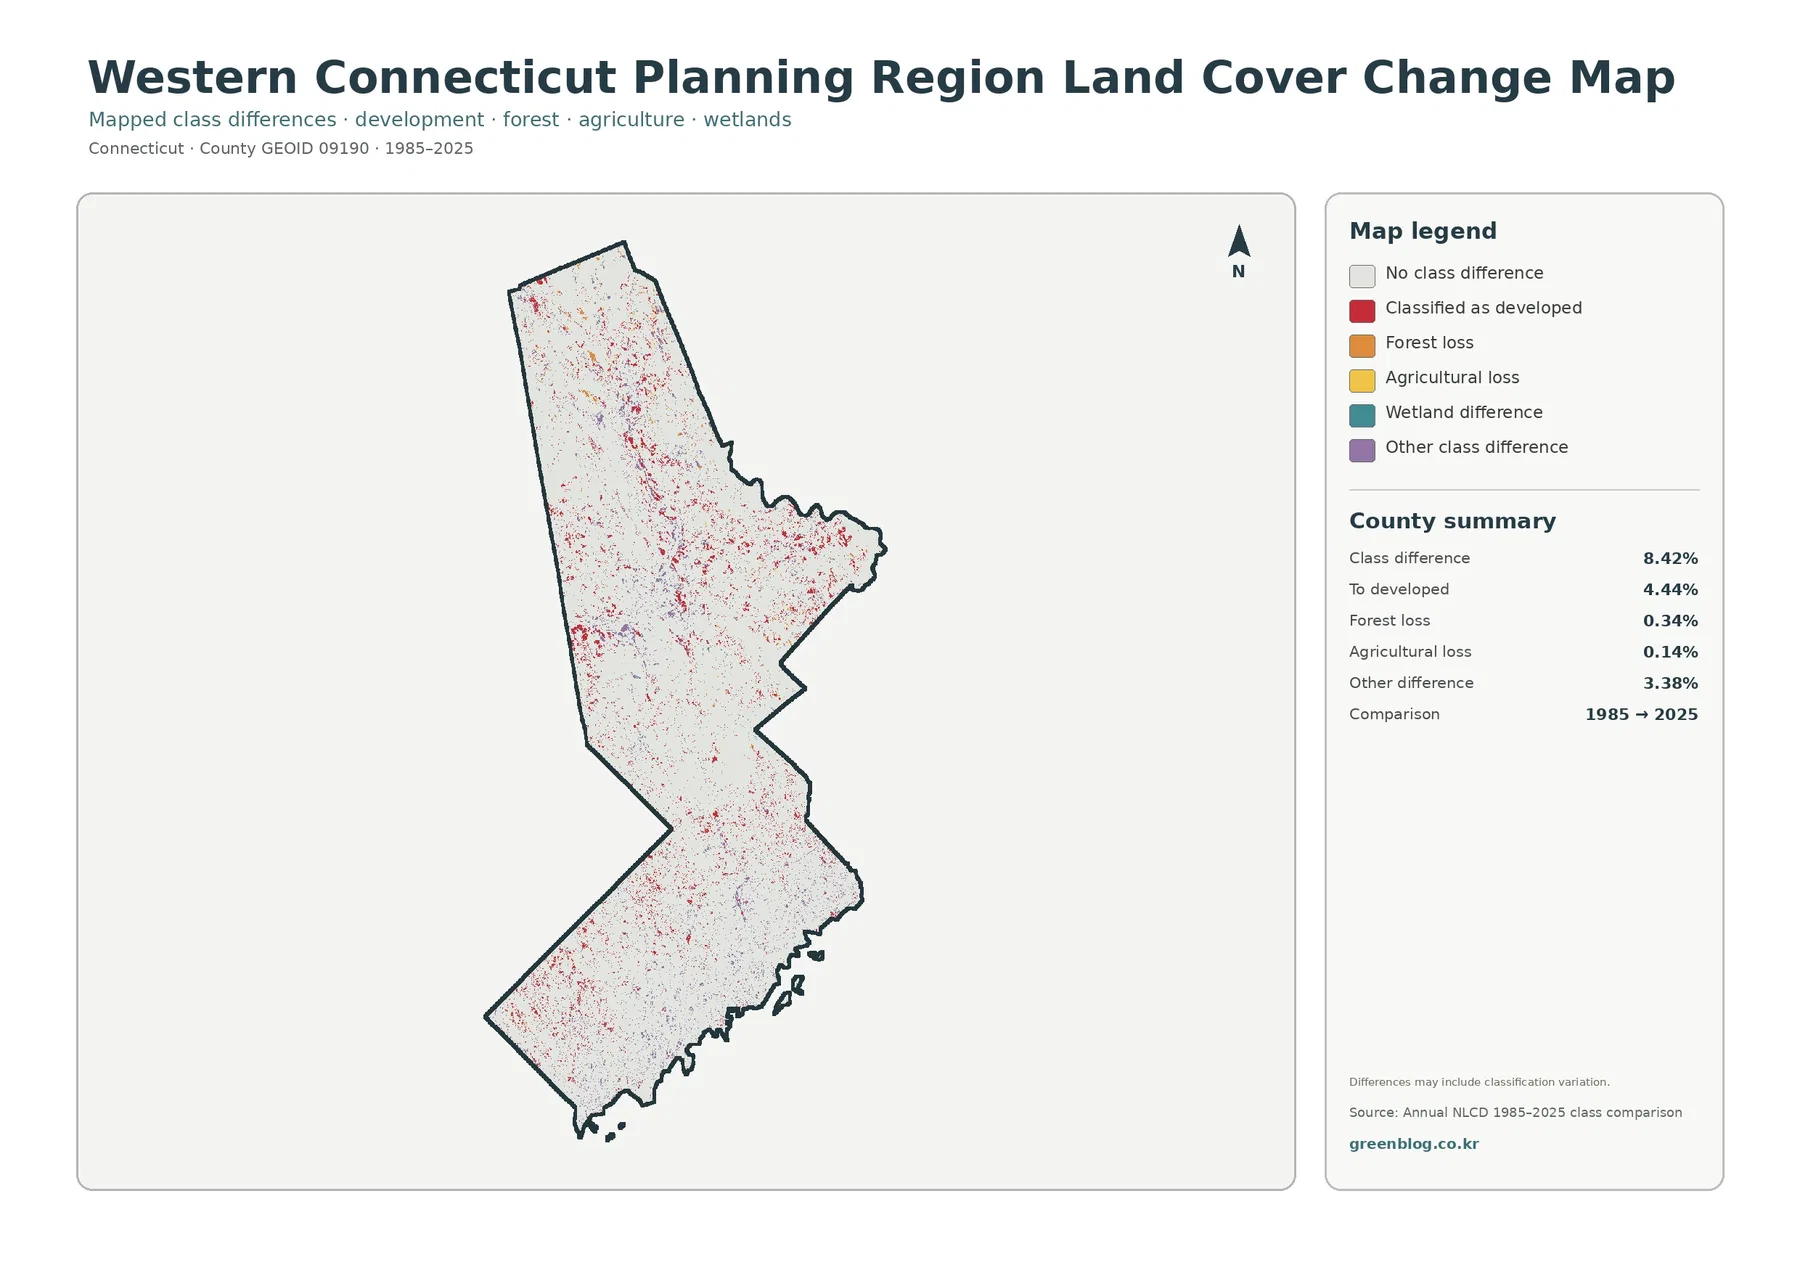
The change map reports a total class difference of 8.42% between 1985 and 2025. Within that summary, 4.44% is identified as areas classified as developed in 2025, 0.34% as forest loss, 0.14% as agricultural loss, and 3.38% as other class difference. Most of the region is shown in the no-class-difference category. The highlighted changes are distributed across the map rather than forming one continuous zone.
It is important not to relabel 8.42% as the region’s development rate. The map itself warns that mapped differences can include classification variation. Even the 4.44% “to developed” category does not identify the project or activity that produced a change at a particular location. Historical aerial imagery, municipal permits, parcel records, and local planning documents would be needed to determine whether a specific difference reflects housing, commercial construction, roads, another land-use change, or classification uncertainty.
The relatively small forest-loss and agricultural-loss percentages should be handled with the same care. They are categories within this map comparison, not a complete accounting of every ecological or agricultural change over forty years. A forest pixel may change class because of a real disturbance, regrowth cycle, mixed land cover, or differences in classification. The best use of the map is to locate clusters of change and then decide where a more detailed historical review is warranted.
Reading the four maps together gives a clearer regional picture
Each view answers a different practical question. The general land-cover map establishes that forest and development are nearly balanced across the region. The forest-and-farmland map removes much of the visual competition from developed areas and makes remaining natural cover easier to trace. The impervious map shows where built surfaces are most concentrated inside the much larger developed class. The change map then separates the current pattern from locations where the 1985 and 2025 classifications differ.
The contrast is particularly useful in a region that combines major coastal and inland centers with large forested areas. A presentation can begin with the 43.87% forest and 42.69% developed shares, then use the impervious map to show why “developed” does not mean “fully paved.” The natural-cover view can follow to highlight wetlands, water, and small agricultural areas. Ending with the change map helps keep current land cover and long-term comparison from being mixed together.
For planning context, the maps can support discussions about open space, watershed conditions, growth patterns, or environmental education, but they do not replace WestCOG or municipal planning documents. For scientific or regulatory work, the maps are better treated as overview graphics. Parcel boundaries, zoning districts, conservation easements, regulated wetlands, road rights-of-way, and site conditions all require more detailed authoritative sources.
Download the four original JPG maps for documents and presentations
The ZIP download contains four JPG files: general land cover, forest and farmland, impervious/developed land, and the 1985–2025 land-cover change map. Each image includes its own legend and planning-region summary, so the maps can be used separately or placed side by side. Keeping the same visual scale across a presentation makes differences between categorical cover, natural cover, impervious intensity, and change much easier to explain.
When placing the maps in a report or slide deck, preserve the original aspect ratio and make sure the legend remains readable. The package asset manifest lists each source JPG at 2480 by 1754 pixels and does not mark the files as meeting its A3 high-resolution reference. That is adequate for many screen and document uses, but very large printing should be tested at the intended size. Enlarging a raster image cannot create detail that is not present in the source.
Always label statistics as regional values. Forest 43.87%, developed land 42.69%, and mean impervious cover 8.59% describe Western Connecticut Planning Region as a whole. They are not Stamford, Danbury, Greenwich, New Milford, or any other individual municipality’s percentage. A town-level result would require a separate analysis using that town’s boundary.
Resolution, dates, and boundaries set the limits of interpretation
Annual NLCD is a raster dataset derived from Landsat imagery. USGS describes the product at 30-meter spatial resolution, meaning that each grid cell summarizes surface conditions at that scale. Narrow roads, small yards, forest edges, tiny wetlands, and mixed built-and-green areas can be simplified within a cell. Zooming farther into the image does not turn the map into a parcel survey or a site plan.
The current land-cover and impervious maps represent 2025 classification, while the comparison map looks from 1985 to 2025. Construction, clearing, regrowth, wetland changes, or shoreline changes after 2025 may not appear. At the same time, not every highlighted difference between 1985 and 2025 should be interpreted as a confirmed physical change without supporting historical evidence.
The planning-region outline is also broader than local decision-making boundaries. This image does not display town lines, zoning districts, property ownership, or legal wetland boundaries. Use it to understand regional land-cover patterns and to decide what deserves closer study. When the question concerns a specific property, permit, conservation restriction, or municipal policy, consult the relevant local or state source.
Frequently Asked Questions
Does 43.87% forest and 42.69% developed land mean the region is split evenly everywhere?
No. Those are region-wide shares, not a uniform pattern. Developed cover is concentrated most strongly in the south and around major centers, while larger and more continuous forest areas are visible across much of the northern and inland region.
Why is developed land 42.69% when mean impervious cover is only 8.59%?
Developed land can include lawns, trees, soil, and other permeable surfaces around buildings and roads. Impervious cover measures the fraction of pavement, rooftops, and similar constructed surfaces, so it is expected to be lower than the broader developed-land class.
Can the 8.42% 1985–2025 class difference be used as a development-growth rate?
No. It is the share where mapped classes differ between the two years, and 4.44% is separately identified as changing to the developed class. Classification variation can also contribute, so detailed historical sources are needed to explain individual locations.
Sources and reference material
- MRLC Annual NLCD Data – source context for annual land cover and impervious products
- USGS Annual National Land Cover Database – product description and 30-meter spatial resolution
- U.S. Census Bureau TIGER/Line Shapefiles – county-equivalent planning-region boundary context
- Western Connecticut Council of Governments – member municipalities and regional organization
- WestCOG 2020–2030 Plan of Conservation and Development – regional planning and natural-resource context
Map File Information
Download four JPG maps covering 2025 land cover, forest and farmland, impervious/developed land, and the 1985–2025 land-cover comparison in one ZIP file.
- Included Files: 4 JPG maps
Related Maps
- Capitol Planning Region Connecticut Land Cover Map
- Connecticut Northwest Hills Planning Region Land Cover Map
- Greater Bridgeport Planning Region Connecticut Land Cover Map
Green Map creates custom-edited map images using open geographic data sources such as geoBoundaries, Natural Earth, OpenStreetMap, and government open data.
These maps are edited visual materials, not raw data files, and are provided for education, documents, presentations, and graphic reference.