Shelby County Alabama Land Cover Map readers can quickly see a county that is still mostly forested but has a pronounced developed belt on its western side. The 2025 maps separate forest, developed land, agriculture, wetlands, water, and other cover, then provide focused views of forest and farmland, impervious surfaces, and mapped class differences between 1985 and 2025.
The four original JPG maps are available together in one download near the end of this page. Each file is 2480 × 1754 pixels, while the WebP images in the article are lighter previews for browsing. The set works well for county-scale reference, classroom comparison, presentations, and discussions about where developed surfaces, forest, farmland, and water occur across Shelby County.
Table of Contents
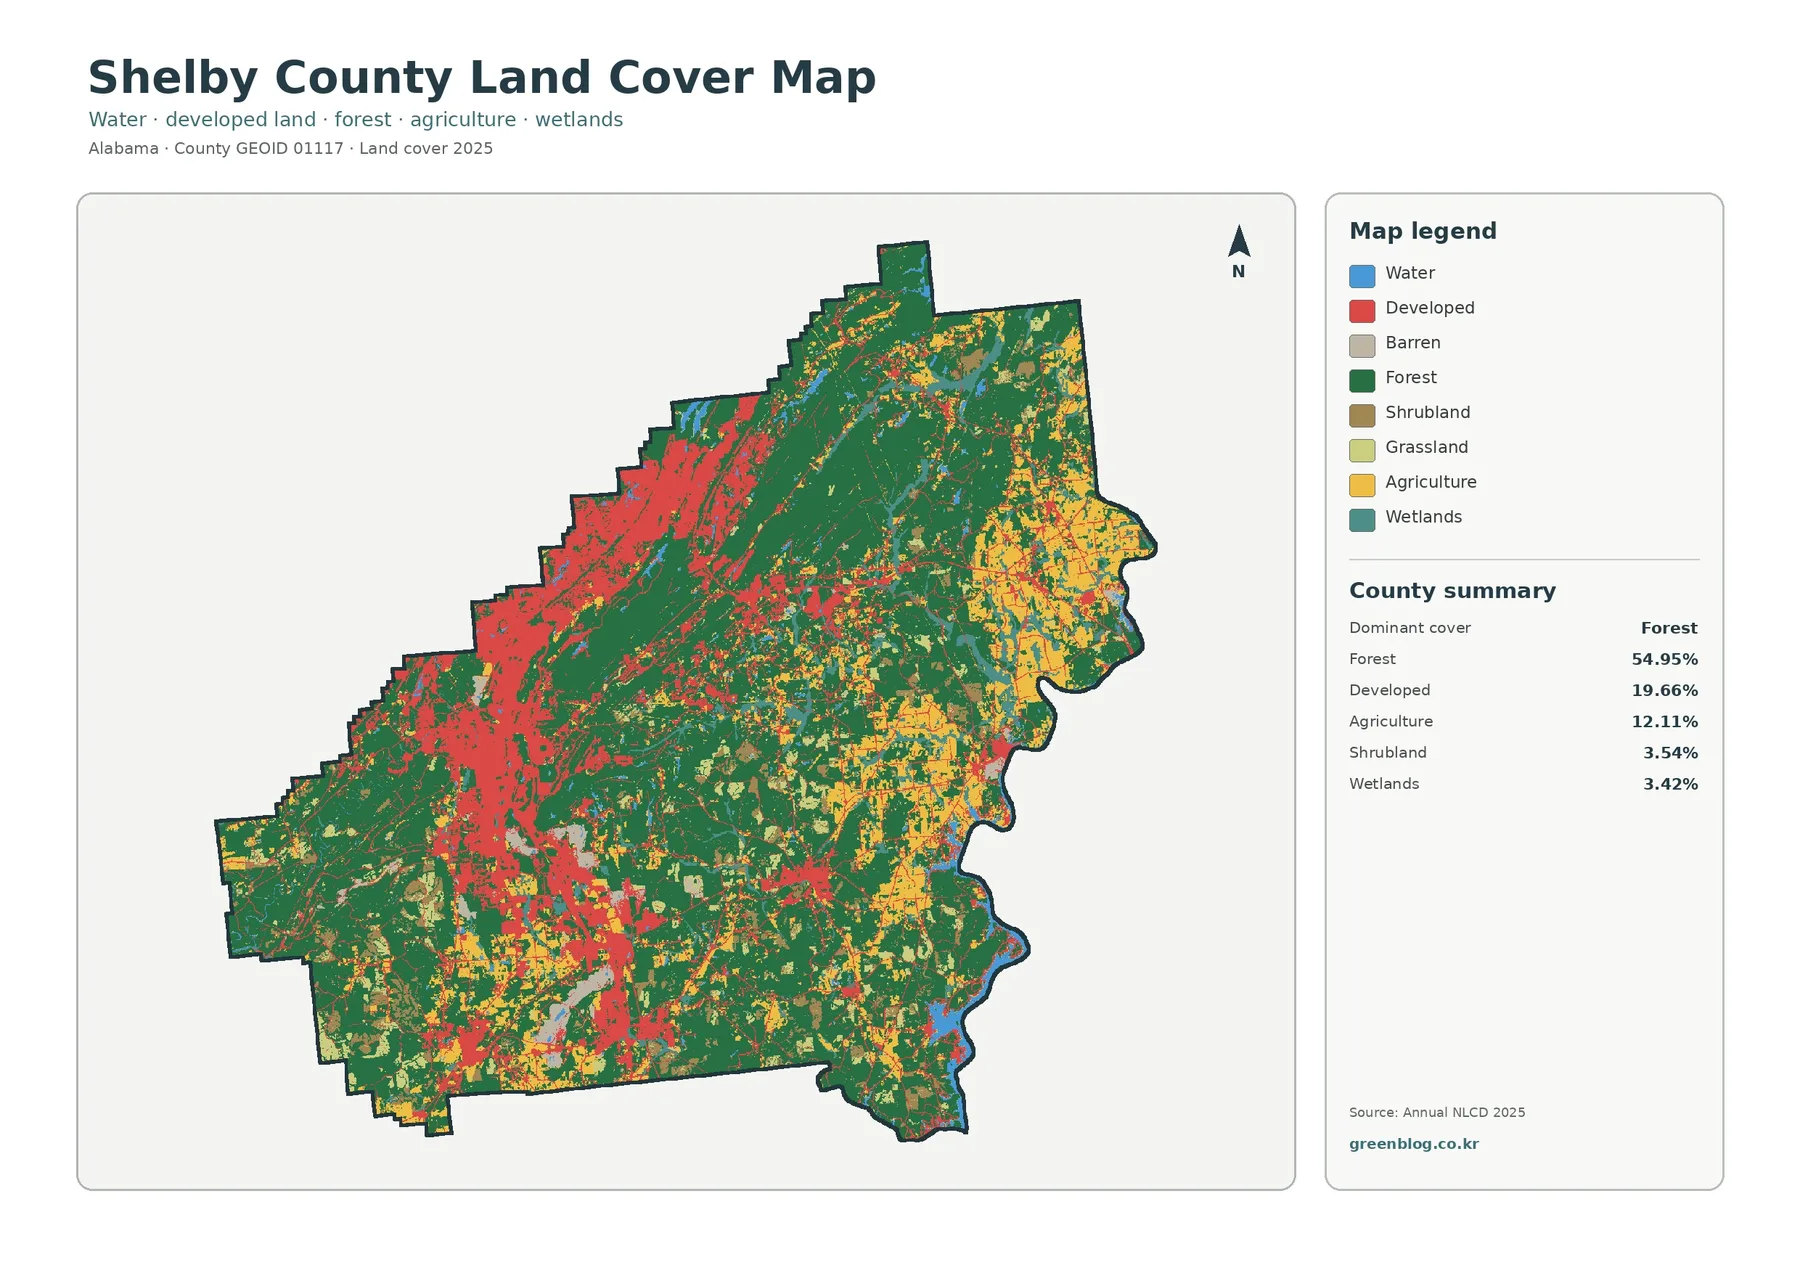
Forest remains the majority cover, even beside a large developed corridor
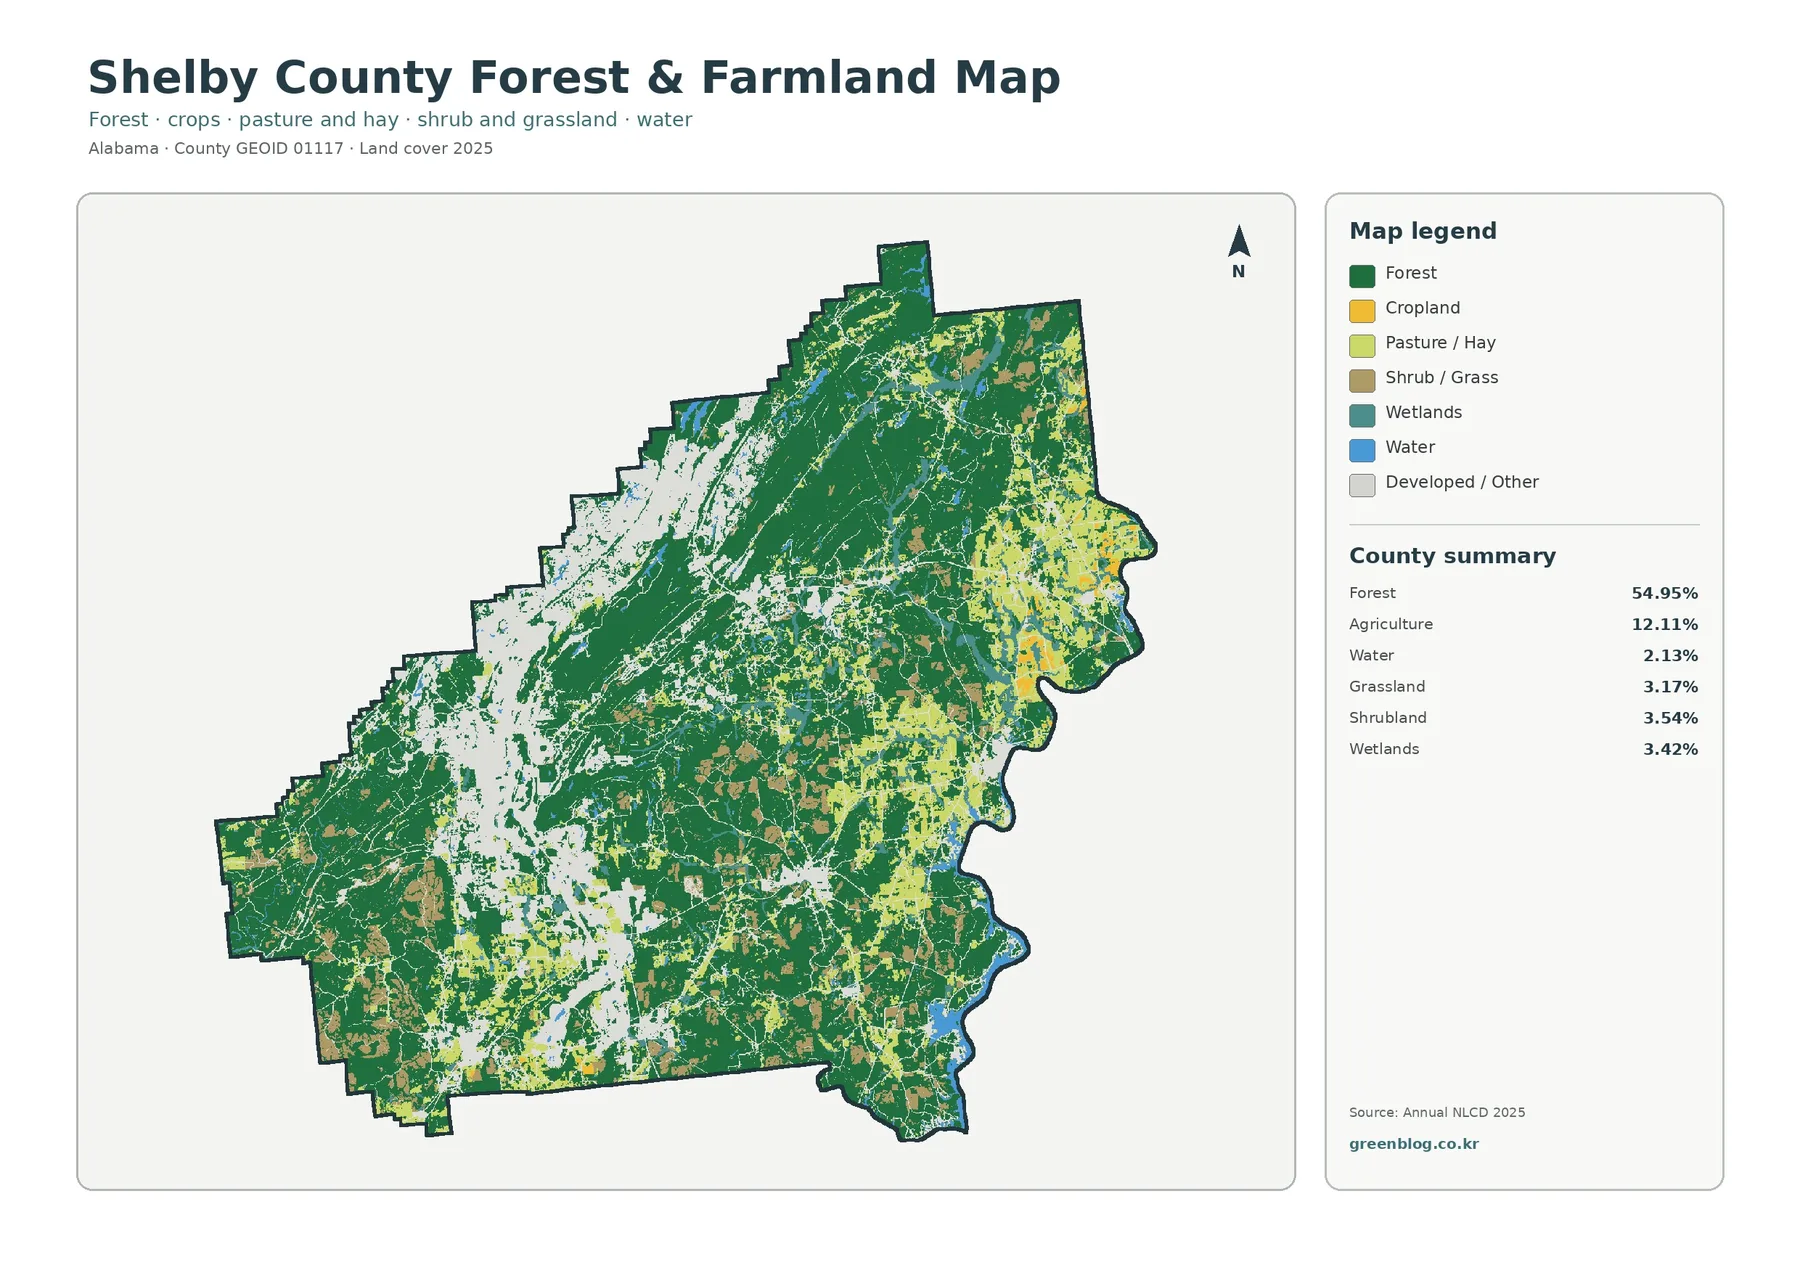
The 2025 county summary identifies forest as the dominant cover at 54.95%. Developed land accounts for 19.66% and agriculture for 12.11%, followed by shrubland at 3.54% and wetlands at 3.42%. Those percentages give a useful starting point, but the map adds an important second layer of information: the classes are not spread evenly. A broad concentration of developed cover occupies much of the western half, while forest continues through large central and eastern areas and agriculture becomes more conspicuous toward the east and southeast.
Imperviousness reveals where the western development belt is most concentrated
The impervious-surface view asks a different question from the general land-cover map. Instead of classifying a cell simply as developed or not developed, it represents the fraction of the surface occupied by pavement, rooftops, parking areas, and other hard surfaces that do not readily absorb water. Shelby County’s mean imperviousness is 5.34%, and 3.45% of the mapped area falls in the 50% or greater impervious category. The general developed-cover share, by comparison, is 19.66%.
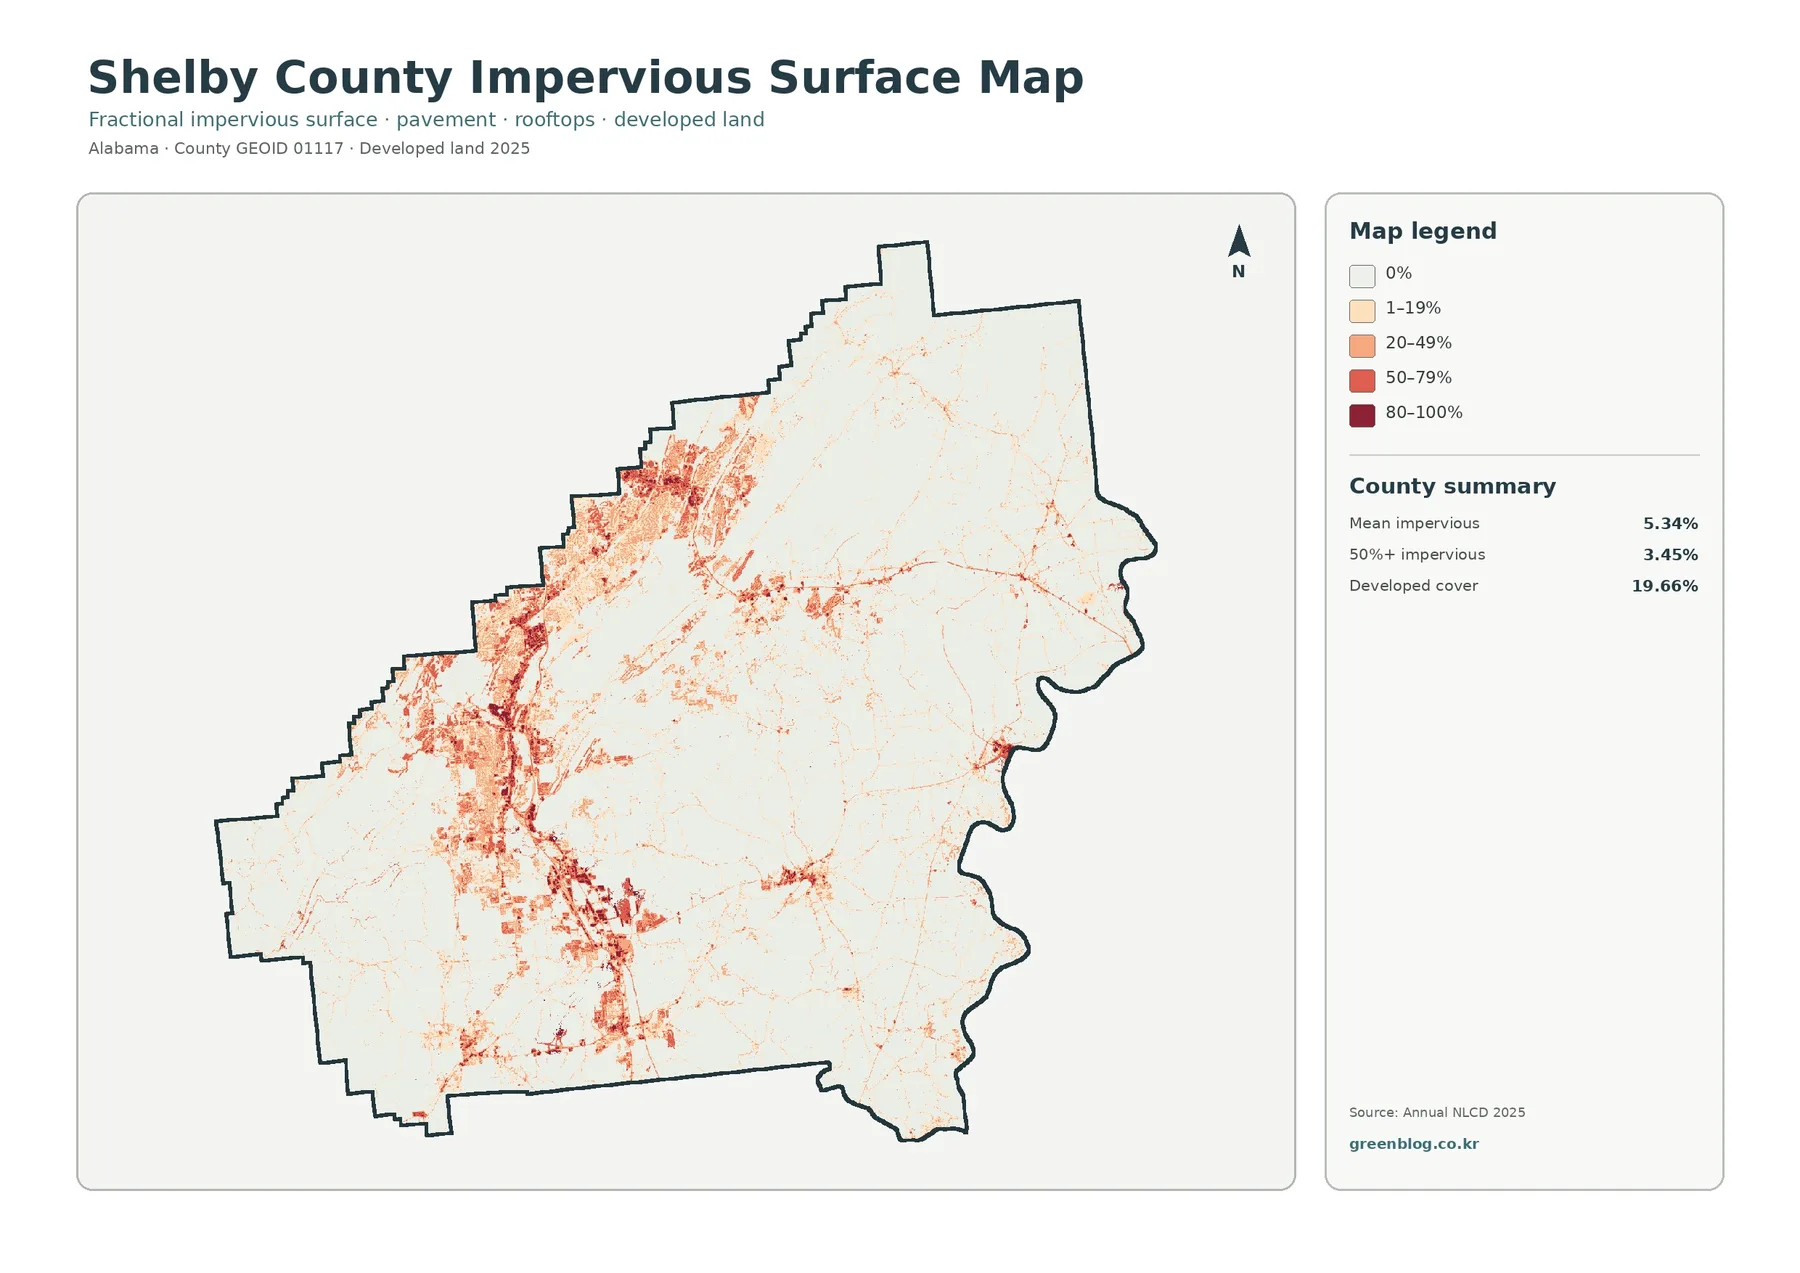
The darkest red and orange values are heavily concentrated in the west and northwest, then continue through west-central areas toward the south. Thin linear features connect larger concentrations, while the eastern half is mostly pale with scattered nodes and narrow lines. This makes the map useful for distinguishing a broad developed classification from the places where hard surfaces are actually most concentrated. A developed neighborhood with substantial vegetation, for example, can still belong to a developed land-cover class without having an extremely high impervious fraction.
Shelby County’s official planning and hazard-mitigation materials provide useful local context for this pattern. The county identifies I-65 as running through the western portion and describes the I-65/US 31 and US 280 corridors as major areas of residential, commercial, and industrial land use. That context is consistent with the western concentration visible in the impervious and developed-cover maps. It should not be treated as proof that a particular road caused a specific mapped change, however; the maps show location and classification, not a complete history of development decisions.
Removing the strong development colors makes the forest–farm contrast easier to follow
The forest-and-farmland version tones down developed and other cover so that vegetation patterns become easier to compare. Forest remains 54.95% and agriculture 12.11%. The summary also reports water at 2.13%, grassland at 3.17%, shrubland at 3.54%, and wetlands at 3.42%. These smaller categories matter because they occupy transition areas between large forest blocks, farmed areas, water, and the developed corridor.
The 1985–2025 map measures class differences, not a single development rate
The long-term comparison summarizes places where the mapped class in 2025 differs from the corresponding 1985 class. The panel reports an overall class difference of 36.96%. Within that comparison, 9.14% is labeled as transition to developed, 7.68% as forest loss, 2.09% as agricultural loss, and 17.82% as other class difference. Wetland difference is also shown as a mapped legend category even though it is not listed separately in the short summary panel.
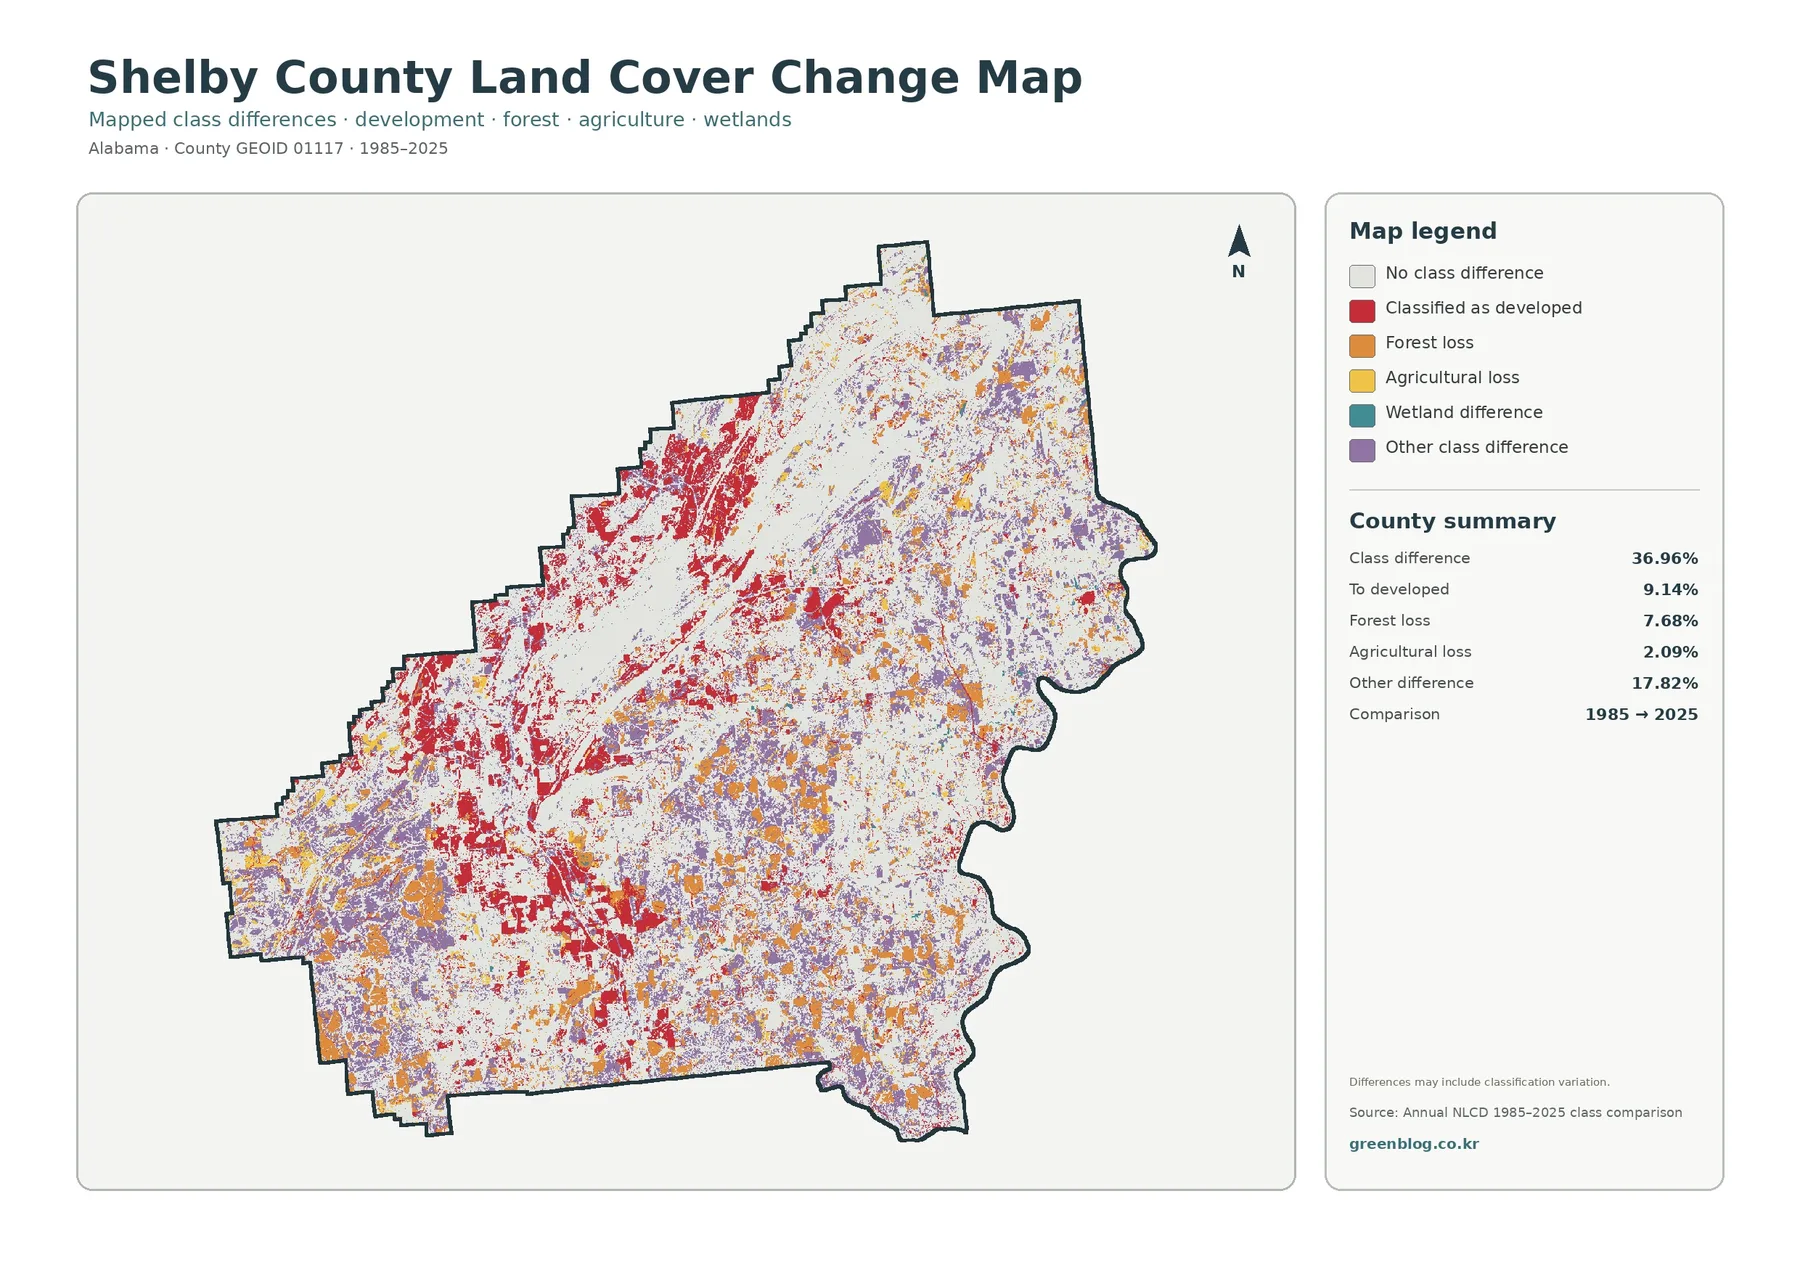
A 36.96% class difference does not mean that 36.96% of Shelby County was developed between 1985 and 2025. The specific to-developed category is 9.14%, while the remainder includes forest loss, agricultural loss, wetland differences, and other changes. The map also warns that differences can include classification variation. Edges of forest, small ponds, narrow roads, and mixed land-cover cells can shift category without representing a simple one-direction physical conversion on the ground.
Choose the map that matches the question you are trying to answer
Start with the general Shelby County Alabama Land Cover Map when you need all major classes in one view. Use the forest-and-farmland version to compare vegetation and open agricultural cover, the impervious map to locate concentrations of hard surface, and the change map to find where 1985 and 2025 classifications differ. In lessons or presentations, keeping the county outline at the same orientation makes it easy to compare the western development belt, central forest, eastern agriculture, and scattered water features without crowding all four themes into one image.
Download the four original Shelby County JPG maps
The archive contains one original JPG for each map shown on this page: general land cover, forest and farmland, impervious/developed land, and the 1985–2025 land-cover comparison. Every file measures 2480 × 1754 pixels. These are the source-size images provided for the post rather than the smaller WebP previews used in the article.
Scale, classification, and date matter when interpreting the maps
Annual NLCD products are raster based and use 30-meter spatial resolution derived from Landsat imagery. At that scale, each cell summarizes an area rather than tracing a precise parcel or object. A narrow stream, small building, road edge, or patch of trees can share a cell with another surface type. The resulting maps are very useful for county-wide pattern comparison, but their colored boundaries should not be copied as legal or surveyed boundaries.
Land cover should also remain separate from zoning and land use. The county’s Comprehensive Plan addresses growth, transportation, natural resources, land use, and future development, while the map on this page classifies what covers the ground. A red developed pixel does not grant development rights, and a green forest pixel does not guarantee conservation protection. Anyone making a property, permitting, engineering, or regulatory decision should use the appropriate current county records and professional site information.
Frequently Asked Questions
What is the largest 2025 land-cover class in Shelby County?
Forest is the largest class at 54.95%. Developed land is 19.66% and agriculture is 12.11%. The map also shows that these classes are unevenly distributed, with a stronger developed concentration in the west and more agricultural cover visible toward eastern and southern areas.
Does 19.66% developed cover mean 19.66% of the county is paved?
No. Developed cover is a land-cover classification, while imperviousness measures the fraction of hard surface within mapped cells. The mean impervious value is 5.34%, and 3.45% of the county is mapped at 50% or greater imperviousness. The two measures are related but are not interchangeable.
Does the 36.96% class difference mean that much land was newly developed?
No. The 36.96% figure combines multiple mapped class differences. Transition to developed is listed separately at 9.14%, with forest loss at 7.68%, agricultural loss at 2.09%, and other class differences at 17.82%. The map also notes that classification variation can contribute to differences.
What is included in the download?
The ZIP contains four 2480 × 1754 JPG files: the general 2025 land-cover map, forest-and-farmland map, impervious/developed-land map, and the 1985–2025 land-cover change map. The WebP images displayed in the article are previews and are not the four original JPG download files.
Map File Information
Shelby County Land Cover Map Files
- Included Files: Use only the versions confirmed in the article and supplied images
- File Type: Use the confirmed download contents
- Intended Use: Printing, education, presentations, and map-based projects
Related Maps
- Autauga County Alabama Land Cover Map
- Baldwin County Alabama Land Cover Map
- Barbour County Alabama Land Cover Map
Sources and reference links
- MRLC Annual NLCD — annual land-cover and related products, including the 1985–2025 record
- USGS Annual NLCD Land Cover Classification — definitions for mapped land-cover classes
- U.S. Census Bureau TIGER/Line Shapefiles — official geographic boundary data
- Shelby County Comprehensive Plan — county planning context for growth, land use, transportation, and natural resources
- Shelby County Multi-Jurisdictional Hazard Mitigation Plan — local transportation and land-use corridor context
Green Map creates custom-edited map images using open geographic data sources such as geoBoundaries, Natural Earth, OpenStreetMap, and government open data.
These maps are edited visual materials, not raw data files, and are provided for education, documents, presentations, and graphic reference.