This page provides four Lowndes County Alabama land cover maps and the four matching original JPG files in one ZIP download. Forest is the largest 2025 class at 41.22 percent, followed by agriculture at 31.21 percent and wetlands at 15.07 percent. Broad forest cover is especially prominent across the southern and western portions of the county, while farm cover and wetlands form a more mixed pattern through much of the center, north, and east.
The four views cover general land cover, forest and farmland, impervious surface and developed land, and class differences from 1985 to 2025. The WebP images below are lighter previews, while the download section contains four 2480×1754-pixel original JPGs for printing, classroom work, presentations, and county comparisons. They describe county-scale surface cover, not parcel ownership, zoning, survey boundaries, building rights, or regulatory wetland limits.
Table of Contents
A forest-led landscape in 2025
Lowndes County is not dominated by one continuous land-cover type even though forest ranks first. Dark green forest covers large areas in the south and west, but the center and northern half contain a much finer mix of forest, agriculture, and wetlands. Yellow agricultural cover becomes especially noticeable across broad central and eastern sections. Teal wetlands occupy irregular patches and bands that interrupt both the wooded and farmed areas, giving the county a more varied appearance than the top two percentages alone suggest.
| Reference | Annual NLCD 2025 |
|---|---|
| Forest | 41.22% |
| Agriculture | 31.21% |
| Wetlands | 15.07% |
| Developed | 4.30% |
| Grassland | 4.04% |
| Shrubland | 2.70% |
| Water | 1.30% |
| Mean impervious | 0.69% |
| 50%+ impervious | 0.19% |
| 1985→2025 class difference | 30.63% |
Wetlands deserve separate attention because they account for 15.07 percent, a much larger share than open water at 1.30 percent. The teal class appears in several broad and irregular areas rather than as one isolated patch. That pattern matters when reading the county because a small water percentage does not mean water-related cover is unimportant. Wetlands and open water are different classes, and combining them into a single “water” category would hide one of the most visible features of the 2025 distribution.
Developed cover makes up only 4.30 percent. Red pixels and small clusters are scattered rather than forming one large urban block, and thin lines extend between some of the clusters. This makes the county useful for comparing rural land cover with small concentrations of built surfaces. The developed percentage should not be treated as a population measure, and the thin lines should not be assigned road names from this image alone because the preview does not label transportation features.
Where forest, fields, and wetlands meet
The general 2025 view is most useful when the goal is to understand the county as a whole. Forest occupies much of the southern half and several western areas, while agriculture becomes more prominent through the center, north, and east. Wetlands break up both classes in irregular shapes. The result is a patchwork in which large rural covers dominate but their boundaries change noticeably from one part of the county to another.
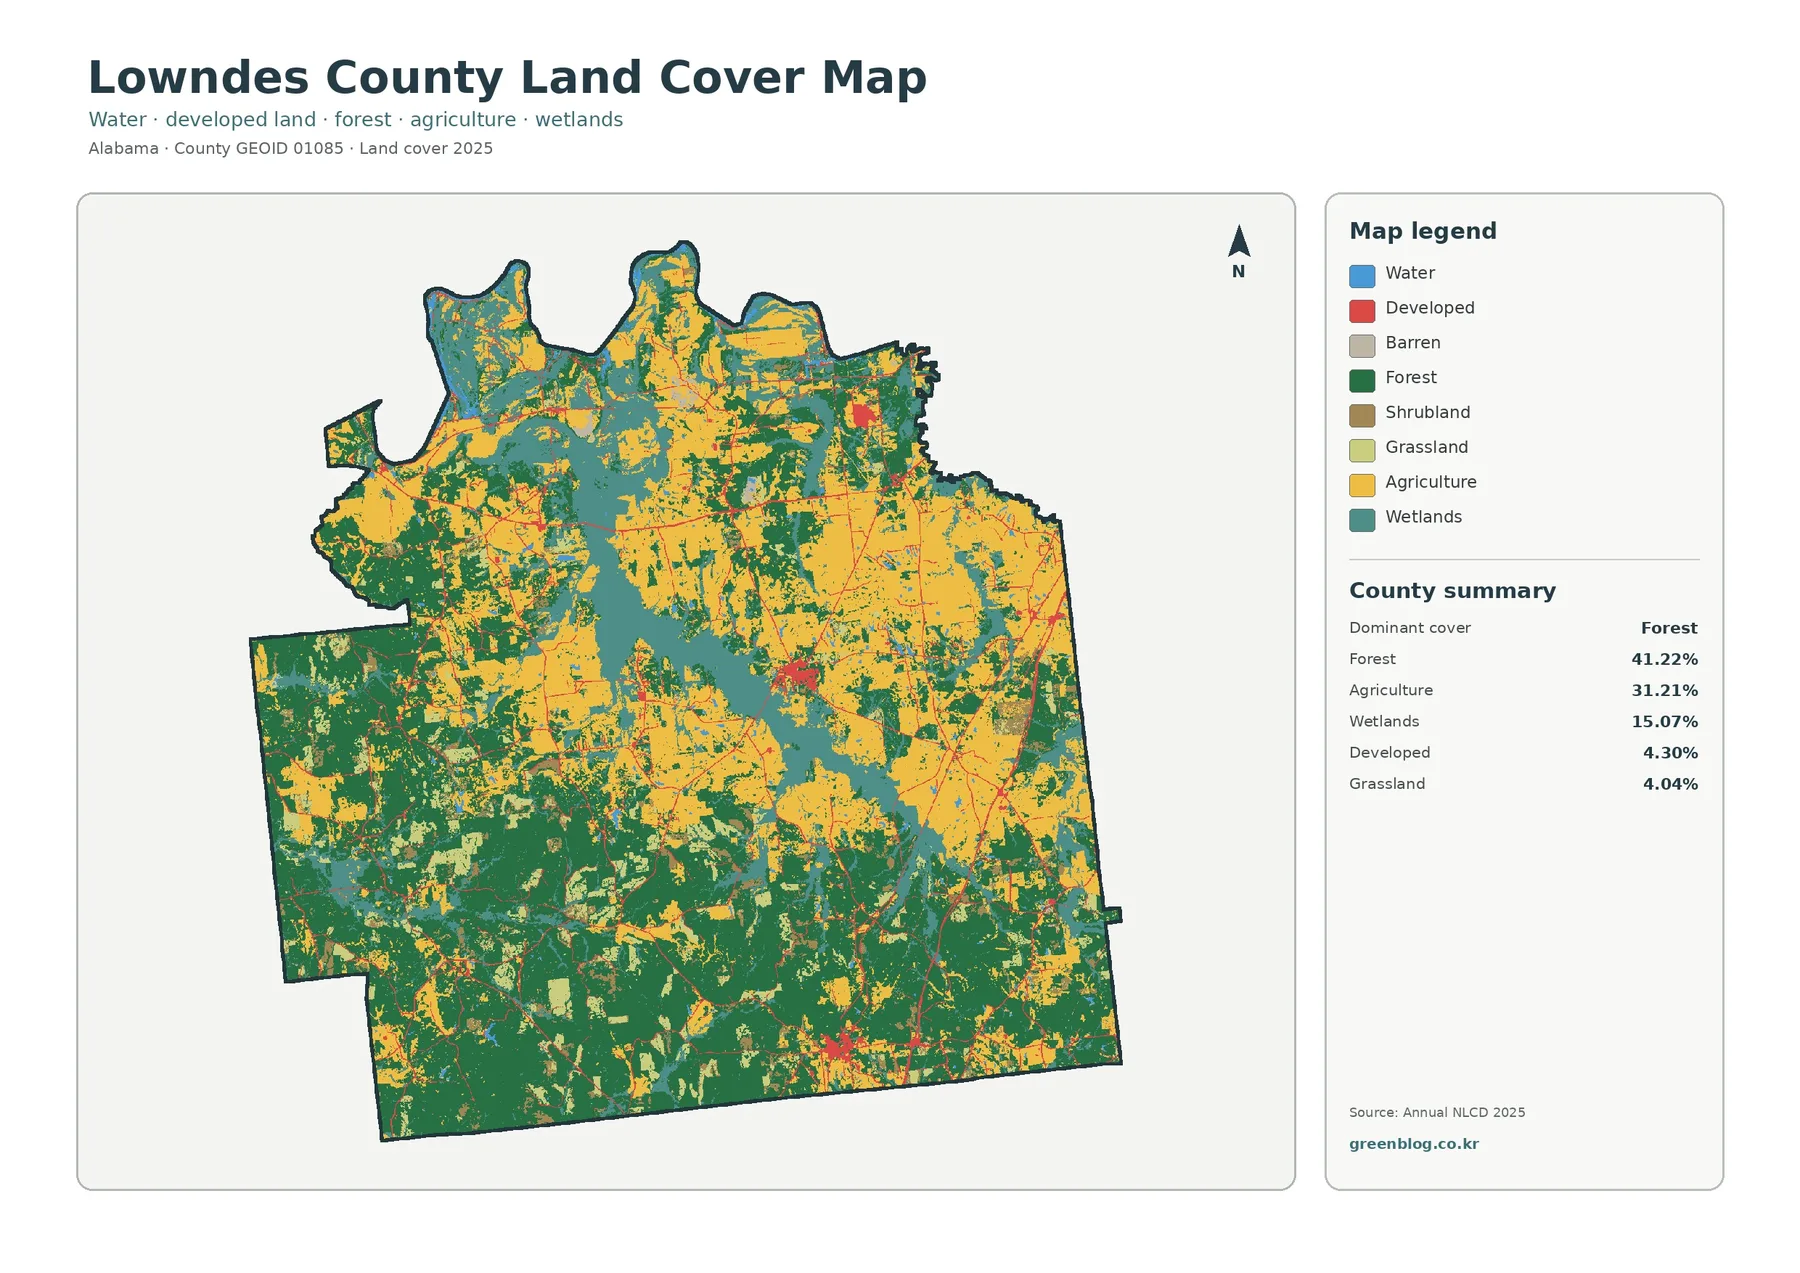
The southern forest is visually different from the more divided pattern farther north. Large dark-green areas remain connected across substantial parts of the south, whereas yellow farm cover and teal wetlands appear more frequently in the central and northern sections. Eastern areas also contain broad agricultural patches mixed with forest. These differences are visible land-cover classifications, not statements about ownership, farm boundaries, or the management history of individual properties.
Alabama Cooperative Extension’s Lowndes County annual report provides useful local context without replacing the land-cover evidence. It lists agronomic crops and animal science and forages among county agriculture programs, and it also describes forestry and wildlife education. Those programs help explain why forest and agricultural cover are practical subjects for local education and resource discussions. They do not, however, identify the class of any particular raster cell, so the percentages and spatial descriptions here remain based on the supplied Annual NLCD products.
A closer look at the rural cover
The forest-and-farmland view removes some of the visual competition from developed and other classes. Forest, cropland, pasture and hay, shrub and grass cover, wetlands, and water become easier to compare directly. Large forest blocks stand out in the south, while agricultural cover appears repeatedly through the central and northern portions. Wetlands remain conspicuous, showing that they are not simply a minor edge feature beside the dominant forest and farm classes.
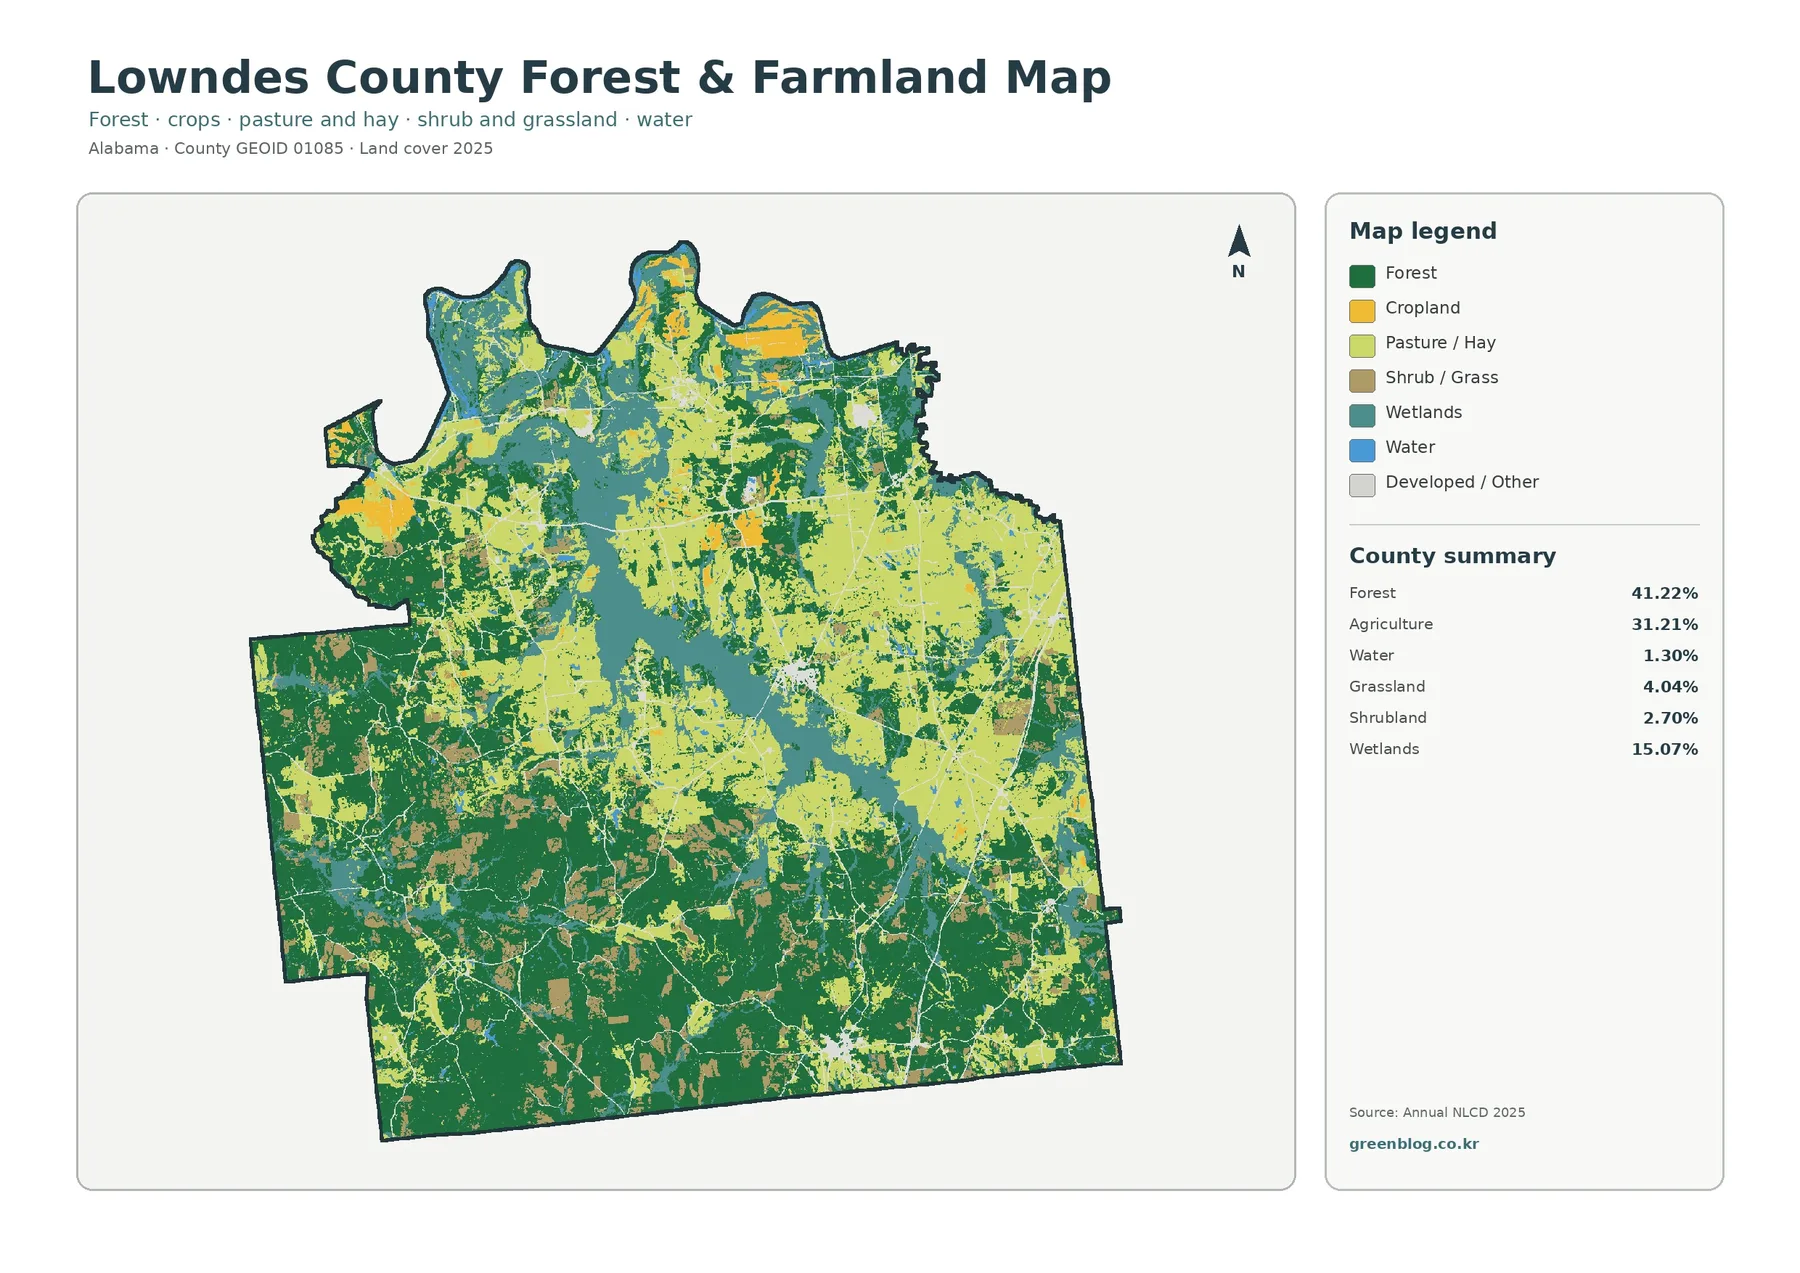
Agriculture is summarized at 31.21 percent, but the image makes clear that it is not one uninterrupted farm belt. Some yellow fields form large blocks, while other agricultural areas are broken by forest or wetlands. The view also distinguishes pasture and hay from cropland in the legend, which is useful when examining local variation even though the county summary combines agriculture into one headline percentage. It does not identify crop species, farm ownership, grazing intensity, or productivity.
Grassland accounts for 4.04 percent and shrubland for 2.70 percent. They are smaller than forest or agriculture but still large enough to appear as recurring pieces of the rural mosaic. Their boundaries may be sensitive to vegetation condition and classification rules, especially where open land grades into young woody cover or managed fields. For a classroom exercise, these smaller classes can be used to show why a legend matters: two areas that both look “open” at first glance may belong to different categories.
Wetlands are much more extensive than open water
Lowndes County’s 15.07 percent wetland share is one of the most important numbers in the 2025 summary. Teal wetland cover appears across the north and center and continues into western and southern sections in irregular patches. Open water, by comparison, accounts for 1.30 percent. The contrast is a useful reminder that a county can contain substantial water-influenced land cover even when the mapped open-water surface occupies a relatively small percentage.
Wetland and agricultural colors often sit close to one another in the preview. That adjacency can support questions about where to look more closely in a watershed or habitat study, but it does not prove a cause-and-effect relationship between farming and wetland condition. The Annual NLCD wetland classes also are not regulatory wetland determinations. Anyone making a permitting, development, or property decision should consult the appropriate current regulatory and field-based information rather than using this county-scale classification as a legal boundary.
The small open-water percentage should also be interpreted at the scale of the raster. Narrow streams and small water features may occupy only part of a 30-meter cell and can be generalized into a neighboring class. For detailed stream networks, drainage design, or flood analysis, hydrologic data and elevation information are better suited to the task. The land-cover product is strongest when the question is where broad surface classes cluster and how they relate to one another across the county.
Developed cover is limited, and hard surfaces are even more concentrated
An impervious surface is pavement, a rooftop, or another hard surface that does not readily absorb rainfall. The mean impervious value for Lowndes County is 0.69 percent, and only 0.19 percent of the county is summarized at 50 percent impervious or greater. Both values are much lower than the 4.30 percent developed-cover share because a developed class can include lawns, trees, soil, and other permeable surfaces around buildings and roads.
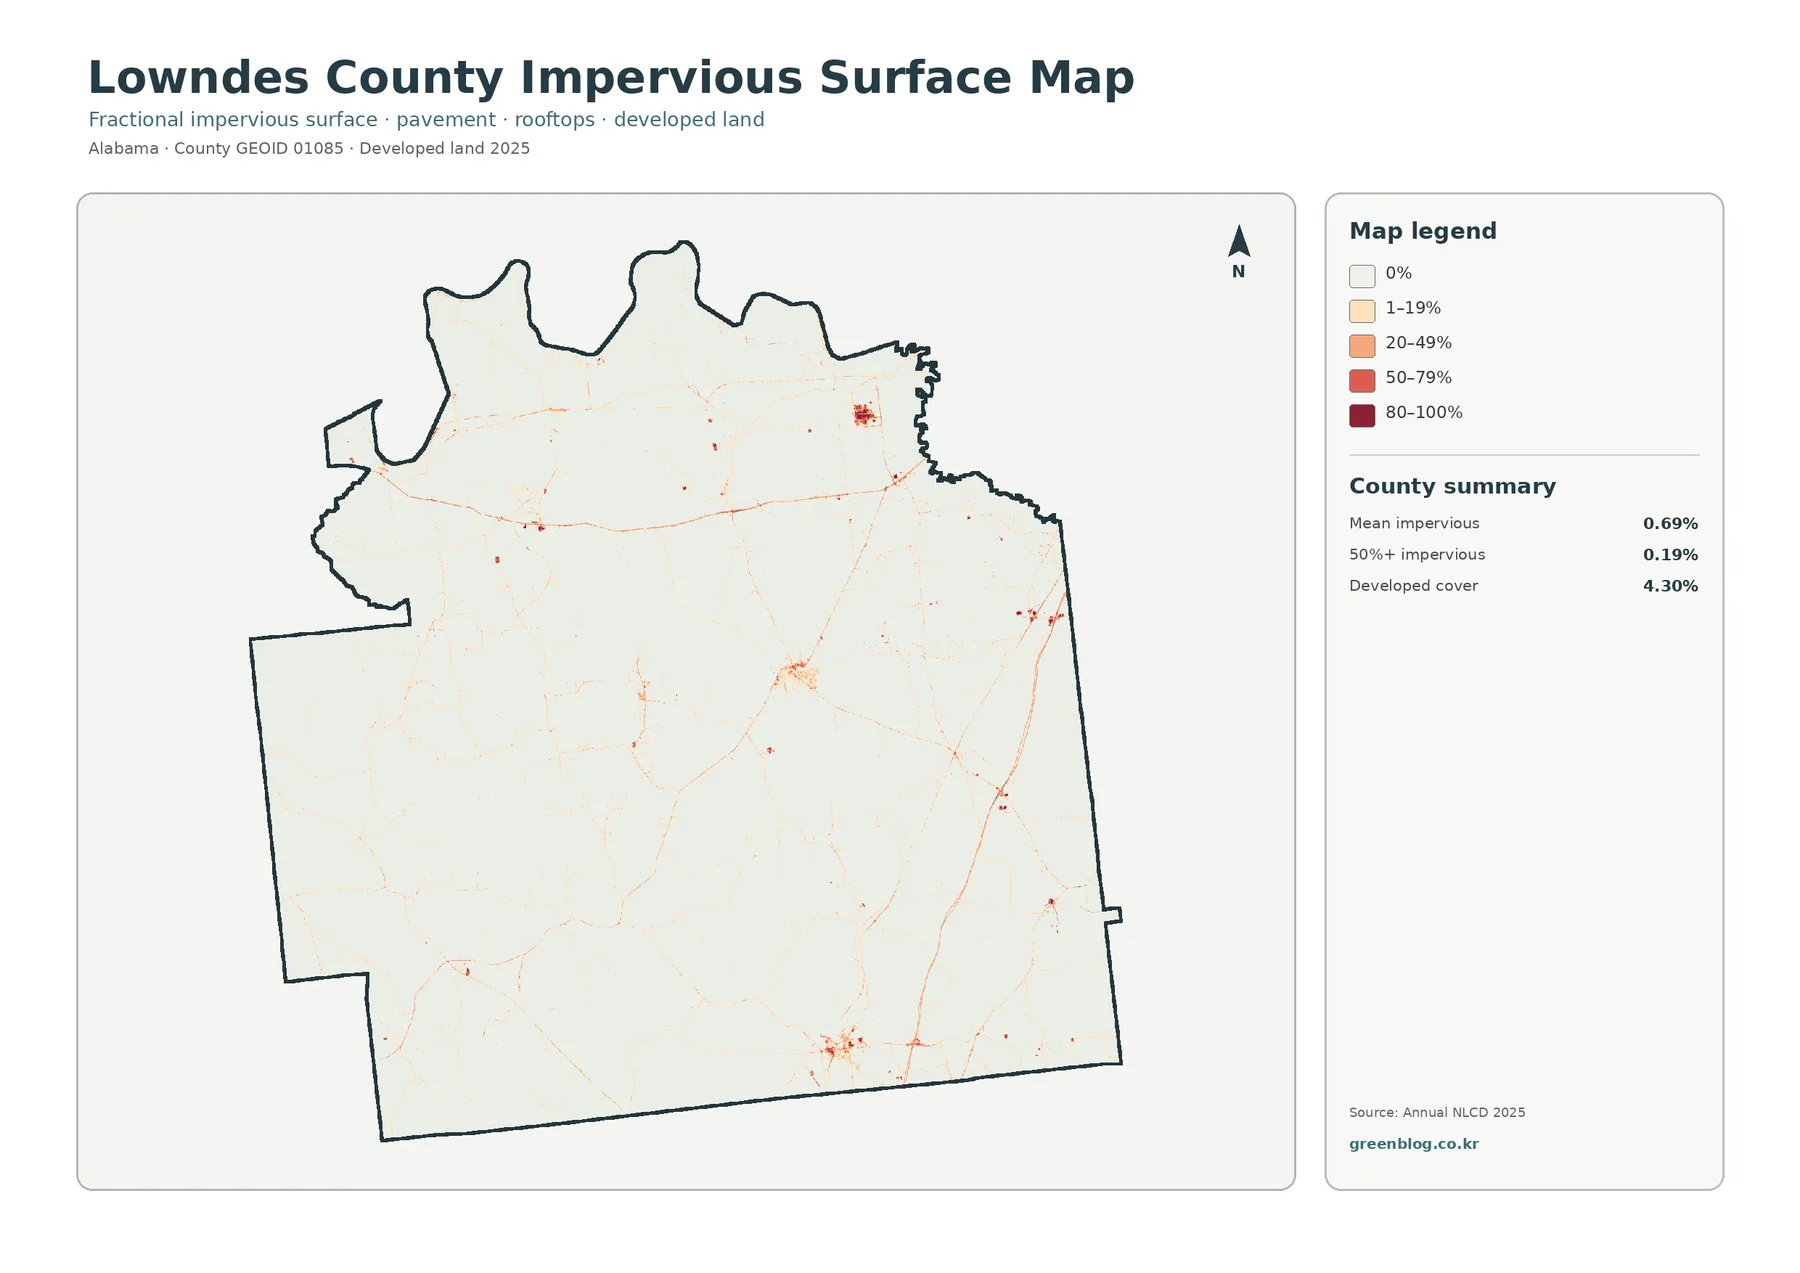
Most of the county appears very light on this view. Stronger colors are concentrated in a few small settlements or built clusters and along narrow linear features. The clusters are separated by broad low-impervious areas rather than merging into one continuous built zone. Because the image does not label towns or roads, it is safer to describe the pattern by location and shape than to assign each red cluster to a named community.
This view is useful for explaining why developed land and impervious surface answer different questions. Developed cover asks whether a cell belongs to a developed class; impervious data estimates how much of that cell is covered by hard surfaces. The distinction is especially clear in a rural county where small built areas sit within much larger forest, farm, and wetland landscapes. Engineering questions about runoff or drainage still require rainfall, soils, elevation, and infrastructure data in addition to this generalized surface product.
What the 1985–2025 class differences do—and do not—mean
The long-term comparison marks cells whose 1985 and 2025 classes differ. Lowndes County has a total class-difference value of 30.63 percent, but that number is not the same as development over forty years. The summary separately identifies 0.96 percent as classified to developed, 6.39 percent as forest loss, 6.15 percent as agricultural loss, and 16.63 percent as other class difference. Wetland difference also has its own legend category.
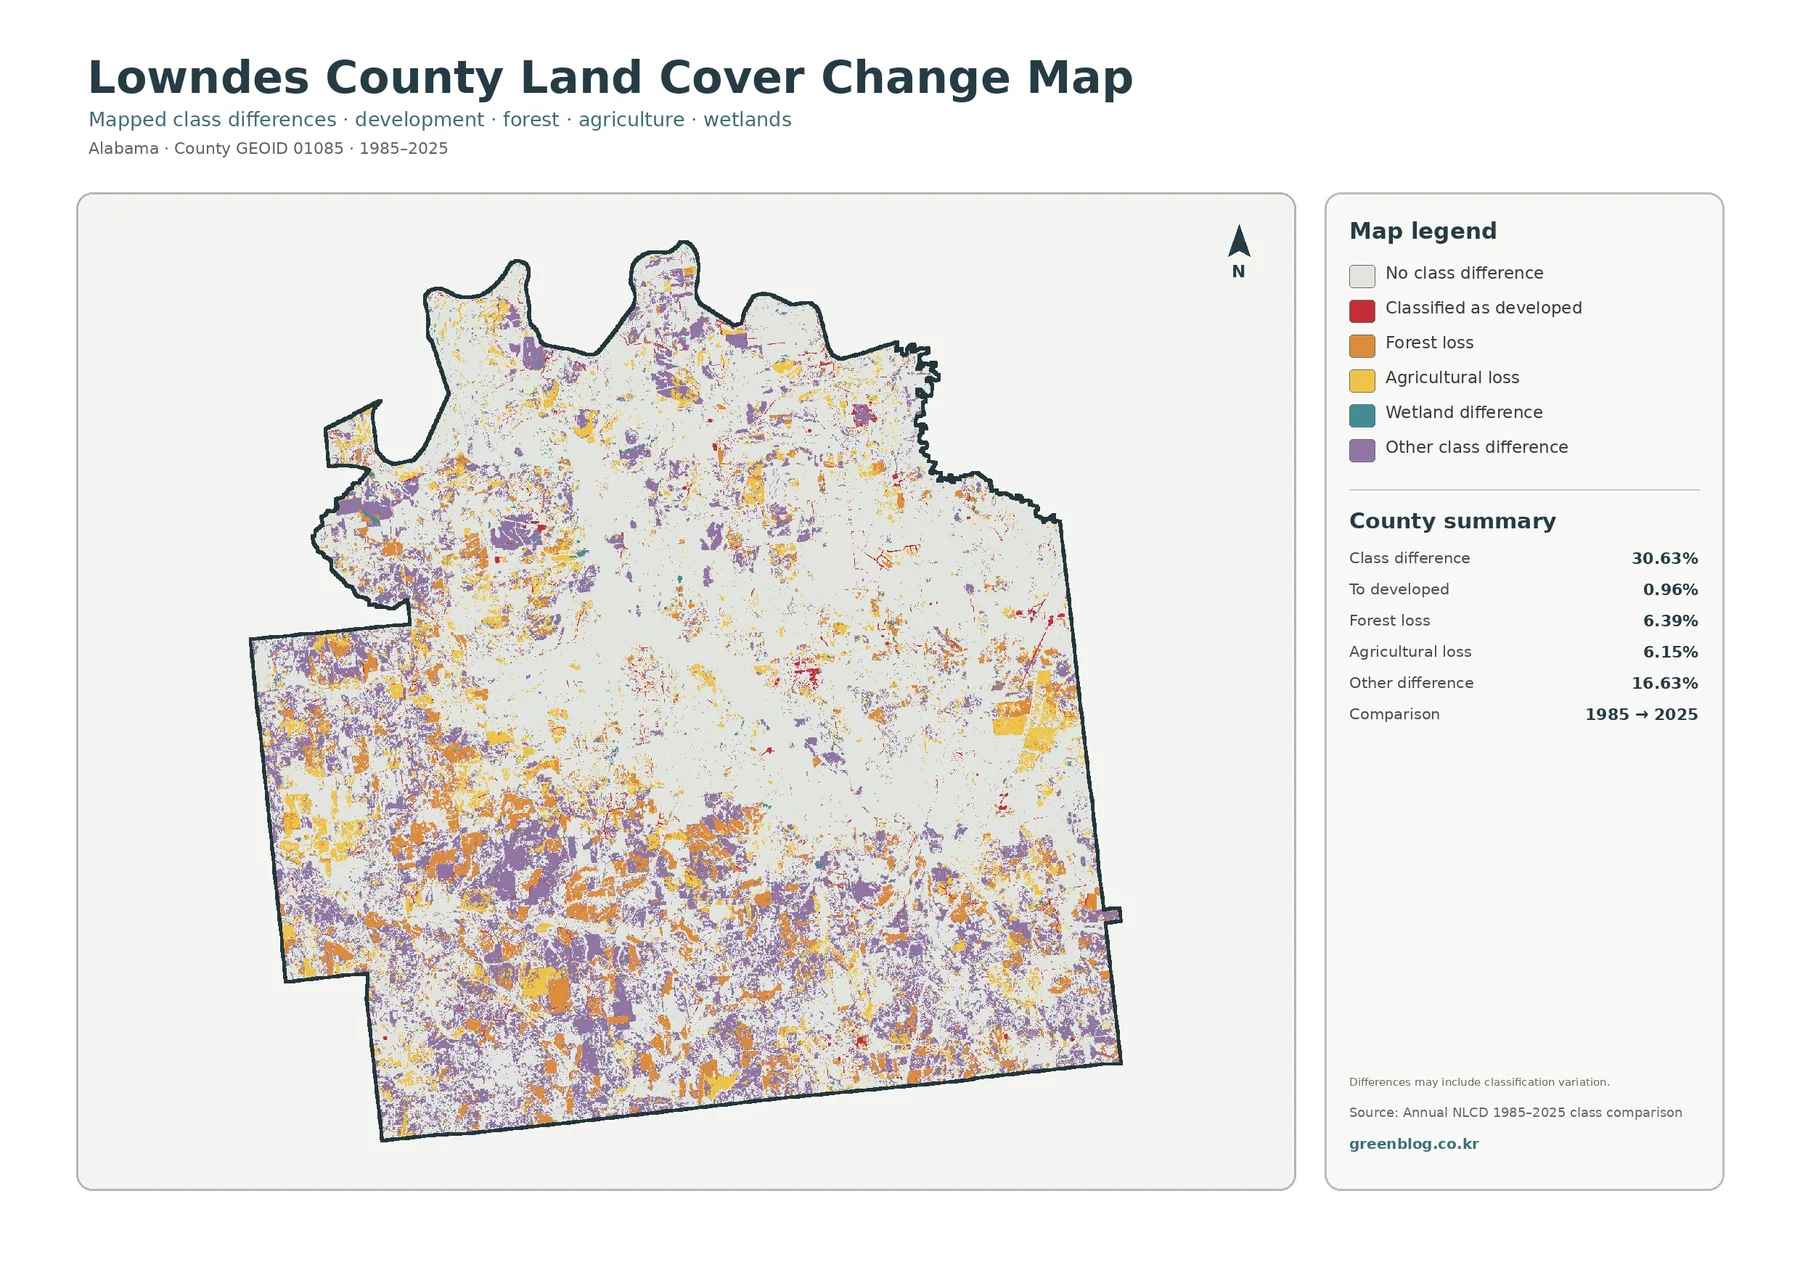
Colored cells are spread across much of the county rather than forming a single advancing front. Orange and yellow loss classes mix with purple “other difference,” especially across parts of the south and west, while differences also appear in northern areas. The pattern is too varied to summarize as one simple story such as urban growth replacing the rural landscape. Development is only one of several change categories, and its 0.96 percent value is far smaller than the total class-difference figure.
Raster classification adds another caution. A 30-meter cell can include a field edge, young forest, a narrow road, and other surfaces at the same time. The representative class can change between years because the dominant cover changed, but sensor conditions, classification methods, vegetation state, and mixed pixels can also influence the result. A colored change cell is therefore a useful place to investigate, not proof of a specific land-use event or its date.
The forest-loss and agricultural-loss percentages also should not be read as net countywide declines. They describe cells that belonged to those classes in one endpoint and another class in the other endpoint. The two-date product does not show every transition that occurred between 1985 and 2025, nor does it show whether a location changed and later returned to a similar class. Intermediate-year imagery and local records are needed for a true sequence of events.
Choosing the right view for a project
For a quick county overview, start with the general 2025 distribution because it places forest, agriculture, wetlands, development, and water in one frame. Use the rural-cover view when the main question is how forest and farm cover share the county. The impervious product is better when the subject is built surfaces, and the 1985–2025 comparison should be reserved for questions about long-term class differences. Keeping those purposes separate prevents one image from being asked to answer a question it was not designed for.
- County overview: compare the 41.22% forest, 31.21% agriculture, 15.07% wetlands, developed cover, and water in one frame.
- Rural landscape: examine where large southern forest blocks give way to farm cover and smaller grass or shrub classes.
- Wetland study: compare wetland patches with nearby forest and agriculture without treating the classification as a regulatory boundary.
- Built surfaces: use the 0.69% mean impervious layer to locate concentrated hard surfaces instead of relying only on the developed class.
- Long-term screening: use the 30.63% class-difference layer to identify places for deeper review, then consult intermediate-year imagery or records.
The four JPGs also work well as a coordinated presentation set because the county outline and overall framing remain consistent. A teacher can begin with the full distribution, then switch to the rural or impervious view without forcing students to reorient to a new boundary. A report can use one image for the main finding and place the others in an appendix. When the legend is important, keep it visible rather than cropping it away for a cleaner-looking slide.
County-to-county comparisons are most useful when the reference year and metric match. Comparing Lowndes County’s 2025 values with an older dataset from another county can mix time differences with real geographic differences. Percentages should also be paired with spatial form: two counties can have the same developed share while one has a single concentrated town and the other has several separated clusters. The same principle applies to wetlands, forest, and agricultural cover.
Reading the classification at the right scale
Land cover describes what is physically covering the surface, such as forest, crops, wetlands, water, or built material. Land use describes how people use land for purposes such as housing, commerce, industry, farming, or conservation. The two ideas overlap but are not interchangeable. A developed pixel does not establish zoning, and an agricultural pixel does not establish a legal agricultural designation or the boundaries of a particular farm.
Annual NLCD is a raster product, which means the landscape is represented as a grid of cells. At county scale this is efficient for comparing broad patterns, but small parcels, narrow streams, forest edges, and individual roads can be generalized. A mixed pixel may contain several kinds of surface even though only one class is displayed. Zooming farther into the JPG makes the pixels larger on screen; it does not create parcel-level detail that was not present in the source classification.
The 2025 layer is also a snapshot tied to its observation period. New construction, timber harvest, regrowth, farm changes, or restoration after that period may not appear. For a current property, permitting, or engineering decision, use the latest aerial imagery and the appropriate county, state, or federal records. The four images here are designed for regional understanding, education, reference, and preliminary comparison rather than legal or site-specific determination.
Colors can shift slightly between screens and printers, so the legend should remain part of the image whenever classes are being discussed. Forest and wetlands may both look greenish at a glance, and small grass or shrub areas can be hard to distinguish at reduced size. The original JPG files are better than a screenshot when labels and legends need to remain readable, but the underlying classification limits still apply at any display size.
Download the four original JPG files
The ZIP below contains the four original JPG files that correspond to the WebP previews in the article: general land cover, forest and farmland, impervious surface and developed land, and the 1985–2025 comparison. Each JPG is 2480×1754 pixels. Downloading the set makes it easy to choose one image for a report or to keep all four together for side-by-side reference.
Frequently Asked Questions
What is the largest land-cover class in Lowndes County?
Forest is the largest 2025 class at 41.22 percent. Agriculture follows at 31.21 percent and wetlands at 15.07 percent. Forest is especially prominent across the south and west, while farm cover and wetlands are more mixed through central, northern, and eastern areas.
Why is developed cover 4.30% while mean impervious cover is only 0.69%?
A developed class can include lawns, trees, soil, and other permeable surfaces around buildings and roads. Impervious data focuses on hard surfaces such as pavement and rooftops, so its countywide average can be much lower than the percentage assigned to developed land-cover classes.
Does the 30.63% class difference mean 30.63% of the county was developed?
No. Only 0.96 percent is summarized as classified to developed. The total also includes 6.39 percent forest loss, 6.15 percent agricultural loss, 16.63 percent other class difference, and a separate wetland-difference category in the legend.
What files are included in the ZIP?
The ZIP contains four 2480×1754-pixel JPGs: general land cover, forest and farmland, impervious surface and developed land, and the 1985–2025 class comparison. The article uses lighter WebP previews of the same four subjects.
Map File Information
Lowndes County land cover – four JPG files
- Included Files: Use only the versions confirmed in the article and supplied images
- File Type: Use the confirmed download contents
- Intended Use: Printing, education, presentations, and map-based projects
Related Maps
- Autauga County Alabama Land Cover Map
- Baldwin County Alabama Land Cover Map
- Barbour County Alabama Land Cover Map
Data and reference sources
The percentages and 1985–2025 values in this article come from the supplied Annual NLCD graphics. MRLC and USGS provide the broader land-cover data and classification references, while Census TIGER/Line resources provide authoritative boundary data. Alabama Cooperative Extension’s Lowndes County pages provide county-specific agriculture, forestry, wildlife, and education context without being used to assign any individual land-cover cell.
- MRLC Annual NLCD Data
- USGS Annual NLCD Land Cover Classification
- U.S. Census Bureau TIGER/Line Shapefiles
- Alabama Cooperative Extension System – Lowndes County Annual Report
- Alabama Cooperative Extension System – Lowndes County Extension Office
Green Map creates custom-edited map images using open geographic data sources such as geoBoundaries, Natural Earth, OpenStreetMap, and government open data.
These maps are edited visual materials, not raw data files, and are provided for education, documents, presentations, and graphic reference.