Escambia County Alabama Land Cover Map presents a 2025 view of ground cover in the southern Alabama county along the Florida state line. Forest is the largest mapped class at 46.75%, followed by wetlands at 20.60%, agriculture at 13.76%, developed land at 7.21%, and grassland at 6.24%. The county is not visually uniform: broad farmed areas and developed clusters stand out in the west, while larger connected forest blocks and wetland corridors become more prominent toward the east.
This page includes four matching views: general land cover, forest and farmland, fractional impervious surface, and mapped class differences from 1985 to 2025. The browser WebP images are 1800 × 1273 pixels, and the four supplied 2480 × 1754 JPG originals are available together in one download. Keeping the county outline consistent makes it easier to compare current cover, rural land patterns, built surfaces, and long-term classification differences without changing geographic reference.
Table of Contents
A forest-and-wetland mosaic defines most of the 2025 county view
The 2025 summary starts with forest at 46.75%. Wetlands add another 20.60%, while agriculture accounts for 13.76%, developed land 7.21%, and grassland 6.24%. Those percentages are useful, but the map explains why they should not be treated as evenly spread shares. Forest forms large connected areas through much of the eastern half and remains common elsewhere, wetlands cut through the county in branching and irregular bands, and agricultural cover forms broader patches in the west.
Developed land appears differently from the natural classes. Instead of filling one continuous urban zone, red areas form several clusters and thin connecting traces. The U.S. Census Bureau’s 2020 geographic reference map places Atmore in the western part of the county and Brewton and East Brewton farther east. The strongest developed concentrations on the land-cover image occur in broadly compatible locations, which gives readers a practical geographic reference. The thematic image does not draw municipal boundaries, however, so a red pixel should not be assigned to a particular city merely from this map.
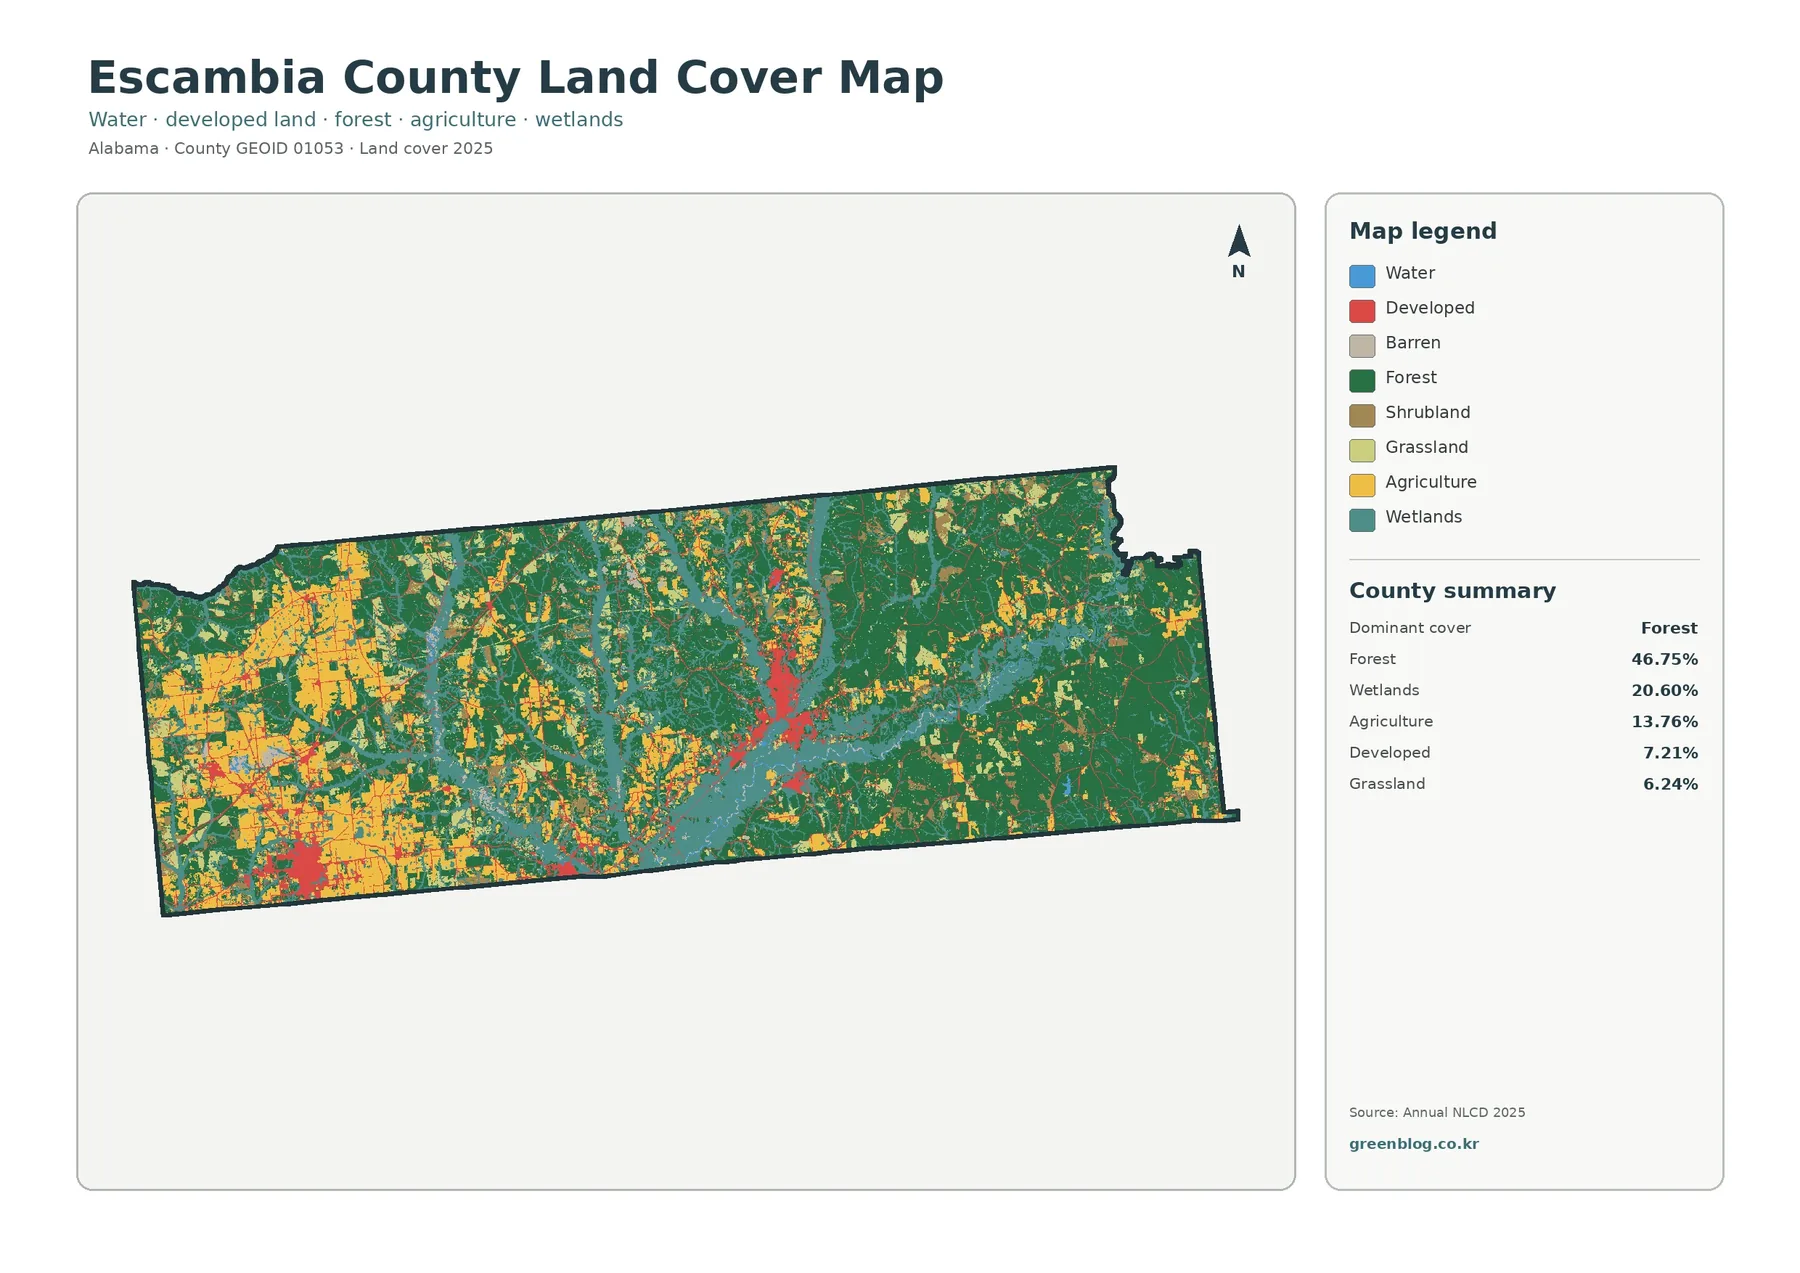
The legend also includes water, barren land, shrubland, and other open-cover classes. Not every legend color needs equal emphasis. The useful reading strategy is to start with classes that are both large in the summary and clearly visible on the map, then use smaller classes to understand transitions. In Escambia County, the important first contrast is between the broad forest base, the unusually extensive wetland pattern, the western agricultural areas, and the concentrated rather than countywide developed footprint.
Atmore and Brewton provide useful anchors for reading the west-to-east contrast
Atmore and Brewton help turn an abstract county outline into recognizable local geography. Census reference mapping places Atmore toward the western side, while Brewton and East Brewton lie farther east. On the general land-cover map, the western side contains some of the largest agricultural blocks and a strong developed cluster, while the area around Brewton sits amid a more complicated mixture of developed cover, forest, wetlands, and water-related features. The comparison is useful because it shows that two population centers can occupy different surrounding land-cover settings within the same county.
The Conecuh River adds another reference in the eastern half of the county. The Census geographic map labels the river near Brewton, and trusted Alabama geographic descriptions identify it as a major waterway through this part of Escambia County. The land-cover image shows broad wetland colors around the same general eastern landscape. That relationship helps explain where to look, but it does not justify naming every teal raster cell as part of the Conecuh River floodplain or treating the land-cover class as a regulatory wetland boundary.
The large forest blocks near the eastern and southern edges also have a documented regional context. The USDA Forest Service states that Conecuh National Forest extends through Covington and Escambia counties and reaches the Alabama–Florida line. The map’s green cover is therefore consistent with a heavily forested regional setting. Ownership is a separate question, though: the land-cover map classifies surface cover, not public land, so the presence of the national forest does not mean every green cell belongs to the Forest Service.
The rural map separates cropland, pasture, woodland, wetlands, and open cover
The forest-and-farmland version is more useful when the question is about the rural landscape rather than all land-cover classes at once. Its county summary lists forest at 46.75%, agriculture at 13.76%, wetlands at 20.60%, grassland at 6.24%, shrubland at 4.32%, and water at 0.45%. Cropland and pasture or hay are displayed separately on the map, while the summary combines them into agriculture. That distinction allows a reader to see that the western agricultural landscape is not one uniform type of open land.
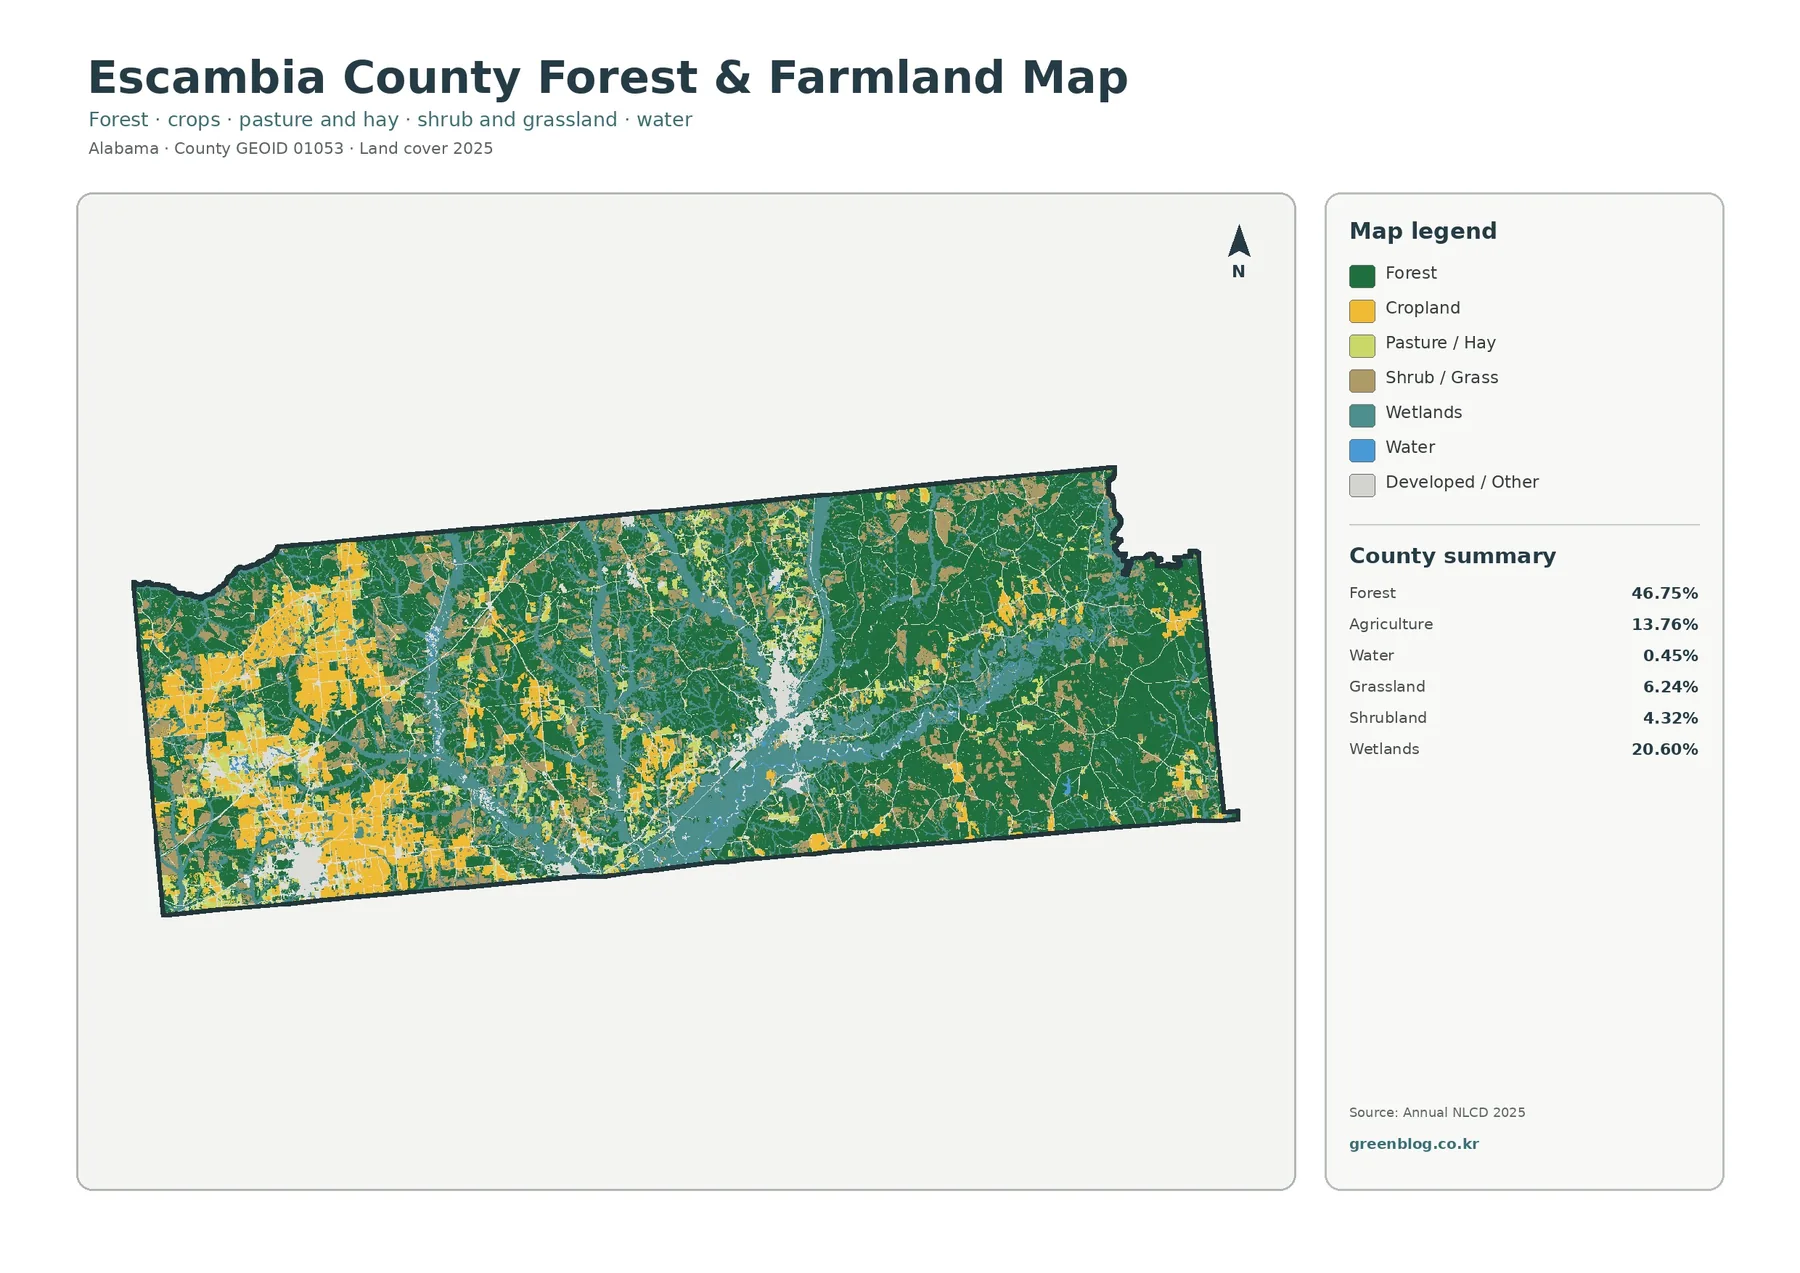
Broad yellow cropland patches and lighter pasture or hay areas are especially visible across the western half. They are broken by forest strips, developed areas, and wetland features rather than forming an uninterrupted agricultural plain. Moving east, dark green forest becomes more continuous, but teal wetlands repeatedly interrupt it. The center of the county contains a more mixed texture, making it a useful transition zone for comparing how forest, farming, wet ground, and settlement overlap at the map’s 30-meter classification scale.
Agricultural cover should not be confused with legal agricultural use. A raster cell classified as cropland or pasture describes what the surface was interpreted to resemble in the dataset; it does not identify the owner, crop, parcel boundary, tax status, zoning, or future development right. The same caution applies to forest. Green cells do not tell whether woodland is public or private, protected or managed for timber. The map is a regional surface-cover reference, not a property record.
The 20.60% wetland share matters more than the small open-water percentage suggests
The forest-and-farmland summary reports only 0.45% as water but 20.60% as wetlands. Those values answer different questions. Blue water cells represent open water, while wetland classes cover vegetated or saturated ground that may extend well beyond a visible river channel. On the map, teal wetland areas form long irregular corridors and broad patches, especially through central and eastern parts of the county. A reader looking only at the water percentage would miss a major part of Escambia County’s mapped surface environment.
This contrast is useful in environmental education because it demonstrates why water and wetland are not interchangeable labels. It can also help narrow locations for further study of drainage, riparian habitat, or low-lying ground. It cannot replace a wetland delineation. Jurisdictional wetlands and permitting decisions use specific legal and field criteria, while Annual NLCD is designed for consistent regional land-cover classification. A teal pixel is therefore a landscape clue, not a permit determination.
Impervious surface narrows the developed footprint to a few harder-built clusters
Impervious surface means pavement, rooftops, parking areas, and other hard surfaces that limit direct infiltration of rainfall. Escambia County’s mean imperviousness is 1.39%, and only 0.46% of the county is mapped at 50% or greater imperviousness. Developed cover in the general 2025 map is 7.21%, so the two values are not expected to match. A developed cell can include substantial lawn, trees, bare soil, or other permeable surfaces, particularly in low-density residential areas.
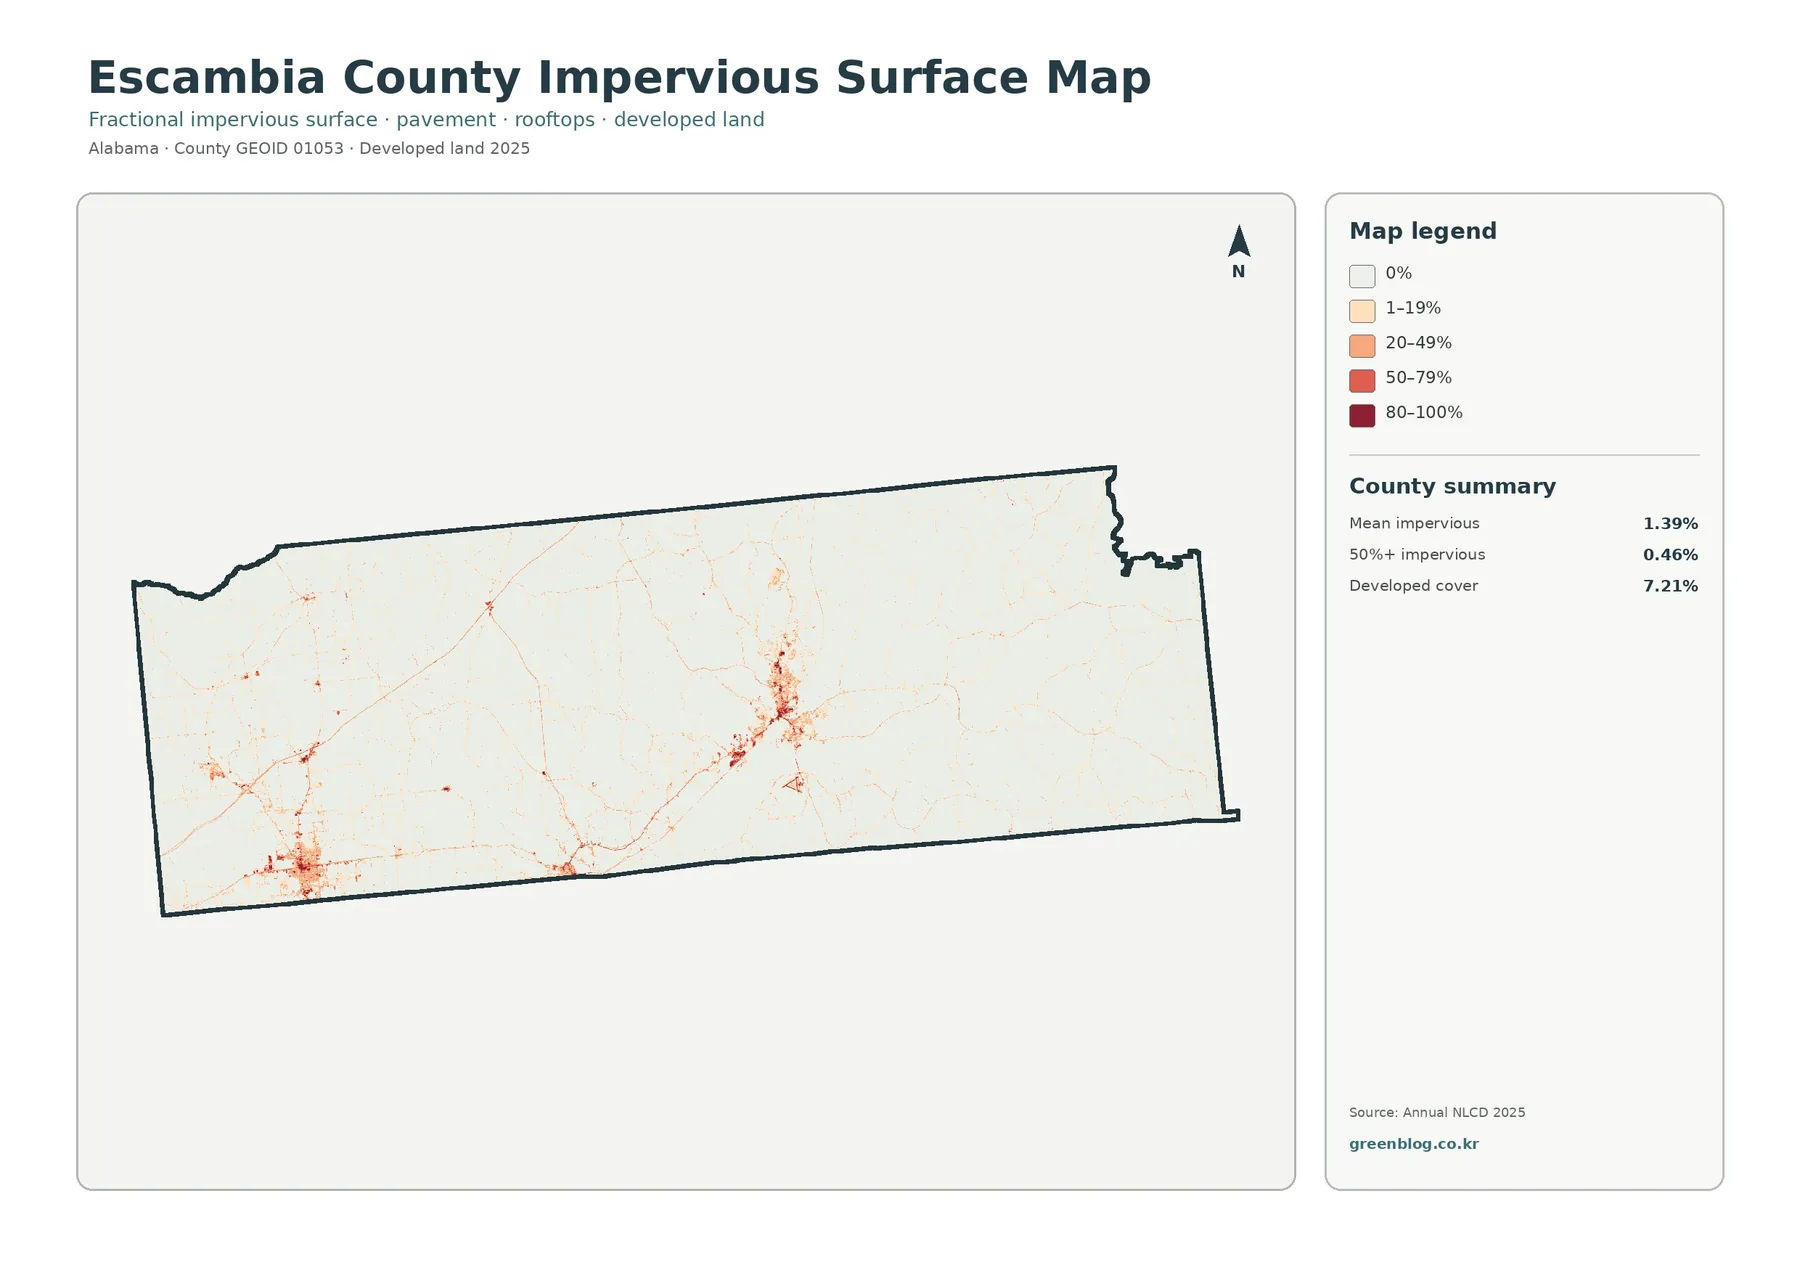
Most of the county remains very pale on this map, which is consistent with the large forest, wetland, and agricultural shares. Darker orange and red cells concentrate most strongly in two broad areas that correspond approximately to the Atmore and Brewton settlement zones on Census reference mapping. Smaller lines and points extend away from those clusters. Because the thematic image does not label roads, those narrow traces should be described as linear built features rather than assigned to a specific highway without another map.
The impervious view is helpful when the general developed class is too broad for the question being asked. For a classroom discussion, it shows how an area can be categorized as developed while retaining a low hard-surface fraction. For a regional planning illustration, it can separate concentrated built surfaces from surrounding low-density cover. It is not a stormwater model: drainage design would also require elevation, soils, culverts, channels, rainfall, and much finer information about actual paved and roofed surfaces.
The 1985–2025 image identifies mapped class differences rather than a complete land-use history
The change product compares the mapped classes at two endpoint years, 1985 and 2025. Its county summary reports a class difference across 26.25% of the area. Within that summary, 1.81% is shown as classified to developed, 10.50% as forest loss, 2.24% as agricultural loss, and 10.44% as other class difference. The legend also includes a wetland-difference category, but the summary does not provide a separate percentage for it, so an exact wetland-change figure should not be invented from the image.
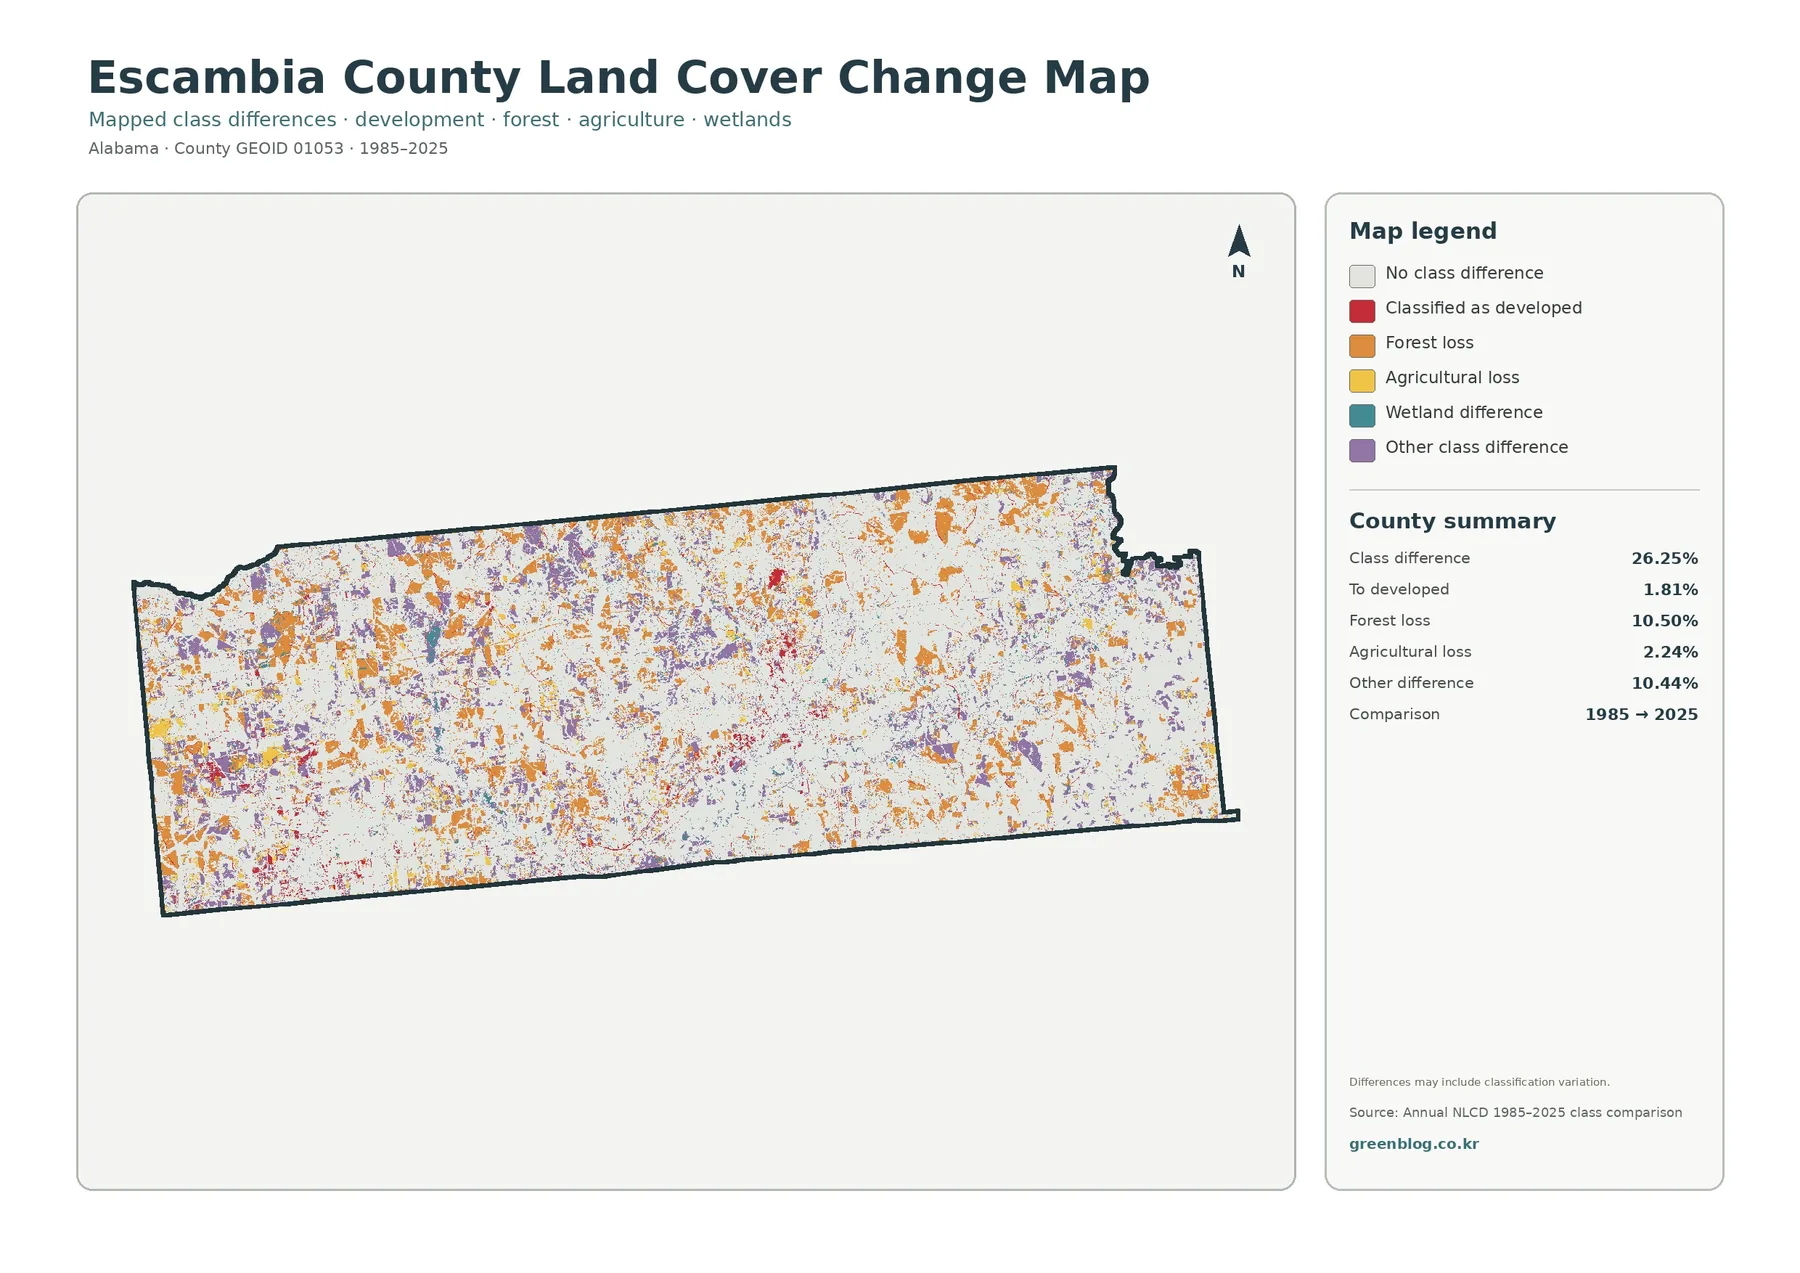
Colored cells are scattered across the county rather than confined to one location. Forest-loss colors appear in western, central, and eastern areas, while the to-developed category is more concentrated near some present-day settlement patterns. That visual overlap is worth investigating, but it does not prove cause. A road, subdivision, timber operation, storm, farming decision, or other event should not be named as the reason for a class difference unless additional records support that conclusion.
The map itself notes that classification variation can be included. Differences in imagery, mixed pixels, vegetation condition, class boundaries, and other mapping factors can change the assigned class even when the real-world story is more complicated than a simple conversion. For historical work, use this product to identify candidate areas, then review intermediate Annual NLCD years, aerial photographs, local planning documents, land records, or field evidence. Two endpoints cannot reveal exactly when a change occurred or whether a site changed more than once.
A four-step comparison keeps current cover, hard surfaces, and change from being mixed together
Start with the general 2025 map to identify the county’s broad pattern. Then move to the forest-and-farmland view to separate cropland, pasture, forest, wetland, and open-cover classes. Use the impervious image third to isolate the harder-built portion of developed areas. Finish with the 1985–2025 difference map only after the current pattern is clear. This order helps prevent a common mistake: treating a current class as if it automatically represented a recent change.
For example, a developed area in 2025 may show no change color if it was already mapped as developed in 1985. Conversely, a forested cell in 2025 can sit within an area that had a different class at the earlier endpoint. The same logic applies to western agriculture. A user can locate cropland and pasture in the 2025 rural map and then check nearby agricultural-loss colors, but the change image alone cannot state whether a field became forest, development, wetland, or another category without checking the actual class sequence.
The eastern forest and wetland landscape deserves the same restraint. USDA documentation confirms a Conecuh National Forest presence in Escambia County, but the change map does not carry land-ownership boundaries. A forest-loss color should therefore not be described as a change on Forest Service land unless ownership is verified independently. Separating surface classification from property and management data keeps the maps useful without making claims they were not designed to support.
Use the set for teaching, regional comparison, reports, and visual reference
Escambia County works well as a teaching example because several major cover types are easy to compare. Students can test whether a 46.75% forest share looks uniform on the ground, trace the broader 20.60% wetland pattern, and compare western agricultural blocks with eastern forest. They can also contrast developed cover at 7.21% with mean imperviousness at 1.39% to learn why land-cover categories and fractional hard-surface measurements are related but not identical.
For reports and presentations, the matching outlines make a logical visual sequence. The first map establishes the overall landscape, the rural map breaks out forest and farm classes, the impervious view focuses attention on built surfaces, and the final image adds a long-term comparison. The files can support regional context, environmental education, or county-to-county comparison when the same Annual NLCD year and legend are used. They should not be presented as parcel surveys, engineering drawings, zoning maps, or proof of legal wetland status.
The WebP previews in the article measure 1800 × 1273 pixels. The ZIP contains the four supplied original JPGs at 2480 × 1754 pixels each. The asset manifest marks those dimensions as the original source resolution but does not mark them as meeting the package’s A3 high-resolution reference. For ordinary documents and slides, the original JPGs preserve more source detail than browser screenshots. For large-format printing, test labels and legend readability at the intended physical size instead of assuming a print resolution that the package does not claim.
Scale, classification, and legal-use limits still apply when the image is enlarged
Annual NLCD is a raster dataset, meaning the landscape is represented by grid cells rather than surveyed property polygons. At roughly 30-meter land-cover resolution, a narrow road, small building, stream edge, field margin, or forest boundary may be smaller than a cell or mixed with another surface inside one cell. Enlarging the JPG makes the grid easier to see but does not create finer ground information. A crisp color boundary should not be treated as an exact surveyed line.
Land cover also differs from zoning, ownership, and permitted use. Agricultural cover does not prove agricultural zoning or identify a farm parcel. Developed cover does not establish a right to build. Forest cover does not tell whether land is public, protected, or managed for timber, and a mapped wetland class is not a regulatory wetland determination. Property, permitting, engineering, and legal questions require current authoritative records and, where necessary, field verification.
Time matters as well. The current maps summarize 2025 conditions, while the change product compares 1985 with 2025. Construction, timber harvest, vegetation regrowth, farm conversion, or wetland conditions after 2025 are outside these images. A study that depends on the latest condition should check newer data when available. A historical study should examine intermediate years instead of using the two endpoints as if they recorded a continuous timeline.
Frequently Asked Questions
What is the largest land-cover class in Escambia County?
Forest is the largest class in the supplied 2025 summary at 46.75%. Wetlands are 20.60%, agriculture 13.76%, developed land 7.21%, and grassland 6.24%. The map shows a strong east-west contrast: large forest and wetland areas are prominent toward the east, while western Escambia County contains broader agricultural patches and one of the main developed concentrations.
Why is developed cover 7.21% while mean imperviousness is only 1.39%?
Developed cover is a categorical land-cover label, while imperviousness estimates how much of a cell is covered by hard surfaces such as pavement and rooftops. Low-density development can contain large amounts of grass, trees, or exposed soil. A cell can therefore be mapped as developed without being mostly impervious. The 0.46% share at 50% or greater imperviousness identifies only the more intensely hard-surfaced portions.
Does the 20.60% wetland figure represent a legal wetland boundary?
No. It is the share of cells classified as wetland in the supplied land-cover product. The category is useful for regional comparison, but regulatory wetland status depends on separate criteria and field or agency determinations. Use the map to understand broad surface patterns or identify areas for closer study, not to make a permitting decision.
Does the 26.25% class-difference figure mean that all of that land changed use?
No. The figure measures cells whose mapped class differs between the 1985 and 2025 endpoints, and the map warns that classification variation may be included. It is a useful screening measure for locating areas worth investigating. Claims about actual land-use conversion, timing, or cause should be checked with intermediate annual data, aerial imagery, local records, or field evidence.
Map File Information
The ZIP contains four original JPG maps of Escambia County covering 2025 land cover, forest and farmland, impervious surface, and mapped class differences from 1985 to 2025.
- File Type: ZIP containing four JPG images
Related Maps
- Autauga County Alabama Land Cover Map
- Baldwin County Alabama Land Cover Map
- Barbour County Alabama Land Cover Map
Sources and Further Reading
- MRLC Annual NLCD Data — official access to Annual NLCD land-cover and related products.
- USGS Annual NLCD Land Cover Classification — definitions and background for the land-cover classes used by Annual NLCD.
- U.S. Census Bureau 2020 Alabama Geographic Areas Reference Maps — official geographic reference for Escambia County, Atmore, Brewton, East Brewton, and the Conecuh River.
- USDA Forest Service: Conecuh National Forest — official regional context for the national forest in Covington and Escambia counties along the Alabama–Florida line.
- Alabama Cooperative Extension System: Escambia County — county-specific Extension information for crop production, forestry, wildlife, and natural-resource assistance.
Green Map creates custom-edited map images using open geographic data sources such as geoBoundaries, Natural Earth, OpenStreetMap, and government open data.
These maps are edited visual materials, not raw data files, and are provided for education, documents, presentations, and graphic reference.