Industrial-sector kerosene prices were reported as positive values for all 50 states and the District of Columbia in 2024. In EIA’s State Energy Data System, Wisconsin had the highest value at $28.05 per million Btu, followed by Minnesota at $27.91, Illinois at $27.22, and Pennsylvania at $27.17. Alabama was lowest at $15.95. The unweighted 51-jurisdiction mean was about $22.94 and the median was $23.73, while EIA’s U.S. industrial kerosene price was $22.88/MMBtu.
The series should not be read as a straightforward retail price paid by every industrial facility. Historically, SEDS used kerosene prices for resale for the industrial sector. After EIA suspended survey EIA-782 following data year 2021, SEDS began estimating 2022-forward industrial prices with state regression equations based on historical state industrial prices and several national or regional petroleum price indicators. State general sales taxes are then added.
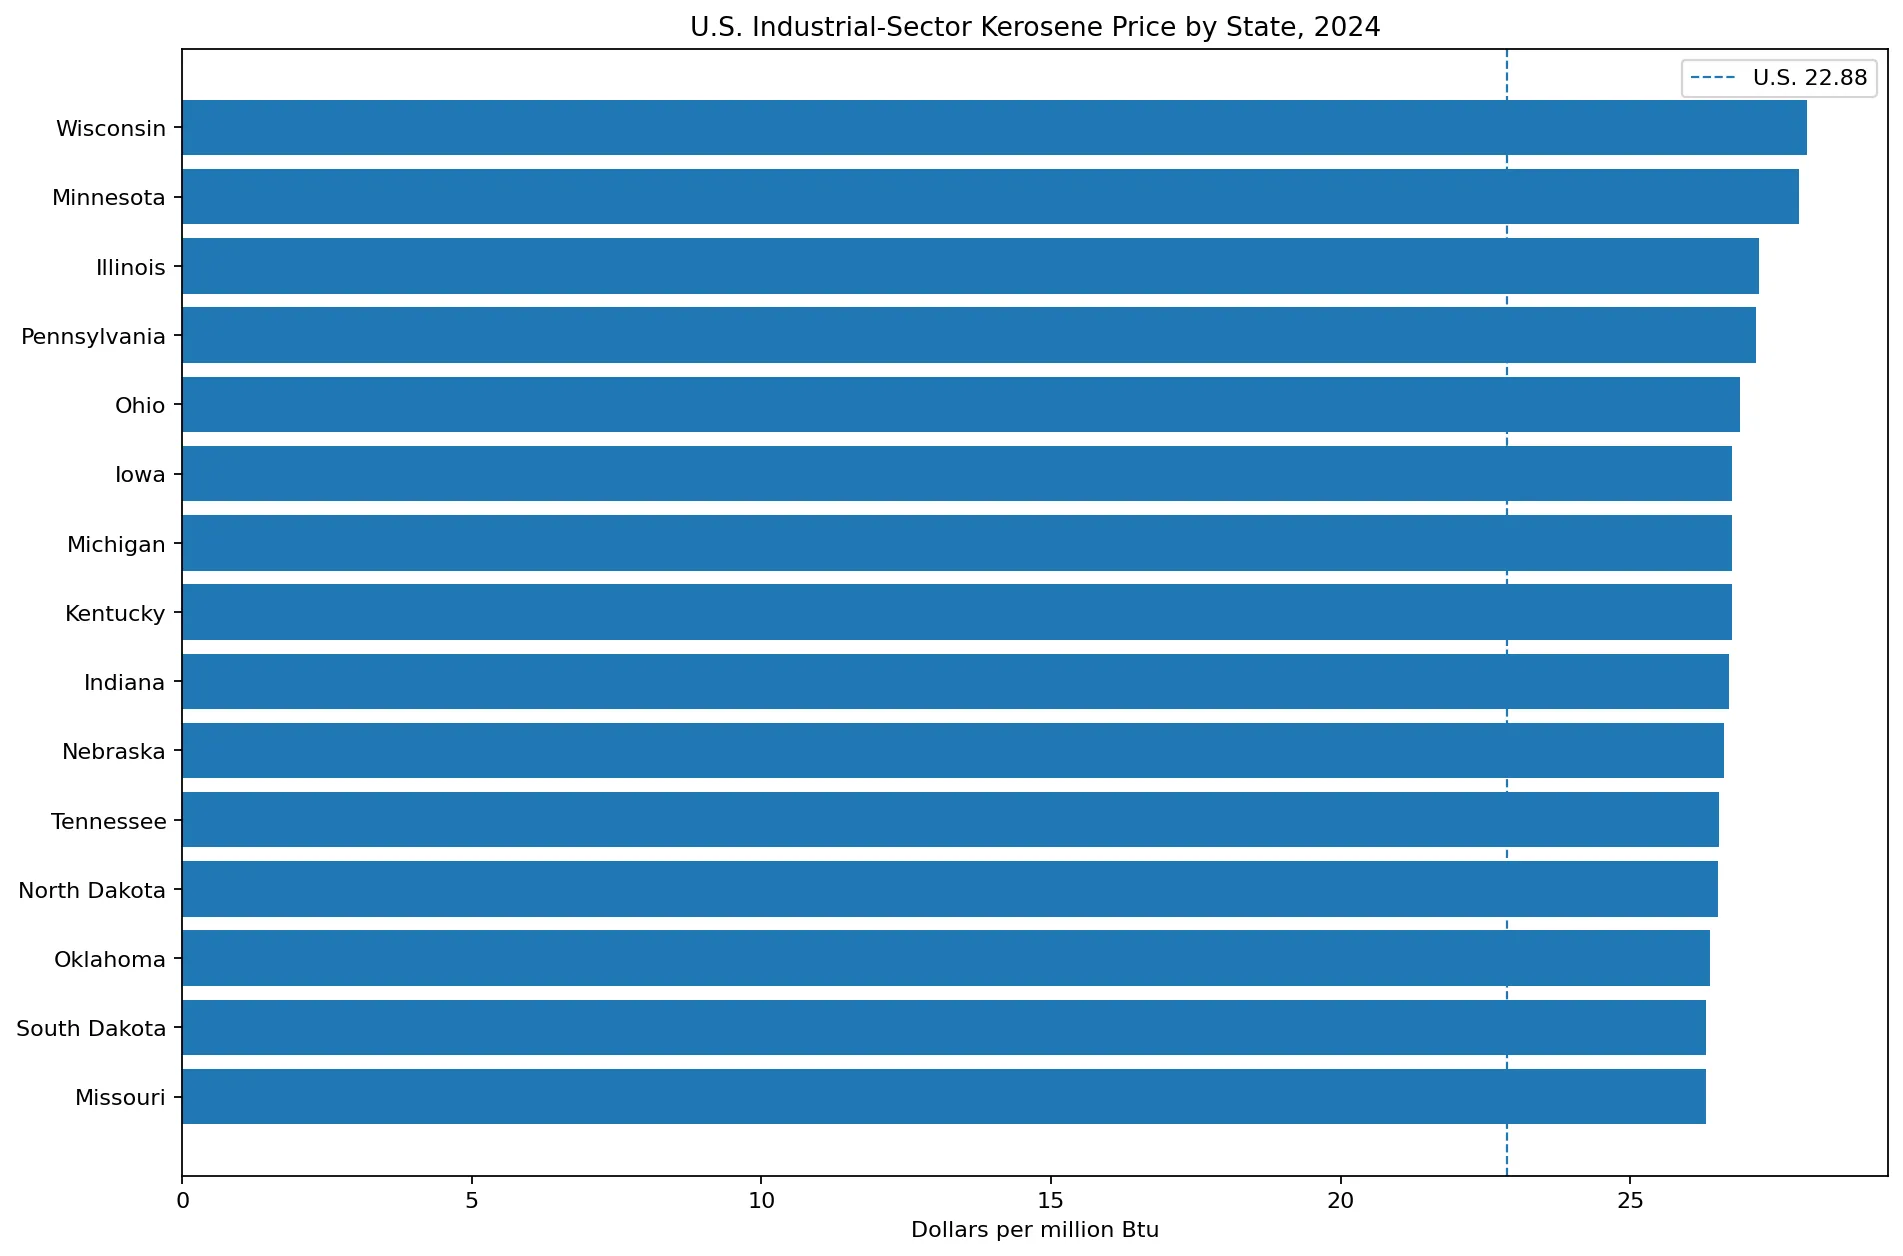
Table of Contents
What the industrial kerosene price measures
SEDS develops separate kerosene price series for residential, commercial, and industrial sectors. This dataset is the industrial series. Kerosene can be used for heating and other specialized purposes, but the SEDS value is not a universal invoice price observed for every industrial customer. It is part of a state energy accounting system designed to maintain consistent consumption, price, and expenditure estimates through time.
From 1983 through 2021, the industrial kerosene series was based primarily on prices of kerosene sold for resale. When a direct state price was not available, SEDS could assign a corresponding Petroleum Administration for Defense district or subdistrict price. That historical design is important because it explains why the industrial price should not be treated as identical to an end-user retail kerosene price.
Beginning in 2022, EIA no longer had the same physical-unit price input from survey EIA-782. SEDS therefore moved to state-specific regression equations. The resulting 2024 numbers are estimates within the SEDS methodology rather than a list of independent state market quotations. Broad geographic patterns are informative; tiny differences between adjacent ranks should not be overinterpreted.
Wisconsin and Minnesota are at the top
Wisconsin records $28.05/MMBtu and Minnesota $27.91. Illinois follows at $27.22, Pennsylvania at $27.17, Ohio at $26.89, and Iowa, Michigan, and Kentucky each at $26.76. Indiana is at $26.70 and Nebraska at $26.63. Many of the highest observations are in the Midwest and Great Lakes region.
That geographic pattern is descriptive, not a complete causal explanation. The 2024 series is regression-based and incorporates historical state relationships with broader petroleum price indicators. State sales taxes are also added. Supply logistics, demand, and local market conditions may matter in reality, but this one SEDS price series cannot isolate their individual effects.
Wisconsin is $5.17 above the U.S. industrial value and $12.10 above Alabama, the lowest state observation. The maximum is about 1.76 times the minimum. Those differences are meaningful at the price-series level, but they do not reveal total industrial kerosene spending because expenditure also depends on how much kerosene is consumed.
Alabama and several western and southern states are at the low end
Alabama is lowest at $15.95/MMBtu. Montana follows at $16.58, Colorado at $17.06, Wyoming at $17.24, Idaho at $17.57, Utah at $17.59, and Texas at $17.85. Mississippi, Louisiana, New Mexico, and Arkansas are also below $19.
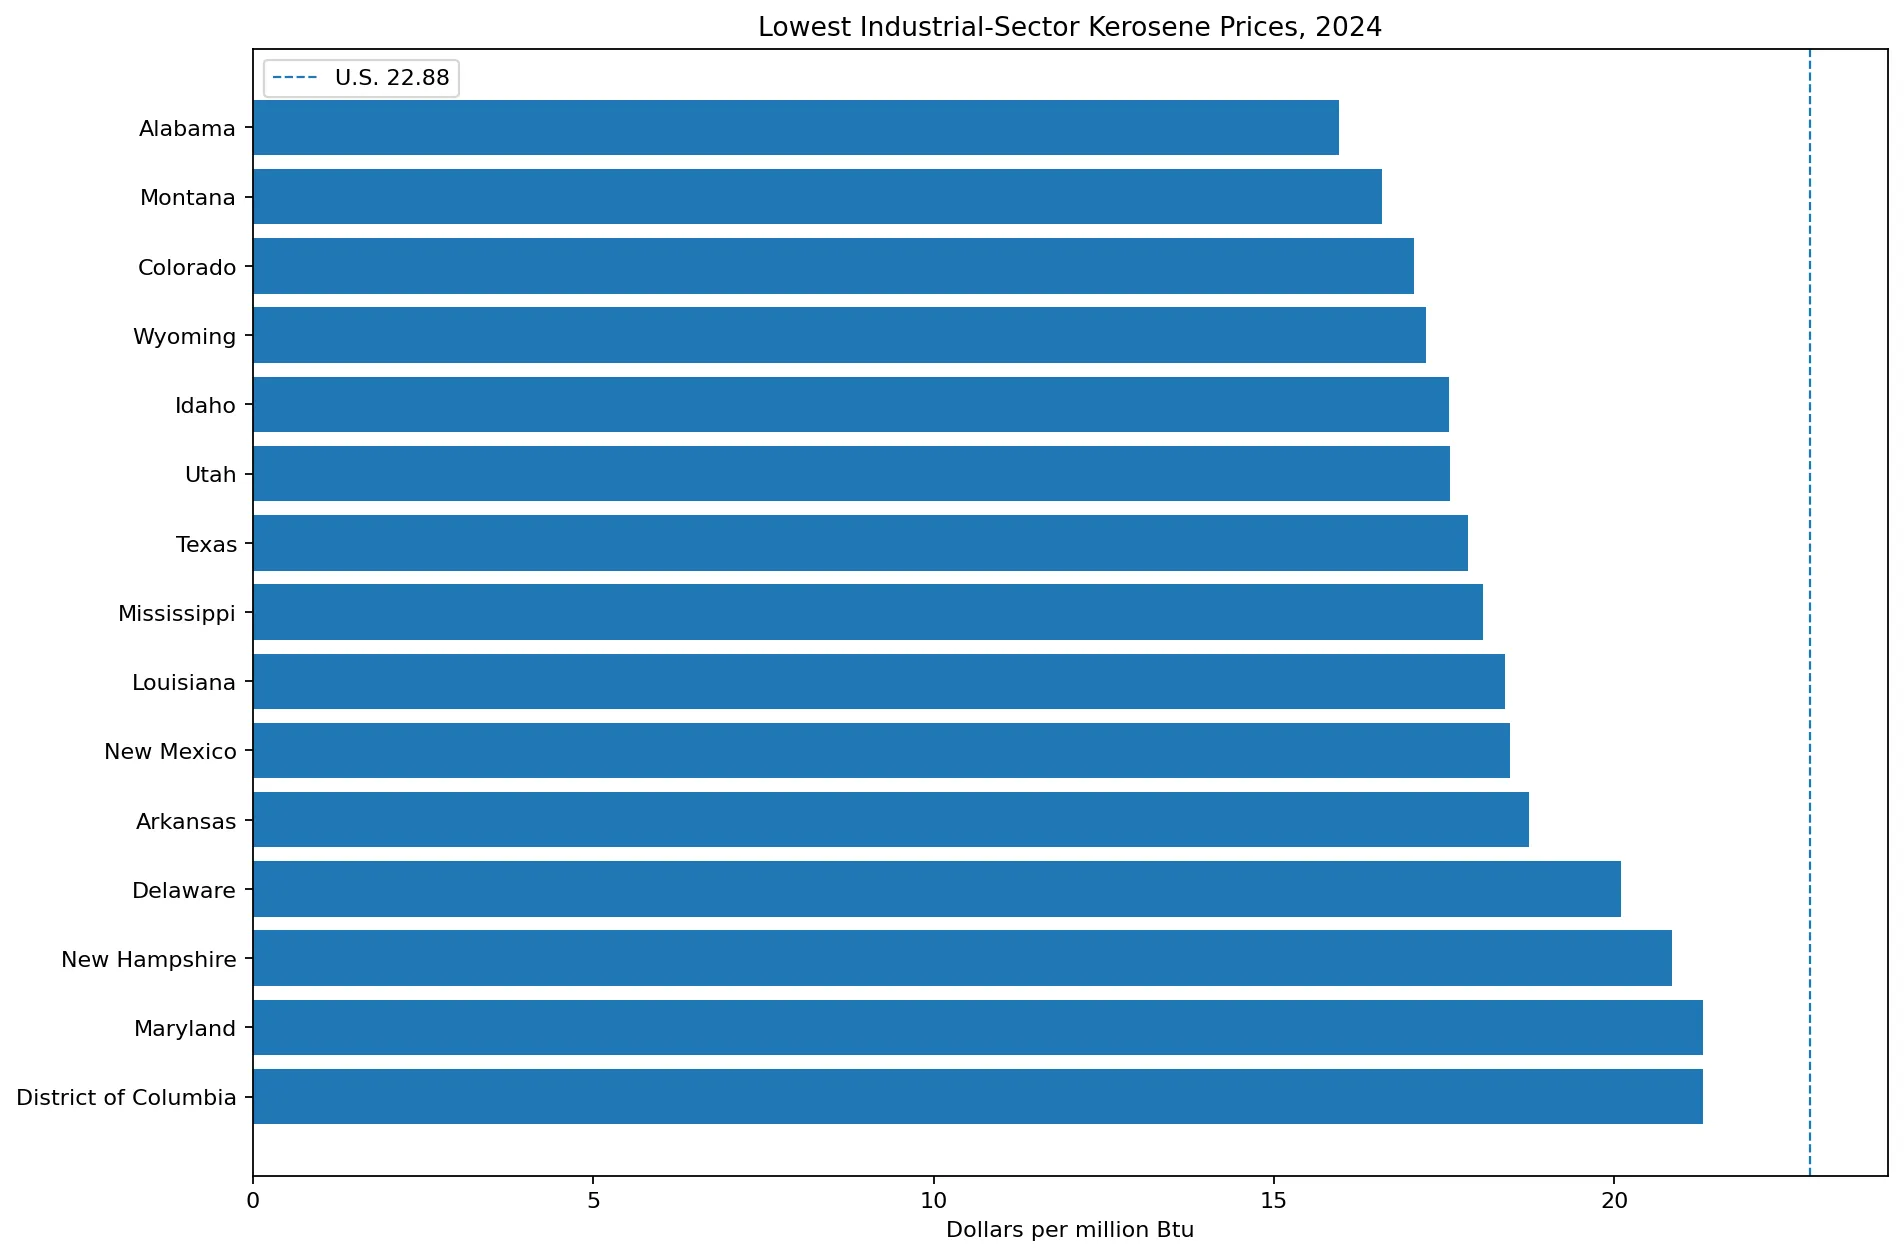
A low kerosene price should not be used as a broad industrial competitiveness ranking. Kerosene is only one energy product. Electricity, natural gas, coal, distillate fuel oil, hydrocarbon gas liquids, and other fuels may be much more important to a state’s industrial energy bill. The economic effect of a kerosene price difference also depends on the quantity consumed.
Why the median, state mean, and U.S. price are different
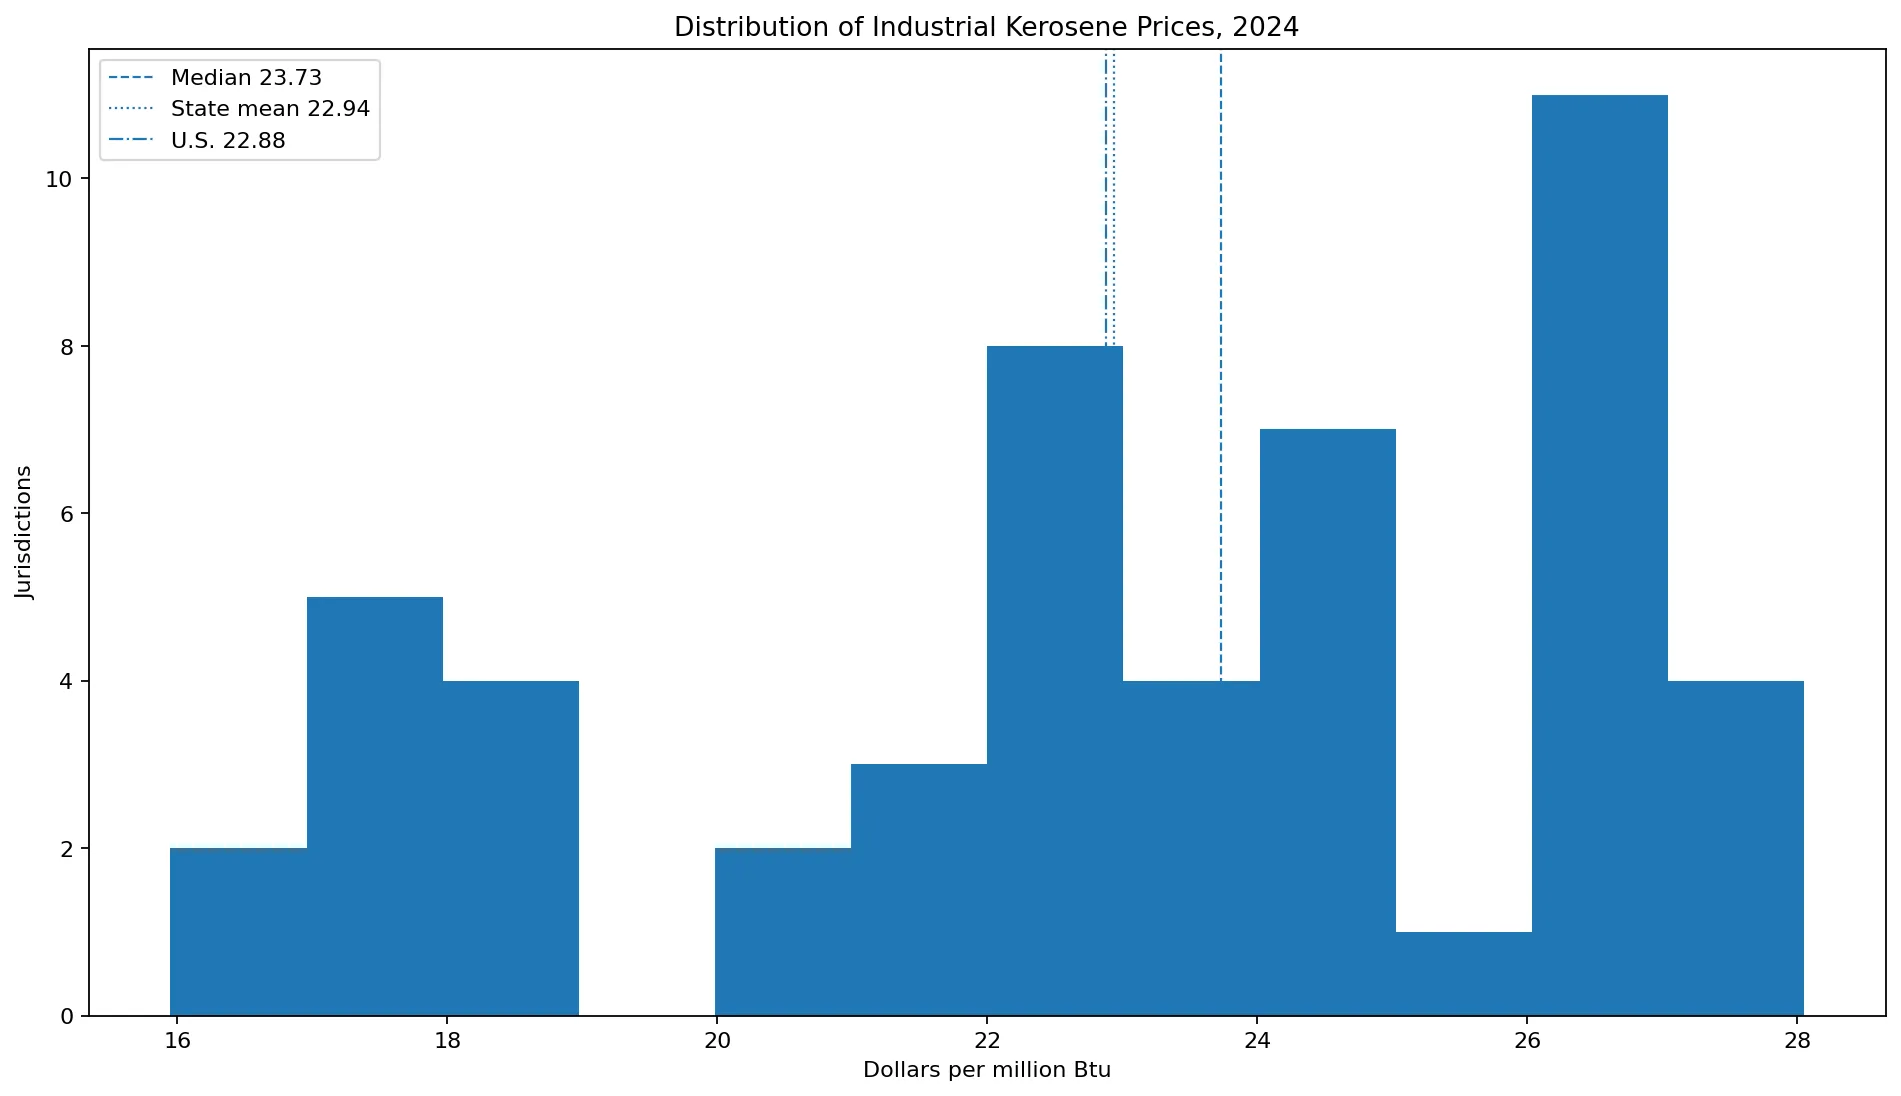
The simple mean of the 51 state and D.C. observations is about $22.94/MMBtu, and the median is $23.73. EIA Table F4 reports $22.88 for the United States. The national value is not simply the arithmetic mean of state prices. SEDS calculates the U.S. Btu price as a state price average weighted by kerosene consumption.
This means a state with more industrial kerosene consumption has more influence on the U.S. value than a state with very little consumption. The fact that $22.88 and $22.94 are close in 2024 does not mean the two calculations are interchangeable. For the price of a typical jurisdiction, the median is useful; for the effective price across U.S. industrial kerosene consumption, the EIA national figure is more appropriate.
Fifteen jurisdictions are at or above $26/MMBtu
Fifteen jurisdictions are priced at $26/MMBtu or more. Eight fall from $24 to below $26, twelve from $22 to below $24, five from $20 to below $22, and eleven are below $20. The distribution is therefore broad rather than concentrated in a single narrow band.
The first quartile is about $21.08 and the third quartile about $26.35. Half of all jurisdictions fall inside that approximately $5.27-wide interval. The full maximum-to-minimum spread is much larger because the upper Midwest high values and several low southern and western values extend the tails.
How the 2022-forward regression method works
EIA’s 2024 petroleum price technical documentation states that SEDS uses a separate regression equation for each state for 2022 forward. The dependent variable is the state’s historical SEDS industrial kerosene price for 2010 through 2021. The independent variables are the annual average U.S. No. 2 residential heating oil price, the annual average NYSERDA New York statewide retail kerosene price, and the Cushing, Oklahoma WTI crude oil spot price.
After generating the regression estimate, SEDS adds state general sales taxes. This is a significant methodological break from the earlier period when prices of kerosene sold for resale were directly available. Long time-series comparisons that cross 2021 and 2022 should therefore acknowledge the change in estimation method.
Why industrial prices differ from residential and commercial prices
EIA Table F4 reports a 2024 U.S. residential-and-commercial kerosene price of $29.20/MMBtu and an industrial price of $22.88. Historically, the residential and commercial series were tied to end-user prices, while the industrial series used resale prices. That distinction naturally produces different price levels even for the same petroleum product.
The 2022-forward regressions preserve the continuity of their respective historical series rather than collapsing all sectors into one number. A user comparing household heating costs with industrial energy prices should therefore use the appropriate sector column instead of treating the table’s kerosene values as interchangeable.
Kerosene is not the same series as kerosene-type jet fuel
The word kerosene is also associated with aviation, but this SEDS kerosene series is separate from kerosene-type jet fuel. Jet fuel has its own EIA petroleum product series, consumption estimates, and prices. The industrial kerosene values in this article should not be used as airline fuel costs or airport jet-fuel prices.
This product distinction matters throughout petroleum statistics. Kerosene, jet fuel, distillate fuel oil, residual fuel oil, and other petroleum products can have different uses, prices, taxes, and data sources. Matching the product definition is necessary before comparing state energy prices.
The middle of the ranking is tightly spaced
The top 15 observations are all above $26/MMBtu, while the lower tail drops into the $16–$19 range. In the middle, however, many values are close: North Carolina is $23.79, South Carolina and Hawaii are $23.73, Georgia is $23.40, and Alaska and Oregon are both $22.82.
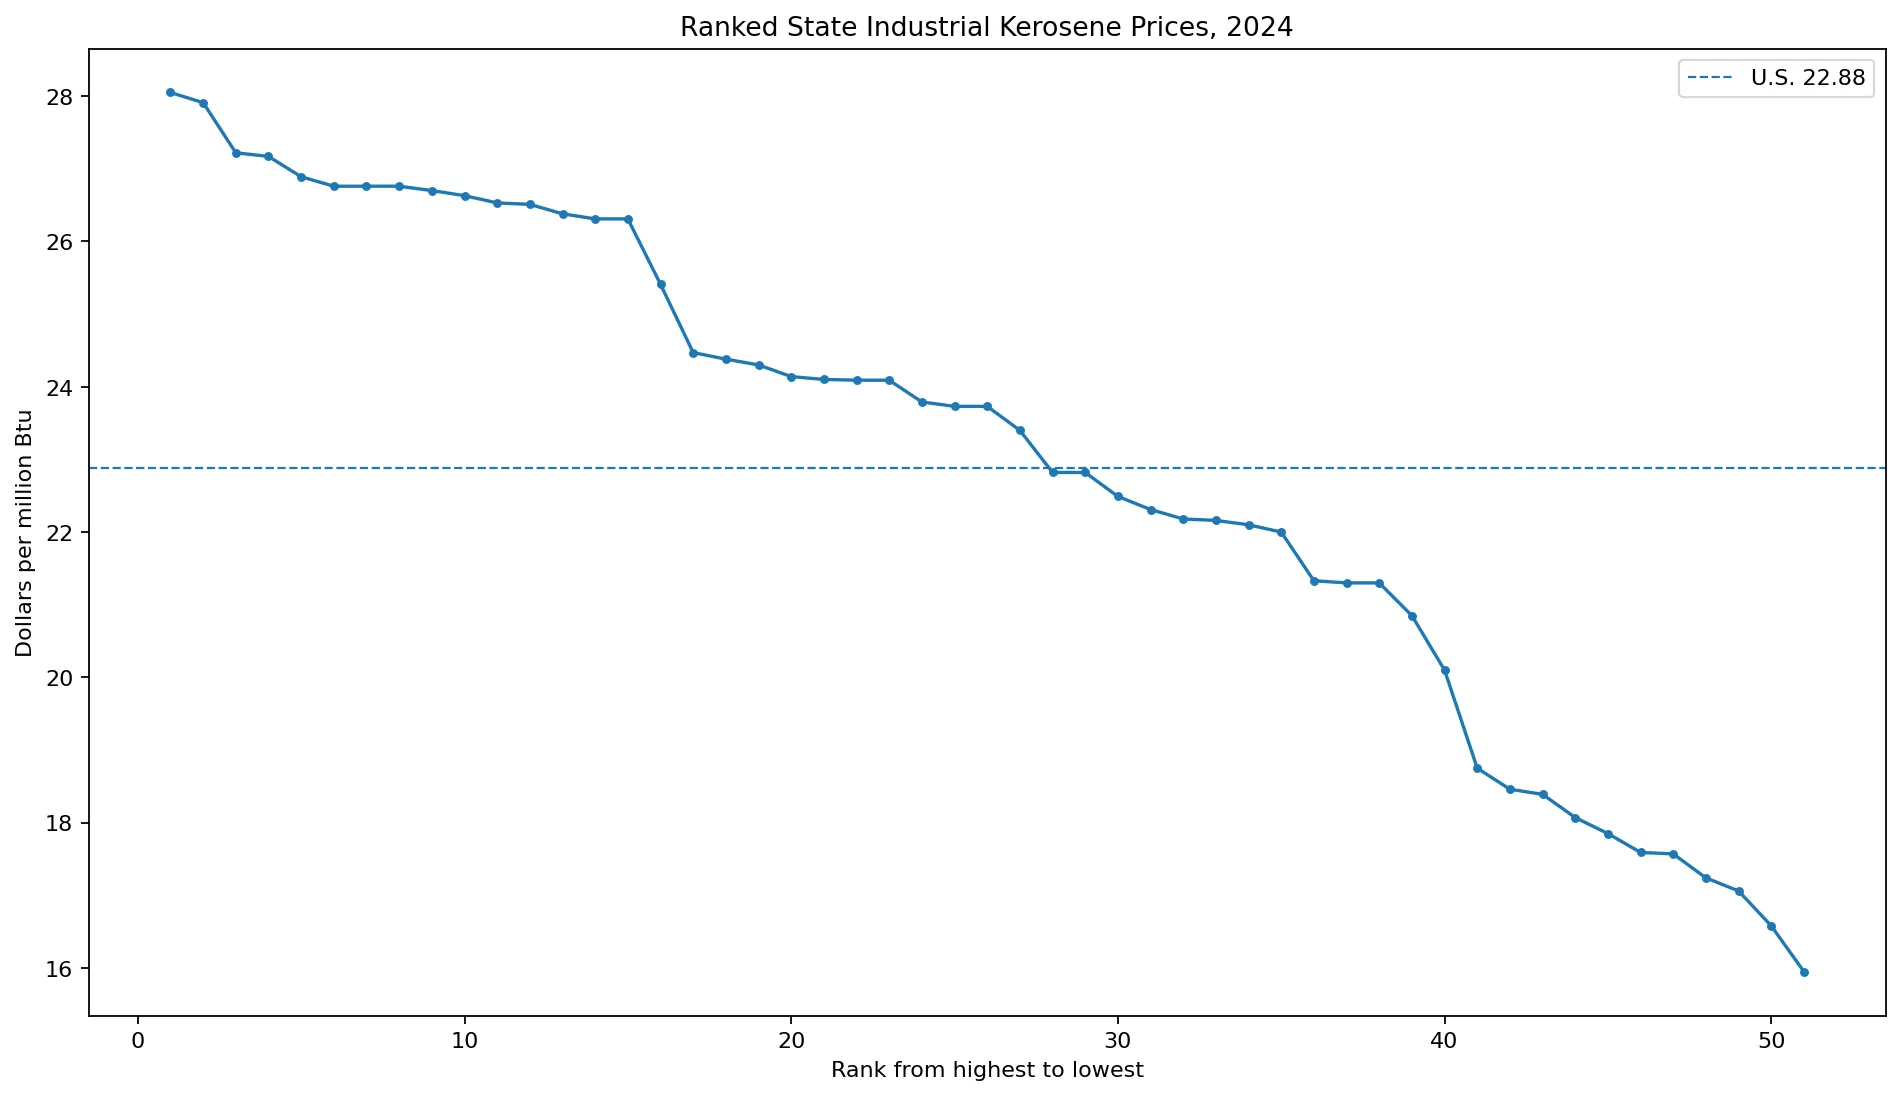
When values are tightly grouped, exact ordinal rank can be less informative than the price band. The series is estimated and published to two decimal places, so a difference of a few cents should not be treated as a precise measure of economic advantage.
Official EIA references
EIA Table F4 lists 2024 kerosene prices and expenditures for residential/commercial, industrial, and total sectors. The SEDS 2024 petroleum price technical documentation explains the industrial kerosene series, historical resale-price inputs, the 2022-forward state regression method, state sales taxes, and the Btu conversion process.
All 51 jurisdictions in 2024
The table below lists the 50 states and the District of Columbia from highest to lowest industrial kerosene price. All 51 observations are positive, and the unit is dollars per million Btu.
| Rank | State | Code | Year | $/MMBtu |
|---|---|---|---|---|
| 1 | Wisconsin | WI | 2024 | 28.05 |
| 2 | Minnesota | MN | 2024 | 27.91 |
| 3 | Illinois | IL | 2024 | 27.22 |
| 4 | Pennsylvania | PA | 2024 | 27.17 |
| 5 | Ohio | OH | 2024 | 26.89 |
| 6 | Iowa | IA | 2024 | 26.76 |
| 7 | Kentucky | KY | 2024 | 26.76 |
| 8 | Michigan | MI | 2024 | 26.76 |
| 9 | Indiana | IN | 2024 | 26.70 |
| 10 | Nebraska | NE | 2024 | 26.63 |
| 11 | Tennessee | TN | 2024 | 26.53 |
| 12 | North Dakota | ND | 2024 | 26.51 |
| 13 | Oklahoma | OK | 2024 | 26.38 |
| 14 | Missouri | MO | 2024 | 26.31 |
| 15 | South Dakota | SD | 2024 | 26.31 |
| 16 | Virginia | VA | 2024 | 25.41 |
| 17 | California | CA | 2024 | 24.47 |
| 18 | Nevada | NV | 2024 | 24.38 |
| 19 | Washington | WA | 2024 | 24.30 |
| 20 | Kansas | KS | 2024 | 24.14 |
| 21 | Arizona | AZ | 2024 | 24.10 |
| 22 | Florida | FL | 2024 | 24.09 |
| 23 | West Virginia | WV | 2024 | 24.09 |
| 24 | North Carolina | NC | 2024 | 23.79 |
| 25 | Hawaii | HI | 2024 | 23.73 |
| 26 | South Carolina | SC | 2024 | 23.73 |
| 27 | Georgia | GA | 2024 | 23.40 |
| 28 | Alaska | AK | 2024 | 22.82 |
| 29 | Oregon | OR | 2024 | 22.82 |
| 30 | New York | NY | 2024 | 22.49 |
| 31 | Rhode Island | RI | 2024 | 22.31 |
| 32 | Connecticut | CT | 2024 | 22.18 |
| 33 | Massachusetts | MA | 2024 | 22.16 |
| 34 | Vermont | VT | 2024 | 22.10 |
| 35 | Maine | ME | 2024 | 22.00 |
| 36 | New Jersey | NJ | 2024 | 21.33 |
| 37 | District of Columbia | DC | 2024 | 21.30 |
| 38 | Maryland | MD | 2024 | 21.30 |
| 39 | New Hampshire | NH | 2024 | 20.85 |
| 40 | Delaware | DE | 2024 | 20.10 |
| 41 | Arkansas | AR | 2024 | 18.75 |
| 42 | New Mexico | NM | 2024 | 18.46 |
| 43 | Louisiana | LA | 2024 | 18.39 |
| 44 | Mississippi | MS | 2024 | 18.07 |
| 45 | Texas | TX | 2024 | 17.85 |
| 46 | Utah | UT | 2024 | 17.59 |
| 47 | Idaho | ID | 2024 | 17.57 |
| 48 | Wyoming | WY | 2024 | 17.24 |
| 49 | Colorado | CO | 2024 | 17.06 |
| 50 | Montana | MT | 2024 | 16.58 |
| 51 | Alabama | AL | 2024 | 15.95 |
Frequently Asked Questions
Which state had the highest industrial kerosene price in 2024?
Wisconsin was highest at $28.05/MMBtu, followed by Minnesota at $27.91.
Which state had the lowest industrial kerosene price?
Alabama was lowest at $15.95/MMBtu, followed by Montana at $16.58 and Colorado at $17.06.
What was the U.S. industrial kerosene price in 2024?
EIA Table F4 reports a U.S. industrial-sector kerosene price of $22.88 per million Btu.
Are 2024 state industrial kerosene prices directly surveyed?
For 2022 forward, SEDS uses state regression equations based on historical state prices and broader petroleum price indicators, then adds state general sales taxes.
Related Articles
Green Map creates custom-edited map images using open geographic data sources such as geoBoundaries, Natural Earth, OpenStreetMap, and government open data. These maps are edited visual materials, not raw data files, and are provided for education, documents, presentations, and graphic reference.