World Bank indicator IC.FRM.CDP.ZS measures the percentage of firms that use courts, arbitration, mediation, or conciliation to resolve or attempt to resolve their commercial disputes. The latest non-empty file contains 160 country observations. The largest same-year group is 2025 with 62 economies, so the main distribution and ranking use those 62 observations while older rows retain their actual survey year.
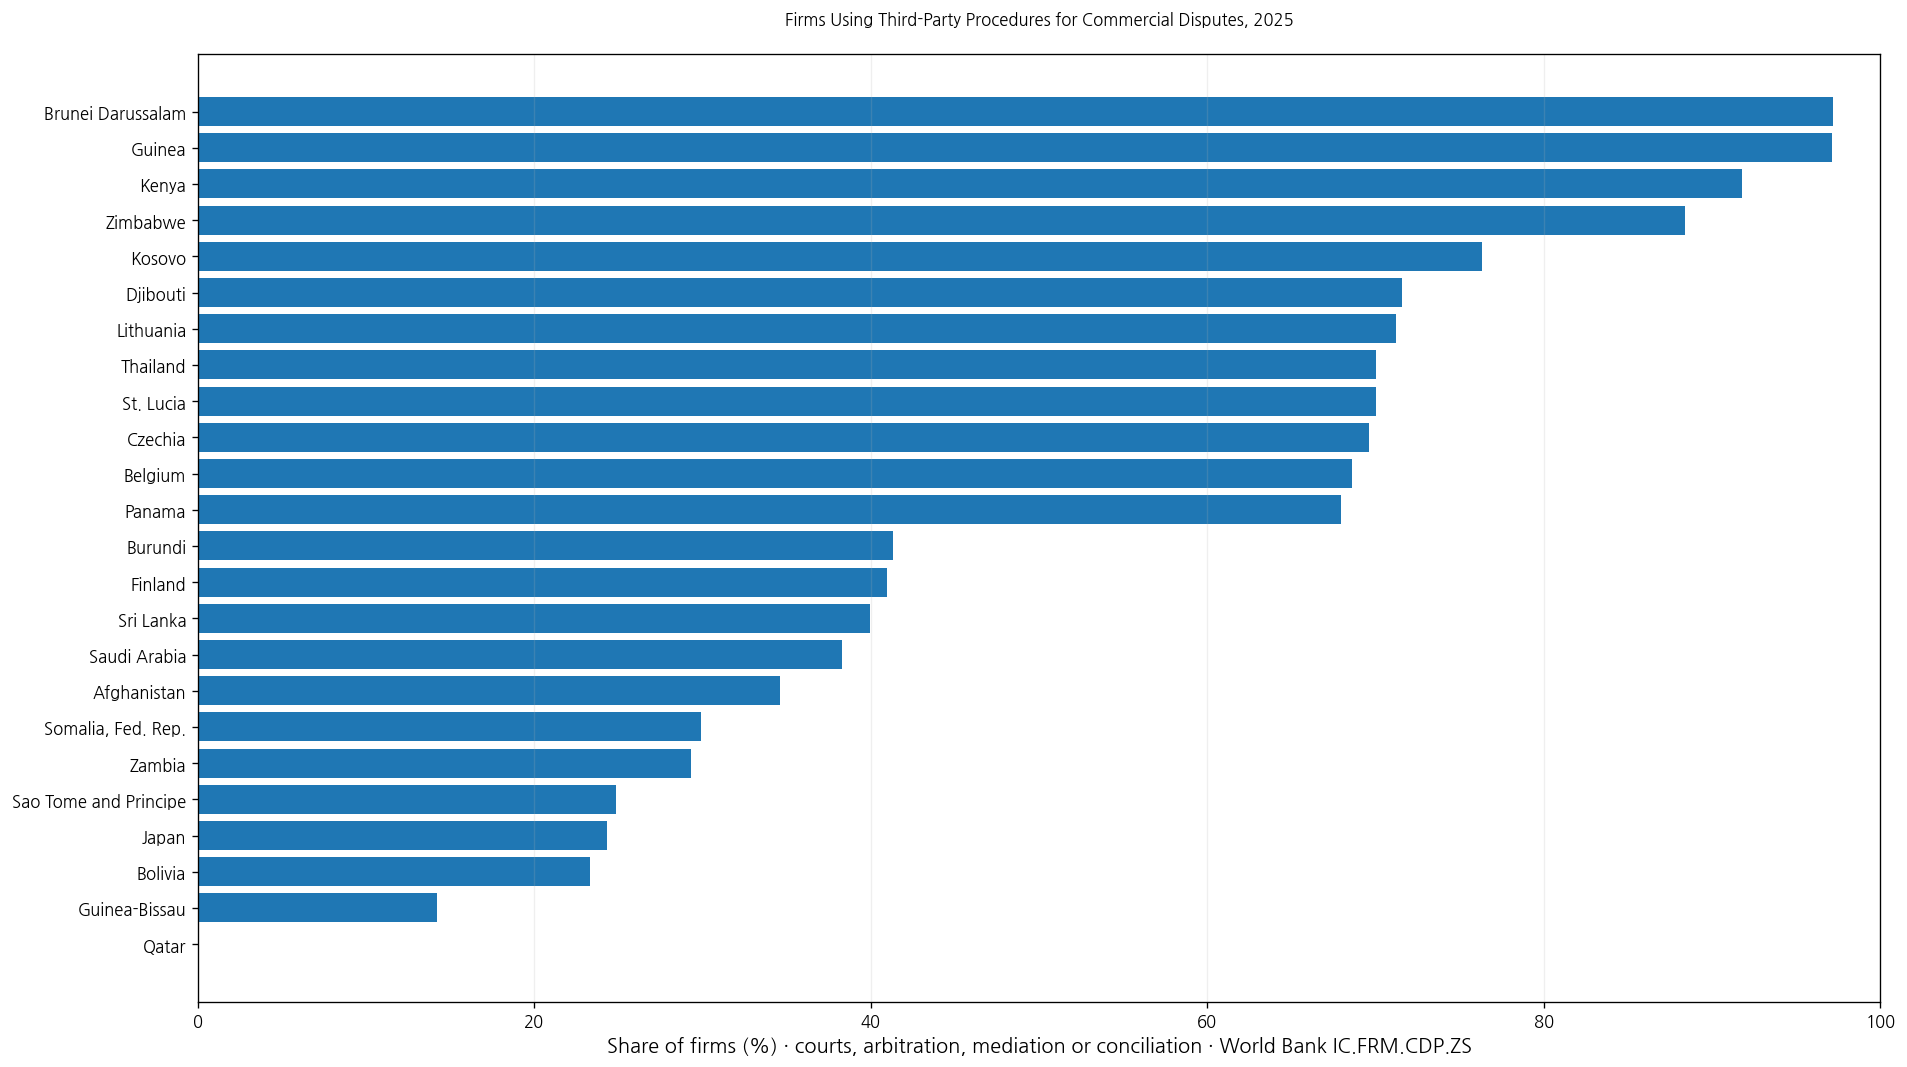
Table of Contents
What counts as a third-party dispute-resolution procedure
The definition includes courts as well as arbitration, mediation, and conciliation. It therefore covers more than formal litigation. What these channels share is the involvement of an institutional or third-party mechanism in resolving or attempting to resolve a commercial dispute.
Direct negotiation between business partners without one of these mechanisms is conceptually different. The indicator is best read as a measure of how commonly surveyed firms use institutional dispute-resolution channels.
This is not a win rate or a dispute-resolution success rate
A value of 70% does not mean 70% of cases were won or successfully resolved. The definition explicitly includes attempts to resolve disputes, so use of the procedure and the ultimate outcome are separate questions.
The indicator also says nothing by itself about legal costs, time to judgment, enforceability, or whether a settlement was favorable. Those dimensions require separate data.
It does not directly measure how often commercial disputes occur
A high value should not be interpreted as evidence that firms experience more disputes. The series reports use of third-party procedures, not the number or frequency of disputes.
One economy could have relatively few disputes but rely heavily on formal or institutional channels when disputes arise. Another could have many disagreements but resolve them mainly through direct negotiation.
The 2025 mean is 52.89% and the median is 51.09%
The 2025 subset contains 62 economies. Its mean is 52.89% and median 51.09%. The first quartile is 41.96% and the third quartile 63.77%, placing the middle half roughly between 41.96% and 63.77%.
31 economies are at or above 50%, 5 are at or above 75%, and 3 exceed 90%. At the lower end, 5 economies are below 25%.
Brunei Darussalam and Guinea exceed 97% in 2025
Brunei Darussalam records 97.19%, Guinea 97.12%, Kenya 91.78%, Zimbabwe 88.42%, and Kosovo 76.34%. Djibouti, Lithuania, Thailand, St. Lucia, and Czechia are also close to or above 70%.
| 2025 rank | Economy/territory | Firms using third-party procedures |
|---|---|---|
| 1 | Brunei Darussalam | 97.19% |
| 2 | Guinea | 97.12% |
| 3 | Kenya | 91.78% |
| 4 | Zimbabwe | 88.42% |
| 5 | Kosovo | 76.34% |
| 6 | Djibouti | 71.60% |
| 7 | Lithuania | 71.19% |
| 8 | Thailand | 70.05% |
| 9 | St. Lucia | 70.00% |
| 10 | Czechia | 69.60% |
| 11 | Belgium | 68.59% |
| 12 | Panama | 67.94% |
| 13 | Grenada | 66.67% |
| 14 | Austria | 66.61% |
| 15 | Poland | 64.17% |
| 16 | Ethiopia | 63.85% |
| 17 | Nigeria | 63.53% |
| 18 | Germany | 63.36% |
| 19 | Dominican Republic | 63.08% |
| 20 | Gabon | 62.08% |
These high shares show that institutional third-party mechanisms were widely used by firms represented in the indicator. They do not by themselves demonstrate that the legal system is faster, cheaper, fairer, or more effective.
Qatar records an official 0% in 2025
At the lower end, Qatar is reported at 0.00%, followed by Guinea-Bissau at 14.24%, Bolivia at 23.32%, Japan at 24.30%, and Sao Tome and Principe at 24.84%. Zambia and Somalia, Fed. Rep. are around 29%.
| Low-order position in 2025 | Economy/territory | Firms using third-party procedures |
|---|---|---|
| 1 | Qatar | 0.00% |
| 2 | Guinea-Bissau | 14.24% |
| 3 | Bolivia | 23.32% |
| 4 | Japan | 24.30% |
| 5 | Sao Tome and Principe | 24.84% |
| 6 | Zambia | 29.33% |
| 7 | Somalia, Fed. Rep. | 29.89% |
| 8 | Afghanistan | 34.63% |
| 9 | Saudi Arabia | 38.31% |
| 10 | Sri Lanka | 39.95% |
| 11 | Finland | 40.95% |
| 12 | Burundi | 41.32% |
| 13 | St. Vincent and the Grenadines | 41.58% |
| 14 | Norway | 41.62% |
| 15 | Switzerland | 41.88% |
| 16 | Albania | 41.94% |
| 17 | Niger | 42.01% |
| 18 | Maldives | 42.08% |
| 19 | Chile | 42.08% |
| 20 | Comoros | 44.17% |
Qatar’s zero is a reported value in this dataset and is therefore different from a missing observation. It should not be restated as proof that no commercial disputes occurred; the indicator measures use of third-party procedures, not the existence of disputes.
A 100% value exists, but it is not from 2025
The complete latest-observation file contains a 100.00% value for Bosnia and Herzegovina in 2023. That observation is preserved with its year rather than mixed into the 2025 ranking.
The highest same-year 2025 value is Brunei Darussalam at 97.19%. Keeping the survey year visible prevents mixed-year results from being mistaken for a current single-year leaderboard.
The indicator does not separate courts from arbitration or mediation
Courts, arbitration, mediation, and conciliation are combined in one measure. A high country value does not reveal which mechanism accounts for most of the use.
A deeper institutional analysis would need separate information on court filings, arbitration caseloads, mediation, processing time, cost, enforcement, and settlement patterns.
Firm size and sector composition can matter to interpretation
Commercial dispute behavior can vary with firm size, industry, contract complexity, access to legal counsel, and the nature of business relationships. The country aggregate does not identify which firm characteristics drive the result.
Enterprise-survey indicators should therefore be read as national survey outcomes rather than universal behavior for every company in the economy.
A low share does not automatically mean weak institutions
Low use of third-party procedures can have different explanations. Direct negotiation may work well, informal business networks may be important, or formal procedures may be expensive or difficult to access.
This indicator alone cannot distinguish among those possibilities. Additional evidence on legal access, cost, processing time, contract enforcement, and business confidence is needed.
The 160 latest observations span 2021–2025
The latest non-empty observations include 62 from 2025, 48 from 2024, 45 from 2023, 4 from 2022, and 1 from 2021.
| Observation year | Economies/territories | Share of 160 |
|---|---|---|
| 2025 | 62 | 38.8% |
| 2024 | 48 | 30.0% |
| 2023 | 45 | 28.1% |
| 2022 | 4 | 2.5% |
| 2021 | 1 | 0.6% |
The full set should therefore not be presented as a 2025 ranking of 160 economies. The 62 observations dated 2025 support a same-year comparison; the full file is better treated as each economy’s latest available observation.
Complete list of the 160 latest observations
The table below lists every economy and territory’s latest non-empty observation alphabetically, with the observation year shown beside the percentage.
| Economy/territory | Observation year | Firms using third-party procedures |
|---|---|---|
| Afghanistan | 2025 | 34.63% |
| Albania | 2025 | 41.94% |
| Angola | 2024 | 45.67% |
| Antigua and Barbuda | 2025 | 58.70% |
| Armenia | 2024 | 42.27% |
| Australia | 2025 | 57.52% |
| Austria | 2025 | 66.61% |
| Azerbaijan | 2024 | 85.48% |
| Bahrain | 2024 | 66.65% |
| Bangladesh | 2022 | 57.69% |
| Barbados | 2023 | 65.74% |
| Belgium | 2025 | 68.59% |
| Belize | 2025 | 55.69% |
| Benin | 2024 | 54.48% |
| Bhutan | 2024 | 67.48% |
| Bolivia | 2025 | 23.32% |
| Bosnia and Herzegovina | 2023 | 100.00% |
| Botswana | 2023 | 64.02% |
| Brazil | 2025 | 48.80% |
| Brunei Darussalam | 2025 | 97.19% |
| Bulgaria | 2023 | 77.46% |
| Burkina Faso | 2024 | 68.19% |
| Burundi | 2025 | 41.32% |
| Cabo Verde | 2024 | 70.47% |
| Cambodia | 2023 | 20.83% |
| Cameroon | 2024 | 62.13% |
| Canada | 2024 | 62.54% |
| Central African Republic | 2023 | 47.19% |
| Chad | 2023 | 67.33% |
| Chile | 2025 | 42.08% |
| China | 2024 | 81.41% |
| Colombia | 2023 | 56.76% |
| Comoros | 2025 | 44.17% |
| Congo, Dem. Rep. | 2024 | 35.66% |
| Congo, Rep. | 2024 | 55.99% |
| Costa Rica | 2023 | 18.52% |
| Cote d’Ivoire | 2023 | 37.53% |
| Croatia | 2023 | 65.55% |
| Cyprus | 2024 | 63.24% |
| Czechia | 2025 | 69.60% |
| Denmark | 2025 | 44.40% |
| Djibouti | 2025 | 71.60% |
| Dominican Republic | 2025 | 63.08% |
| Ecuador | 2024 | 48.85% |
| Egypt, Arab Rep. | 2025 | 60.22% |
| El Salvador | 2023 | 32.14% |
| Equatorial Guinea | 2024 | 58.00% |
| Estonia | 2023 | 46.55% |
| Eswatini | 2024 | 59.91% |
| Ethiopia | 2025 | 63.85% |
| Fiji | 2025 | 55.14% |
| Finland | 2025 | 40.95% |
| France | 2025 | 57.80% |
| Gabon | 2025 | 62.08% |
| Gambia, The | 2023 | 13.80% |
| Georgia | 2023 | 78.45% |
| Germany | 2025 | 63.36% |
| Ghana | 2023 | 71.25% |
| Greece | 2023 | 25.25% |
| Grenada | 2025 | 66.67% |
| Guatemala | 2025 | 48.77% |
| Guinea | 2025 | 97.12% |
| Guinea-Bissau | 2025 | 14.24% |
| Hong Kong SAR, China | 2023 | 59.28% |
| Hungary | 2023 | 22.05% |
| Iceland | 2024 | 53.19% |
| India | 2025 | 48.22% |
| Indonesia | 2023 | 14.15% |
| Iraq | 2022 | 58.78% |
| Ireland | 2024 | 70.59% |
| Israel | 2024 | 82.57% |
| Italy | 2024 | 62.48% |
| Jamaica | 2024 | 66.16% |
| Japan | 2025 | 24.30% |
| Jordan | 2024 | 84.65% |
| Kazakhstan | 2024 | 74.07% |
| Kenya | 2025 | 91.78% |
| Kiribati | 2025 | 59.30% |
| Korea, Rep. | 2024 | 49.09% |
| Kosovo | 2025 | 76.34% |
| Kuwait | 2025 | 53.30% |
| Kyrgyz Republic | 2023 | 45.82% |
| Lao PDR | 2024 | 15.03% |
| Latvia | 2024 | 51.70% |
| Lesotho | 2023 | 86.38% |
| Liberia | 2025 | 58.59% |
| Lithuania | 2025 | 71.19% |
| Madagascar | 2022 | 38.66% |
| Malawi | 2025 | 47.87% |
| Malaysia | 2024 | 47.11% |
| Maldives | 2025 | 42.08% |
| Mali | 2024 | 56.68% |
| Malta | 2024 | 71.72% |
| Mauritania | 2025 | 53.61% |
| Mauritius | 2023 | 54.91% |
| Mexico | 2023 | 3.99% |
| Moldova | 2024 | 60.37% |
| Mongolia | 2025 | 48.89% |
| Montenegro | 2023 | 91.21% |
| Morocco | 2023 | 45.01% |
| Mozambique | 2025 | 48.11% |
| Namibia | 2024 | 45.42% |
| Nepal | 2023 | 7.22% |
| Netherlands | 2025 | 46.72% |
| New Zealand | 2023 | 61.50% |
| Niger | 2025 | 42.01% |
| Nigeria | 2025 | 63.53% |
| North Macedonia | 2023 | 76.92% |
| Norway | 2025 | 41.62% |
| Pakistan | 2022 | 46.31% |
| Panama | 2025 | 67.94% |
| Papua New Guinea | 2024 | 63.46% |
| Paraguay | 2023 | 44.72% |
| Peru | 2023 | 60.04% |
| Philippines | 2023 | 24.45% |
| Poland | 2025 | 64.17% |
| Portugal | 2023 | 76.04% |
| Qatar | 2025 | 0.00% |
| Romania | 2023 | 82.40% |
| Rwanda | 2023 | 64.09% |
| Samoa | 2023 | 30.00% |
| Sao Tome and Principe | 2025 | 24.84% |
| Saudi Arabia | 2025 | 38.31% |
| Senegal | 2024 | 50.54% |
| Serbia | 2024 | 77.43% |
| Seychelles | 2023 | 79.55% |
| Sierra Leone | 2023 | 73.62% |
| Singapore | 2023 | 59.31% |
| Slovak Republic | 2023 | 79.37% |
| Slovenia | 2024 | 87.84% |
| Solomon Islands | 2025 | 55.88% |
| Somalia, Fed. Rep. | 2025 | 29.89% |
| South Sudan | 2024 | 90.48% |
| Spain | 2024 | 50.61% |
| Sri Lanka | 2025 | 39.95% |
| St. Lucia | 2025 | 70.00% |
| St. Vincent and the Grenadines | 2025 | 41.58% |
| Suriname | 2025 | 44.39% |
| Sweden | 2024 | 36.77% |
| Switzerland | 2025 | 41.88% |
| Tajikistan | 2024 | 30.01% |
| Tanzania | 2023 | 43.16% |
| Thailand | 2025 | 70.05% |
| Timor-Leste | 2021 | 50.72% |
| Togo | 2023 | 68.36% |
| Tonga | 2024 | 10.10% |
| Trinidad and Tobago | 2025 | 47.37% |
| Tunisia | 2024 | 58.74% |
| Turkiye | 2024 | 64.04% |
| Turkmenistan | 2024 | 24.89% |
| Uganda | 2025 | 48.21% |
| United Kingdom | 2024 | 54.32% |
| United States | 2024 | 49.00% |
| Uruguay | 2024 | 51.87% |
| Uzbekistan | 2024 | 34.19% |
| Vanuatu | 2023 | 30.67% |
| Viet Nam | 2023 | 33.05% |
| West Bank and Gaza | 2023 | 82.43% |
| Zambia | 2025 | 29.33% |
| Zimbabwe | 2025 | 88.42% |
How to interpret the comparison
First, the indicator covers courts, arbitration, mediation, and conciliation used to resolve or attempt to resolve commercial disputes. Second, it is not a win rate or settlement-success rate. Third, it does not directly measure dispute frequency.
Fourth, the combined measure does not reveal the mix of dispute-resolution channels. Fifth, the full 160-row file mixes survey years. Sixth, country differences should not be given unsupported causal explanations without additional institutional evidence.
Source and calculation
The source is World Bank World Development Indicators IC.FRM.CDP.ZS, Firms that use a third party to resolve commercial disputes (% of firms). The 2025 mean, median, quartiles, threshold counts, and rankings use only the 62 observations dated 2025. The complete table retains all 160 latest non-empty observations.
Frequently Asked Questions
Which dispute-resolution procedures are included?
The World Bank definition includes courts, arbitration, mediation, and conciliation used to resolve or attempt to resolve commercial disputes.
Does a high percentage mean firms win more disputes?
No. The indicator measures use of third-party procedures, not win rates or final settlement success.
What is the 2025 median?
The median across the 62 observations dated 2025 is 51.09%, while the mean is 52.89%.
Related Articles
Green Map creates custom-edited map images using open geographic data sources such as geoBoundaries, Natural Earth, OpenStreetMap, and government open data. These maps are edited visual materials, not raw data files, and are provided for education, documents, presentations, and graphic reference.