U.S. Energy Information Administration data for 2024 show a wide state-level spread in the price of motor gasoline used in the transportation sector. The unit is dollars per million Btu, not the dollars-per-gallon figure displayed at a retail pump. Across the 50 states and the District of Columbia, the simple mean was $27.62 per MMBtu and the median was $26.68. Hawaii had the highest observation at $39.30 per MMBtu, almost identical to Alaska at $39.29, while Texas had the lowest at $23.97. The contrast is meaningful only when the EIA energy-price unit is kept intact.
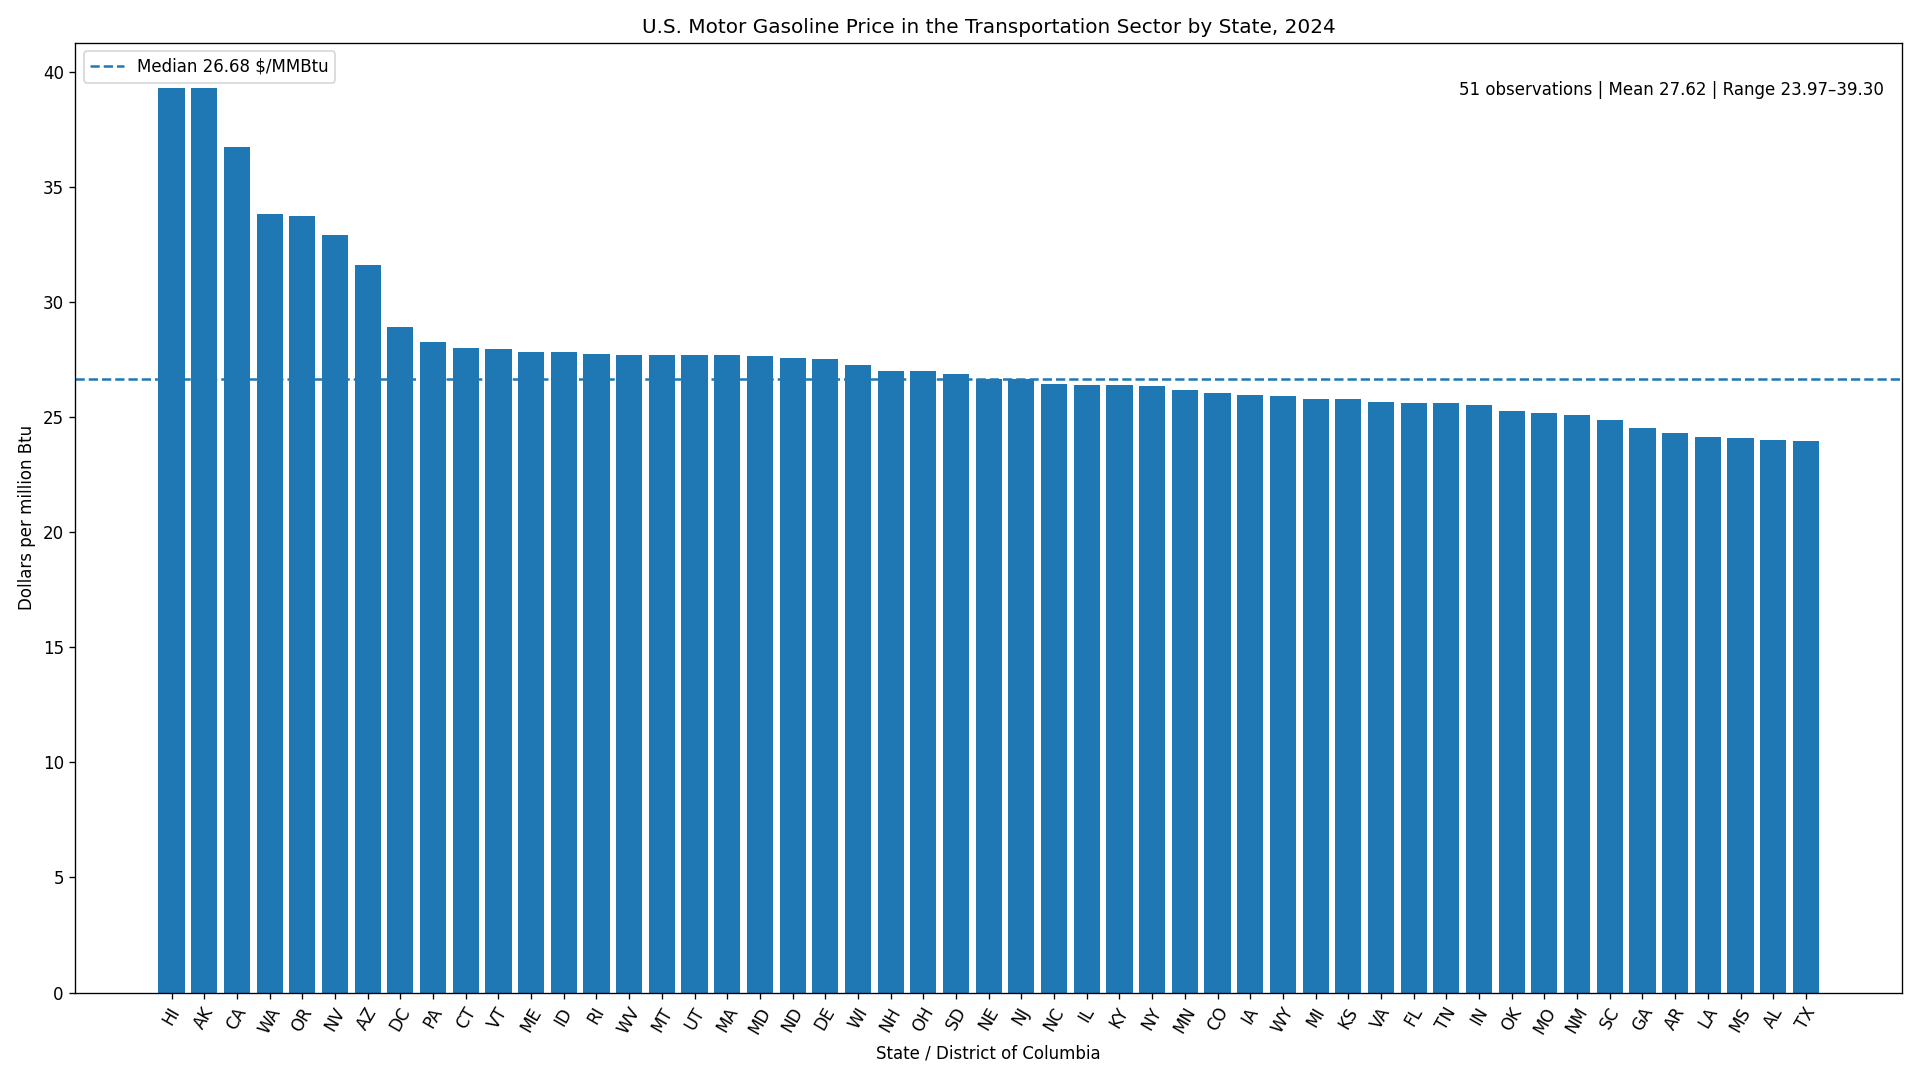
Table of Contents
This is not the retail price per gallon at the pump
The official series is “Motor gasoline price in the transportation sector,” reported by the EIA State Energy Data System in dollars per million Btu. A million Btu is a heat-content unit. Expressing a fuel price on this basis converts the value into the cost of a common amount of energy. A reading of $30 per MMBtu therefore does not mean a gallon of gasoline cost $30. It means the energy-equivalent amount of motor gasoline was priced at $30 for each million Btu under the SEDS definition.
That distinction matters throughout the comparison. The observations can be ranked directly because every jurisdiction uses the same year, sector, fuel, and unit, but they should not be rewritten as pump prices. Converting the series to dollars per gallon would require an appropriate heat-content relationship and confirmation that the conversion is consistent with the EIA series definition. This analysis does not make that conversion; it stays with the published energy-price unit to avoid mixing two different measures.
Most state observations were concentrated in the mid-to-high $20s per MMBtu
The 51 observations had a median of $26.68 per MMBtu and an unweighted mean of $27.62. The first quartile was $25.66 and the third quartile was $27.80. Thirty-seven jurisdictions were within $2 of the median, showing that much of the distribution was fairly compact even though the full range was large. The mean sat about $0.94 above the median because several high observations at the top pulled the arithmetic average upward.
Seven observations were below $25 per MMBtu, 20 were from $25 to below $27, and 17 were from $27 to below $30. In other words, 44 of 51 jurisdictions remained below $30 per MMBtu. Only seven were at or above $30, and only Hawaii, Alaska, and California were above $35. The shape is therefore better described as a dense middle with a relatively small high-price tail than as an evenly spread national distribution.
Hawaii and Alaska were nearly tied at the top
Hawaii recorded $39.30 per MMBtu and Alaska $39.29, a difference of only one cent on the reported scale. California followed at $36.76. The gap from Hawaii to the lowest observation, Texas at $23.97, was $15.33 per MMBtu. Hawaii’s value was about 1.64 times the Texas value, or roughly 64% higher. Because the comparison uses a common EIA series and a common year, these state-level differences can be described directly without adding a model or imputation.
The next group also stood clearly above the national middle: Washington was $33.82, Oregon $33.75, Nevada $32.90, and Arizona $31.60 per MMBtu. Those four states, together with Hawaii, Alaska, and California, made up all seven observations above $30. The data show a western and noncontiguous concentration among the highest values, but the 51-row price series does not contain causal variables. It cannot by itself assign the gap to taxes, fuel specifications, refining patterns, transport distance, or any other specific mechanism.
The lowest values clustered across several southern states
Texas had the lowest 2024 observation at $23.97 per MMBtu. Alabama followed at $24.03, Mississippi at $24.11, Louisiana at $24.16, Arkansas at $24.32, Georgia at $24.54, and South Carolina at $24.88. Those seven jurisdictions were the complete set below $25. New Mexico at $25.09, Missouri at $25.20, and Oklahoma at $25.26 were the next-lowest observations.
A low value in this series should not be treated as a complete measure of household fuel burden. Drivers experience expenses through gallons purchased, vehicle fuel economy, miles traveled, retail pump prices, income, and available transportation alternatives. The SEDS price is one energy-price dimension. It is useful for comparing state-level motor gasoline prices on a heat-content basis, but additional data are needed to assess affordability or total household spending.
The upper tail was more separated than the middle of the distribution
The top three jurisdictions—Hawaii, Alaska, and California—were all above $35 per MMBtu. Washington, in fourth place, was $33.82, about $2.94 below California. Arizona, seventh at $31.60, was followed by the District of Columbia at $28.94, a further drop of $2.66. These breaks show that the very highest observations were not just slightly above the rest; they formed a visibly separated upper tier in 2024.
The central portion was much tighter. Pennsylvania was $28.26, Connecticut $28.01, Vermont $27.98, Maine $27.84, Idaho $27.82, and Rhode Island $27.77. Several positions in the ranking were separated by only a few cents or a few tenths of a dollar per MMBtu. For those jurisdictions, the numerical gap is more informative than the ordinal rank. A state can move several places in a sorted list while remaining very close to its neighbors in actual price.
Selected 2024 state observations
| State or jurisdiction | Transportation-sector motor gasoline price ($ per million Btu) |
|---|---|
| Hawaii | 39.30 |
| Alaska | 39.29 |
| California | 36.76 |
| Washington | 33.82 |
| Oregon | 33.75 |
| Nevada | 32.90 |
| Arizona | 31.60 |
| District of Columbia | 28.94 |
| Pennsylvania | 28.26 |
| Connecticut | 28.01 |
| Texas | 23.97 |
| Alabama | 24.03 |
| Mississippi | 24.11 |
| Louisiana | 24.16 |
| Arkansas | 24.32 |
The table samples the top, the upper-middle, and the bottom of the 51-jurisdiction distribution. Hawaii and Alaska were almost identical at the maximum, while California remained distinctly above the next group. The District of Columbia was above the national median but still below $30 per MMBtu. At the lower end, Texas through Arkansas were tightly grouped around $24. The table is therefore more useful as a view of price gaps than as a simple leaderboard.
The $27.62 mean is not a U.S. consumption-weighted national price
The mean reported here is a simple average of 51 jurisdiction-level observations. California and a much smaller state each contribute one value. It is therefore not a national price weighted by population, gallons consumed, or transportation-sector energy use. A consumption-weighted national estimate would require a compatible state-level consumption denominator and a separate calculation. Treating the unweighted mean as a national consumer price would give the statistic a meaning it does not have.
The median of $26.68 per MMBtu is less sensitive to the small group of high observations. It marks the middle position after the 51 values are sorted. For a quick description of the typical state-level location in this dataset, reading the mean and median together is more informative than relying on either one alone. The difference between them also helps reveal the upward pull from Hawaii, Alaska, California, and the other high-price western observations.
What a one-year cross-section can and cannot answer
A common-year state cross-section is well suited to questions such as which jurisdictions were highest or lowest in 2024, how wide the range was, and whether most states clustered near the center. It is not enough to determine whether a state’s price was rising or falling. That requires the same series for earlier years. A state that was high in 2024 might have increased, decreased, or remained stable compared with 2023; none of those paths can be inferred from one annual slice.
The same limitation applies to explanations. Taxes, fuel specifications, refining and distribution systems, geography, and regional supply conditions may be relevant topics for a deeper study, but they are not variables in this dataset. The defensible conclusion from these 51 rows is the observed state distribution, not a causal story. A follow-up analysis would need to join the price series with carefully matched explanatory data and still distinguish correlation from causation.
Why the dollars-per-MMBtu unit is useful
Dollars per million Btu puts the price on a common energy-content basis. Physical fuels are sold in units such as gallons, but a heat-content price allows analysts to compare the cost of energy across fuels and sectors more consistently. That is why energy systems such as SEDS frequently use Btu-based measures. For general readers, however, the unit is less familiar than dollars per gallon, so the label should always remain attached to the number.
All 51 observations in this comparison use the same dollars-per-million-Btu unit and the same 2024 reference year. No missing values were replaced with zero, no other year was substituted, and no currency or physical-unit conversion was applied. The full geographic coverage is 50 states plus the District of Columbia. This consistent scope is what makes the rank order and state-to-state differences directly comparable within the series.
Useful companion indicators for deeper analysis
The EIA data system offers several related measures that could add context, including motor gasoline consumption, other petroleum-product prices, sectoral fuel use, and heat-content series. Comparing a state’s motor gasoline price with its consumption can help separate price level from market size. Comparing gasoline with distillate fuel or other petroleum products can show whether a state’s high position is specific to one fuel or part of a broader energy-price pattern.
A household-focused analysis would need a different set of companions: retail dollars per gallon, vehicle efficiency, annual mileage, household income, and transportation alternatives. A policy-focused analysis might add fuel taxes, fuel standards, or distribution infrastructure. Those are separate questions from the one answered here. The 2024 SEDS series provides a clean baseline for where each jurisdiction stood on an energy-content price measure before those additional dimensions are introduced.
Source, coverage, and calculation notes
The source is the U.S. Energy Information Administration State Energy Data System (SEDS), an official annual energy dataset. The metric is “Motor gasoline price in the transportation sector,” with 2024 observations for all 50 states and the District of Columbia. The unit is dollars per million Btu. The mean, median, quartiles, range, interval counts, and rankings in this article were calculated directly from the 51 published observations. EIA data services and documentation are available through EIA Open Data.
The maximum-to-minimum spread was $15.33 per MMBtu, and the maximum was about 1.64 times the minimum. These are descriptive calculations, not modeled estimates. The analysis does not infer missing values, does not merge other years, and does not convert the series to dollars per gallon. Keeping the four identifiers—transportation sector, motor gasoline, 2024, and dollars per million Btu—together is essential whenever the figures are reused.
Frequently Asked Questions
Are these prices the same as retail dollars per gallon at a gas station?
No. The EIA SEDS series is reported in dollars per million Btu for motor gasoline in the transportation sector. It is an energy-content price, not the pump price per gallon.
Which jurisdictions had the highest and lowest values in 2024?
Hawaii was highest at $39.30 per MMBtu, almost tied with Alaska at $39.29. Texas was lowest at $23.97 per MMBtu.
What was the median across the 51 observations?
The median was $26.68 per MMBtu and the simple mean was $27.62. The mean is not weighted by state population or gasoline consumption.
Related Articles
Green Map creates custom-edited map images using open geographic data sources such as geoBoundaries, Natural Earth, OpenStreetMap, and government open data. These maps are edited visual materials, not raw data files, and are provided for education, documents, presentations, and graphic reference.