Stevens County lies in west-central Minnesota, with Morris serving as the easiest place to orient yourself on the map. U.S. 59, MN 9, and MN 28 meet around Morris, while Donnelly, Hancock, Alberta, and Chokio form smaller town centers in other parts of the county. The eastern side is shaped by the Pomme de Terre River and a scattering of lakes, while the elevation map shows higher ground becoming more common toward the east. High-resolution JPG copies of all four maps can be downloaded together from the file box near the end of the page. High-resolution map files are available for download in the section below.
If you are new to Stevens County, start with Morris and work outward. Alberta and Chokio sit to the west, Donnelly is north of Morris, and Hancock lies to the southeast. That settlement pattern is easy to follow on the road map, but the county becomes more interesting when the water and elevation views are added. The Pomme de Terre valley creates a long low corridor in the east, while broad farmland and smaller creeks cover much of the west.
Table of Contents
Morris at the meeting point of U.S. 59, MN 9, and MN 28
Morris is the strongest visual anchor on the county map because several important highways come together there. U.S. 59 runs north and south through the area, while MN 9 and MN 28 connect Morris with communities in other directions. Once Morris is located, the smaller towns are easier to place without scanning the entire county. The map also labels neighboring counties, which helps show where Stevens County sits within the wider west-central Minnesota region.
Donnelly appears north of Morris, Hancock is southeast, and Alberta and Chokio extend the settlement pattern toward the west. Long straight rural roads fill the space between the towns, with county roads adding local connections beyond the state and U.S. routes. The map is useful for orientation, but it does not show current construction, traffic, closures, or driving times. Those details should be checked with current transportation or navigation sources before a trip.
The county boundary helps explain why some towns feel close to the edge of the map. Hancock is near the Pope and Swift County sides, while Chokio provides a useful reference point for the western half. Morris has a larger urban footprint with parks, rail lines, and a denser street pattern than the surrounding towns. This contrast makes the basic map useful for both county-wide orientation and a quick comparison between the main service center and the surrounding rural communities.
How far the smaller towns sit from Morris
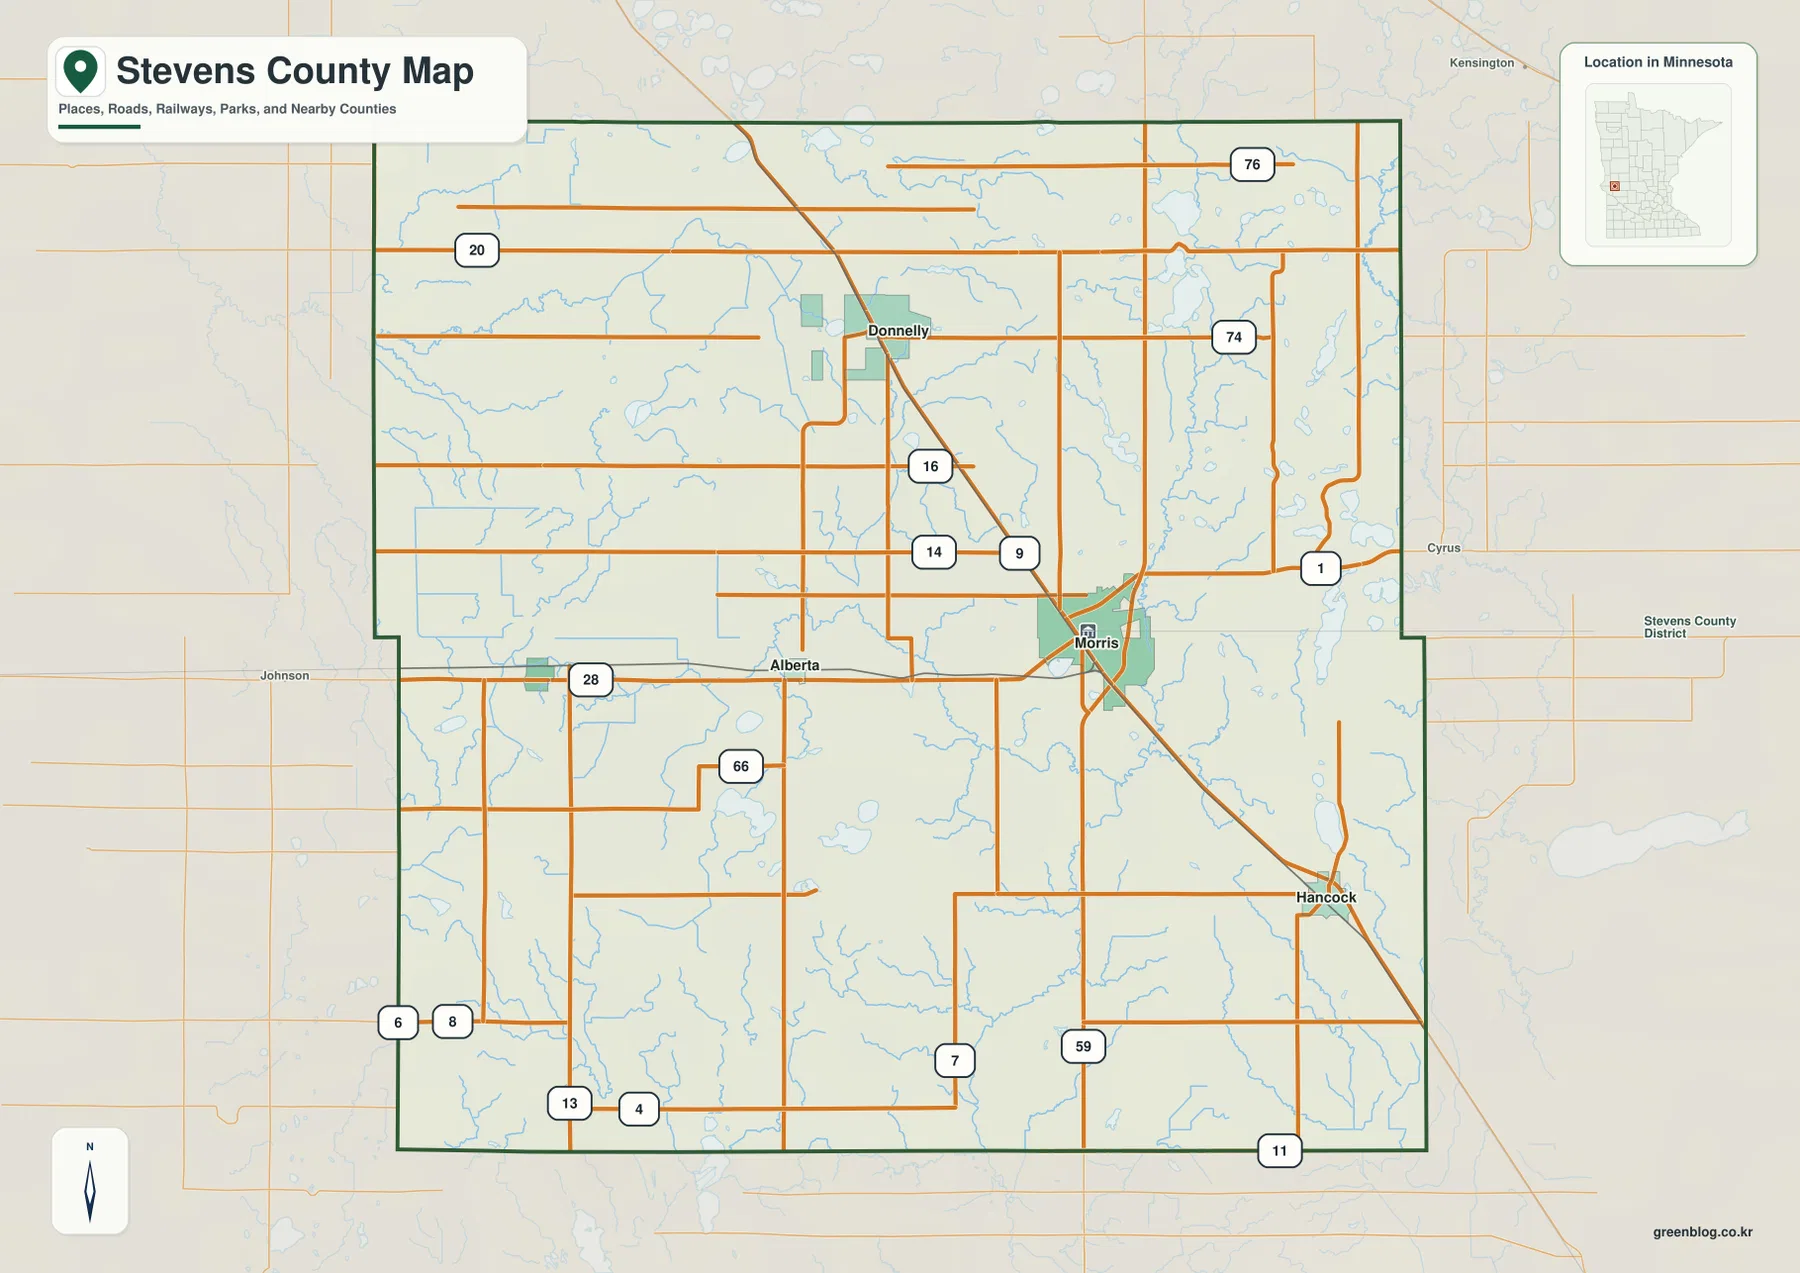
The city-connections map strips away most road detail and focuses on Morris and four nearby towns. It also shows reference values of 5,128 for Morris, 859 for Hancock, 392 for Chokio, 277 for Donnelly, and 93 for Alberta. Those values belong to the source snapshot used for the map and should not be treated as guaranteed current population estimates. The main point is the size contrast between Morris and the smaller communities around it.
The connector lines represent straight-line distance rather than road mileage. Alberta is shown about 7 miles from Morris, Hancock about 8 miles, Donnelly about 9 miles, and Chokio about 13 miles. A real driving route can be longer because roads do not follow those straight lines. For a quick classroom or presentation graphic, however, the distances make it easy to compare which towns are closest to Morris and how far the county reaches toward the west.
Alberta and Chokio are both west of Morris, but Chokio is noticeably farther away. Hancock forms a separate town center in the southeast, while Donnelly occupies the northern part of the settlement pattern. The simplified view works well when the goal is to remember place names before moving to the more detailed road map. It is also useful when a full county map feels crowded with road numbers and smaller labels.
The Pomme de Terre River, western creeks, and scattered lakes
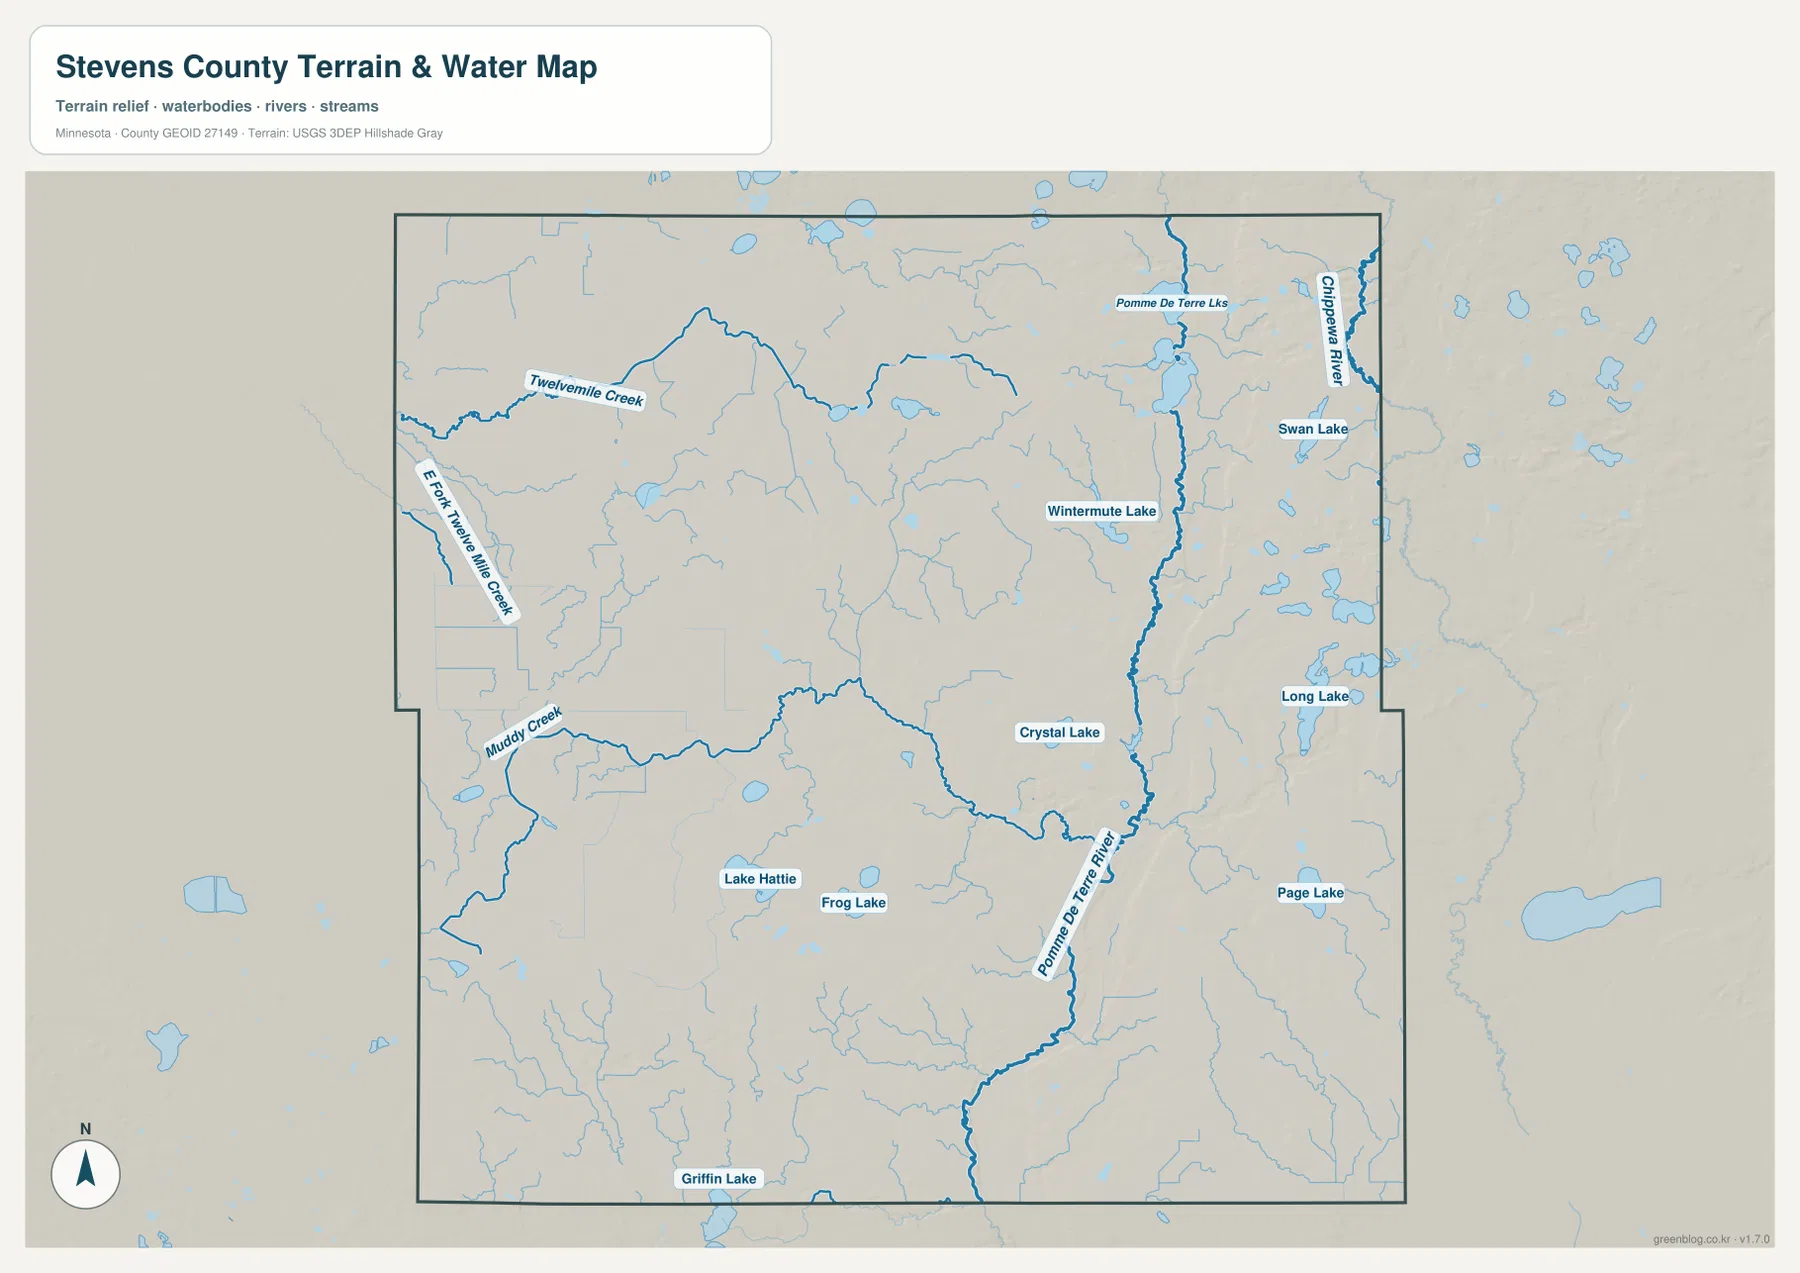
The Pomme de Terre River is the most prominent water feature on the county water map. It enters the northeastern part of Stevens County and continues south through the eastern interior, passing near Wintermute Lake and Crystal Lake. The river lies east of Morris rather than through the center of the city, which is easier to see when the road and water maps are compared. Stevens County’s parks information also lists public access at Pomme De Terre Pool, connecting the mapped river system with an actual local recreation site.
Several lakes are spread across the countryside rather than concentrated in one dense lake district. Swan Lake and Long Lake lie on the eastern side, Page Lake appears farther southeast, and Crystal Lake sits close to the Pomme de Terre River. Lake Hattie and Frog Lake are in the southwest-central area, with Griffin Lake near the southern edge. The Pomme De Terre Lakes in the northeast add another recognizable group of water features.
The western half has smaller named streams, including Twelvemile Creek, Fork Twelvemile Creek, and Muddy Creek. These waterways are less visually dominant than the Pomme de Terre River but help explain drainage across the broad farming landscape. Smaller tributaries branch through the interior as well, and the Chippewa River label appears near the eastern side. This is a geographic reference map, not a flood-risk, water-depth, water-quality, or navigation product.
A 317–387 meter county with higher ground toward the east
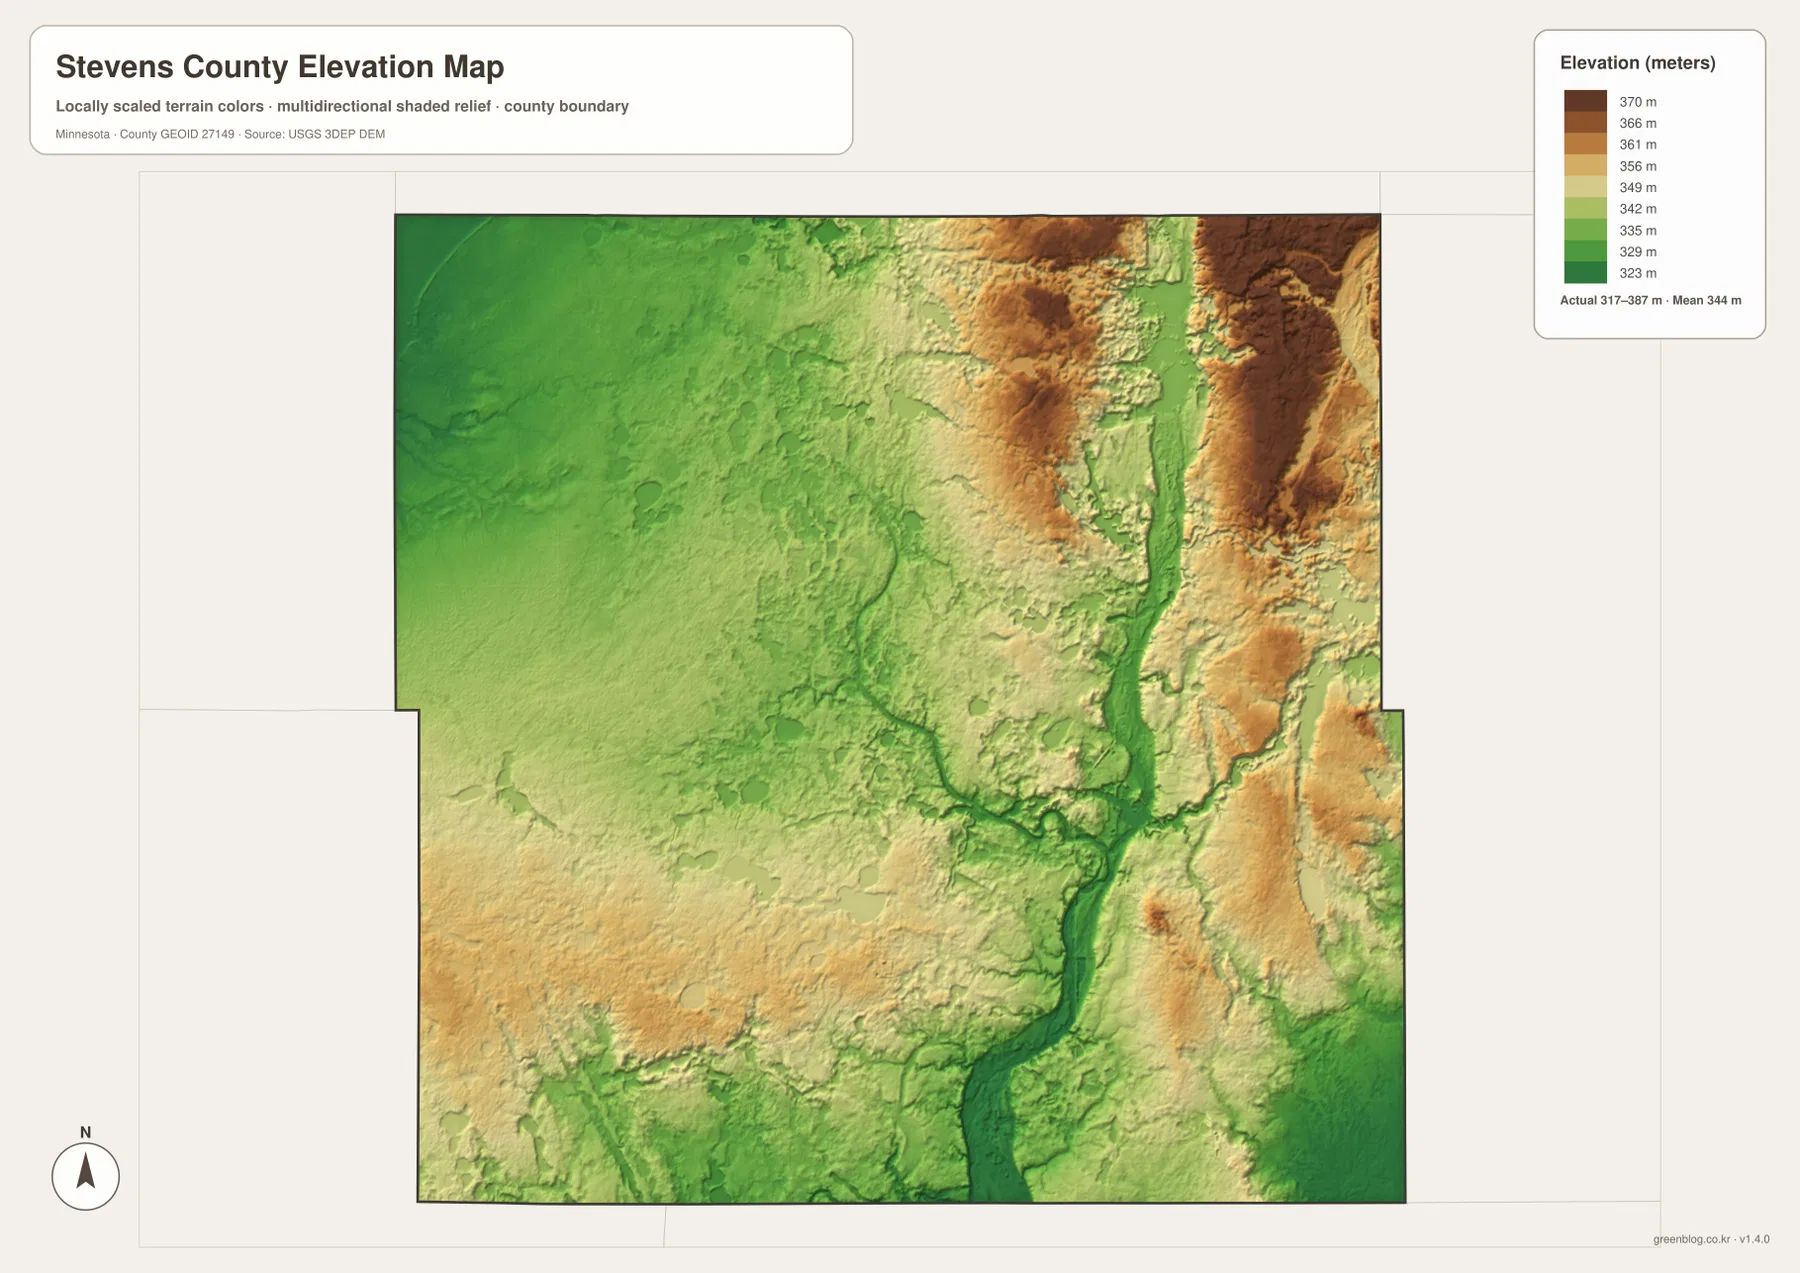
The elevation legend shows a county range of roughly 317 to 387 meters, with a mean near 344 meters. Much of the western half appears lower and gentler, while higher colors become more common toward the east and northeast. Stevens County is not mountainous, but the shaded surface makes clear that the farmland is not perfectly level. The most noticeable contrast occurs where higher eastern ground sits close to lower river valleys.
The Pomme de Terre River is easy to match between the water and elevation maps because a long low corridor follows its course. The green lowland runs from the northeast toward the south and remains visible near Crystal Lake and the central-eastern part of the county. Higher ground rises nearby, especially toward the east and northeast. Comparing the two maps side by side gives a direct visual explanation for the river’s path without requiring technical terrain terminology.
Relief in the west is subtler but still present. Twelvemile Creek and Muddy Creek occupy shallow low areas, and the southwest includes small patches of higher ground. Morris and Alberta sit within this broad, gently rolling agricultural landscape rather than on a completely flat surface. The elevation map is suitable for county-scale comparison, but precise parcel elevations, construction grades, drainage design, or surveying should rely on detailed USGS data or professional measurements.
Choosing the map that matches what you need
Use the county map when roads, town names, and boundaries matter most. It is the easiest version for locating Morris, following U.S. 59, MN 9, and MN 28, and seeing how the smaller towns fit around the county. The city map is better when the goal is simply to compare town spacing because the straight-line connectors remove most of the road detail. Using those two maps together works well for a presentation that starts with settlement locations and then moves into transportation.
The water map is the clearest choice for finding the Pomme de Terre River, Twelvemile Creek, Muddy Creek, and the named lakes. The elevation map adds another layer by showing why the river corridors tend to follow lower ground and why the eastern side looks more varied than the west. For a geography lesson or local reference project, pairing the water and elevation maps is often more informative than using either one alone.
The WebP images in the article are optimized for quick viewing in a browser. The ZIP contains four original high-resolution JPG maps at 3638×2572 pixels each, which are better for printing or zooming into small labels. They work well for education, presentations, personal reference, and general regional description. They are not substitutes for legal boundary records, live navigation, flood mapping, engineering design, or survey-grade elevation data.
Frequently Asked Questions
How far are the smaller towns from Morris?
The city map shows straight-line distances of about 7 miles to Alberta, 8 miles to Hancock, 9 miles to Donnelly, and 13 miles to Chokio. These are not driving distances, so road mileage and travel time can be longer. Use the county map when you need to see the actual highway pattern around Morris.
Where does the Pomme de Terre River run through Stevens County?
The river enters from the northeast and continues generally south through the eastern part of the county, passing near Wintermute Lake and Crystal Lake. On the elevation map, much of the same route appears as a lower green corridor. The water map is useful for location, but it does not provide flood levels, water depth, or navigation guidance.
How much elevation change is shown across the county?
The legend shows roughly 317 to 387 meters, with an average near 344 meters. Broad lower terrain is common in the west, while higher ground becomes more noticeable in the east and northeast. For exact site elevations, engineering, or surveying, use detailed USGS elevation products or professional measurements instead of this county-scale map.
Map File Information
The ZIP contains the original high-resolution JPG versions of the Stevens County boundary map, city map, water map, and elevation map used on this page.
- Included Files: 4 high-resolution JPG maps
Related Maps
Sources and references
- Stevens County official website — county government and local information
- Stevens County Highway Department — county road and transportation information
- Stevens County Parks and Lakes — local lakes and public access information
- USGS National Hydrography — river, stream, and lake reference data
- USGS 3D Elevation Program — elevation and terrain reference data
Green Map creates custom-edited map images using open geographic data sources such as geoBoundaries, Natural Earth, OpenStreetMap, and government open data. These maps are edited visual materials, not raw data files, and are provided for education, documents, presentations, and graphic reference.