UNESCO Institute for Statistics data for 2025 show an exceptionally wide cross-country spread in the modelled completion rate for males at the upper-secondary level. Across 164 reporting countries and territories, the unweighted median was 59.69% and the mean was 56.20%. The first quartile was 29.74% and the third quartile 85.02%. The highest observation was 99.50%, while the lowest was 2.82%, a gap of 96.68 percentage points. The scale of that spread is more informative than any single global-style average.
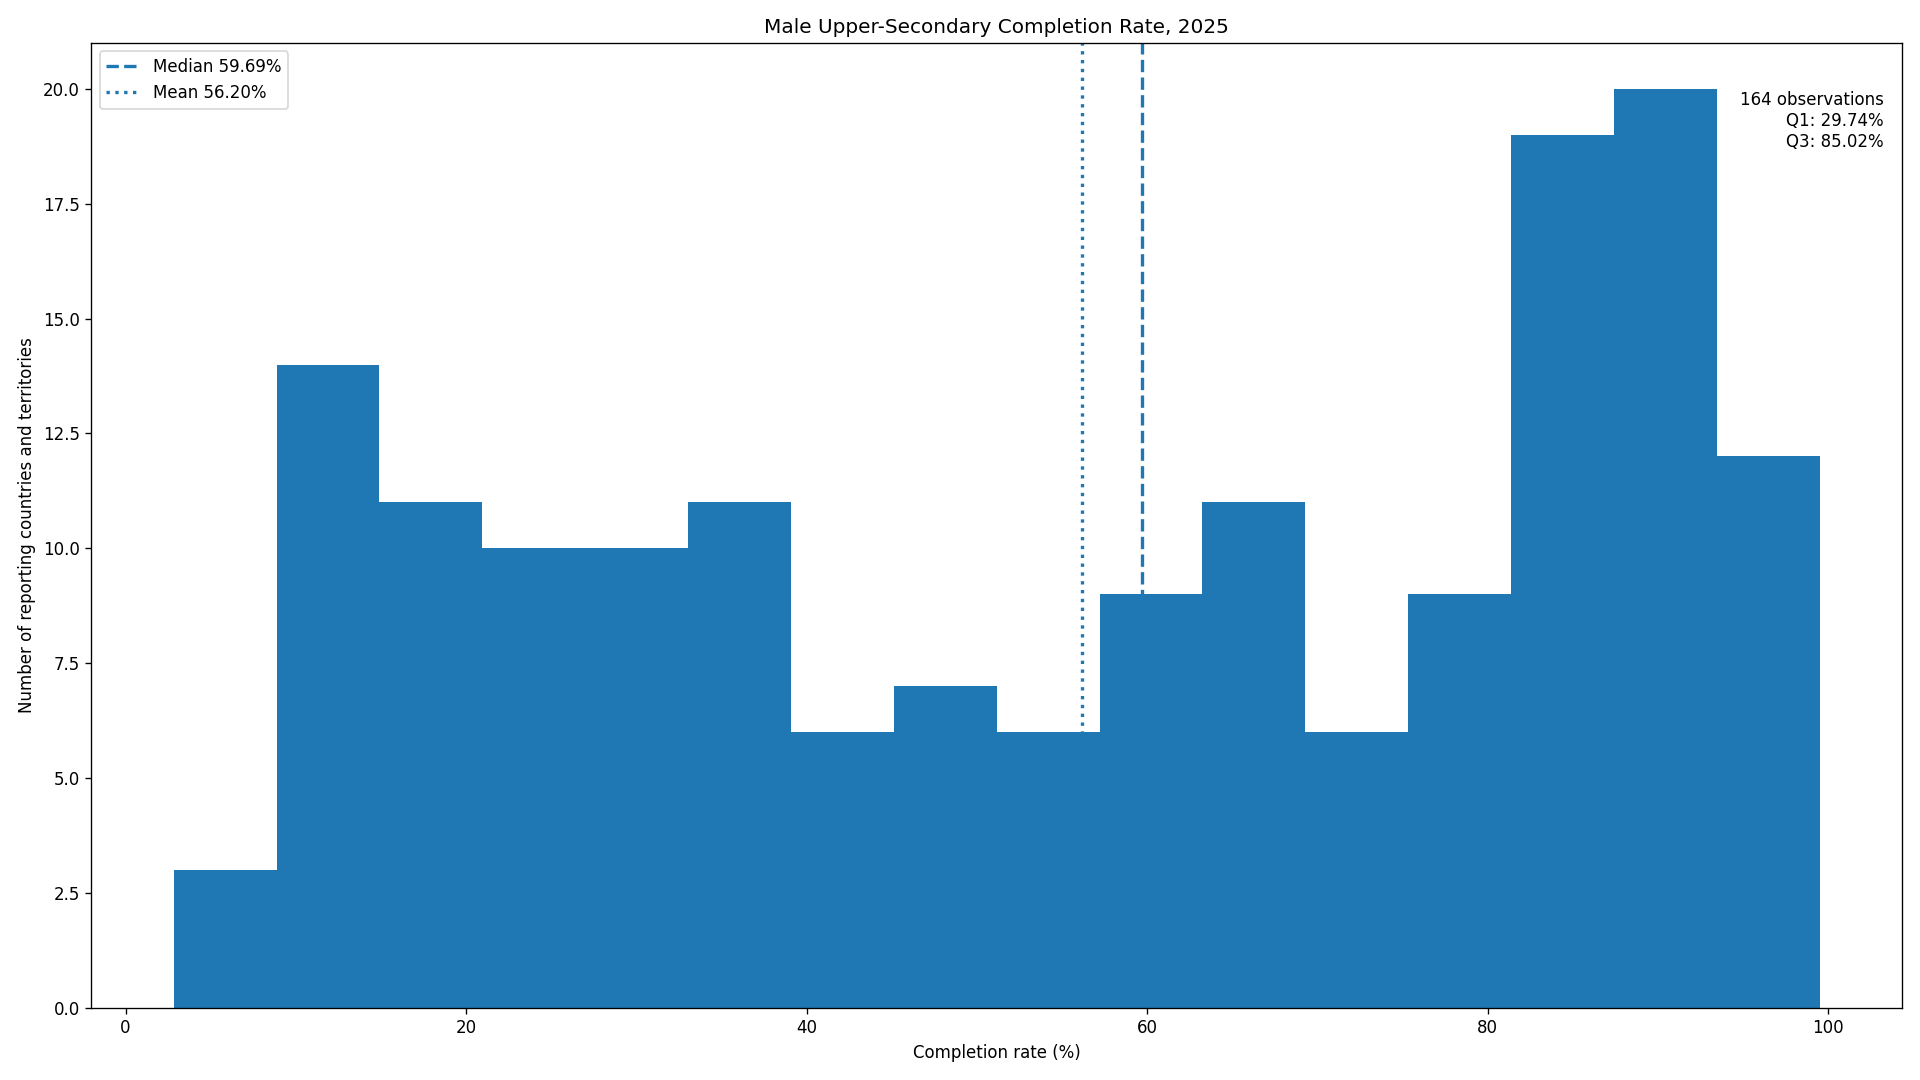
Table of Contents
The indicator measures completion, not current school enrolment
The official series is “Completion rate, upper secondary education, male (modelled data) (%)”. Two parts of that name matter. First, this is a completion rate, not the share of boys currently enrolled in upper-secondary school and not a gross or net enrolment ratio. Second, the values are modelled estimates. A value of 90% therefore describes the estimated level of male completion under the UIS indicator definition; it does not mean that 90% of boys are currently attending school.
The modelled-data label also calls for caution when comparing small differences. UIS uses statistical methods to create internationally comparable estimates from available national information. That makes the series useful for broad comparisons, but a difference of one or two percentage points should not automatically be treated as a precise ranking of education systems. Larger gaps and broad distributional patterns are more robust ways to read the table.
The median across 164 observations was 59.69%
The unweighted mean of the 164 observations was 56.20%, about 3.49 percentage points below the median of 59.69%. The lower mean reflects the long lower tail created by countries with very low completion rates. The first quartile was 29.74% and the third quartile 85.02%, so the middle half of observations alone covered more than 55 percentage points. Even away from the extremes, the cross-country range remained substantial.
By broad intervals, 26 observations were below 20%, 33 were from 20% to under 40%, and 23 were from 40% to under 60%. Another 30 were from 60% to under 80%, while 52 were at 80% or above. Ninety-three observations were at least 50% and 71 were below 50%. At the very high end, 22 were at 90% or above and only six reached at least 95%.
Twenty-two observations were at or above 90%
The highest values included the Republic of Korea at 99.50%, Uzbekistan at 98.84%, Kazakhstan at 98.01%, Croatia at 97.90%, Azerbaijan at 96.91% and Ukraine at 96.25%. Those six were the only observations at or above 95%. Expanding the threshold to 90% brings the count to 22 and adds countries from Central Asia, Eastern and Western Europe, North America and other regions.
A very high completion rate should not be converted into a broader claim about education quality. This series does not directly measure learning outcomes, skills, school resources, affordability, employment results or equity within a country. It answers a narrower but important question: what share of males are estimated to complete upper-secondary education under the UIS methodology. That distinction is especially important when values near the top are separated by only a few percentage points.
Twenty-six observations were below 20%
At the lower end, South Sudan was 2.82%, the Central African Republic 5.94%, Niger 6.54%, Chad 9.61%, Burundi 9.61%, the United Republic of Tanzania 9.81% and Zimbabwe 9.99%. Mozambique was 10.58%, Equatorial Guinea 11.01% and Vanuatu 12.09%. A total of 26 observations were below 20%, illustrating that the lower tail is not produced by only one or two exceptional cases.
These low values should not be assigned to a single cause from this dataset alone. The table contains completion rates, country identifiers and the reference year, but it does not contain explanatory variables such as household income, conflict exposure, school availability, transition rates, fees, distance to school or labour-market conditions. Those factors may matter in reality, but a causal explanation requires additional evidence.
Selected highest and lowest observations in 2025
| Country or territory | Male upper-secondary completion rate |
|---|---|
| Republic of Korea | 99.50% |
| Uzbekistan | 98.84% |
| Kazakhstan | 98.01% |
| Croatia | 97.90% |
| Azerbaijan | 96.91% |
| Ukraine | 96.25% |
| Qatar | 94.94% |
| Turkmenistan | 94.19% |
| South Sudan | 2.82% |
| Central African Republic | 5.94% |
| Niger | 6.54% |
| Chad | 9.61% |
| Burundi | 9.61% |
| United Republic of Tanzania | 9.81% |
| Zimbabwe | 9.99% |
| Mozambique | 10.58% |
The selected table places the eight highest and eight lowest observations side by side. The difference between the maximum and minimum was 96.68 percentage points. The maximum was more than 35 times the minimum, although ratio comparisons become unstable when the denominator is close to zero. Percentage-point differences and the quartile range are therefore more useful for describing the practical size of the gap.
There were 52 observations at 80% or above and 59 below 40%
The distribution is notable because it contains large groups at both ends. Fifty-two observations were at least 80%, but 59 were below 40%. Only 23 fell in the 40% to under 60% band and 30 in the 60% to under 80% band. The data therefore do not form a tight cluster around the overall mean. A substantial high-completion group coexists with a similarly large low-completion group.
Using 50% as a dividing line gives 93 observations at or above the threshold and 71 below it, but 50% is not an official policy target in this analysis. It is simply a convenient descriptive cut. More meaningful assessments would consider national targets, trends over time, female completion rates, gender gaps, income disparities and regional differences within countries.
Geographic clustering is visible, but geography is not an explanation
The country names show visible geographic clustering. Several Central Asian and Eastern European countries appear near the top, along with a number of Western European and North American systems. Many of the very lowest observations are in Sub-Saharan Africa. This is a descriptive spatial pattern in the 2025 values, not proof that region itself causes the difference. Countries within the same broad region can still have very different completion outcomes.
Upper-secondary completion is the cumulative result of progression through earlier schooling, transition into upper-secondary education and persistence to the end of the stage. A deeper analysis could therefore connect this series with lower-secondary completion, out-of-school rates, upper-secondary enrolment and the corresponding female indicator. Those additions can help distinguish where the education pathway is losing students and whether gaps differ by sex.
The 56.20% mean is not a population-weighted world completion rate
The mean reported here is a simple average that gives each of the 164 countries and territories one equal observation. A small country and a very populous country therefore receive the same weight. It would be incorrect to say that 56.20% of all males worldwide completed upper-secondary education based on this calculation. A population-weighted global rate would require relevant male population counts or an official UIS aggregate designed for that purpose.
The median of 59.69% is also a country-level summary, not a global student-level statistic. It identifies the middle of the observed country distribution and is less sensitive to the very low values in the lower tail. Mean and median are useful for describing the shape of the 164 observations, but neither should replace an official regional or world aggregate.
A single 2025 snapshot cannot show improvement or decline
Because the supplied data contain one year, they cannot show whether a country is improving, stagnating or declining. A 70% completion rate could represent a large improvement from earlier years or a deterioration from a previously higher level. Trend analysis requires the same indicator for multiple years, ideally with attention to revisions in the modelled series.
National upper-secondary structures and graduation requirements also differ. UIS standardization makes international comparison possible, but it does not erase every institutional difference between systems. For policy interpretation, the indicator is best used as a common benchmark and then supplemented with national definitions, learning indicators and subgroup data.
Source, coverage and calculation method
The source is the official UNESCO Institute for Statistics Data API, indicator CR.MOD.3.M. The dataset contains 164 country and territory observations for 2025, all expressed as percentages and identified as modelled data. Missing catalogue units were not treated as zero. The mean, median, quartiles, interval counts and rankings in this article were calculated directly from those 164 observations. The official series can be accessed through the UNESCO UIS Data API.
When reusing the figures, four qualifiers should stay attached to the numbers: male, upper-secondary education, completion rate and modelled data, with 2025 as the reference year. A female series, a total-sex series, an enrolment indicator or an observed-only measure would answer a different question. Keeping the indicator identity intact prevents comparisons that look numerically similar but are conceptually different.
Frequently Asked Questions
Is this the share of boys currently enrolled in upper-secondary school?
No. It is the UNESCO UIS modelled male completion rate for upper-secondary education. Enrolment rates measure a different concept.
What was the median across the 164 observations in 2025?
The median was 59.69% and the unweighted mean was 56.20%. Neither figure is a student-population-weighted world completion rate.
What does “modelled data” mean for interpretation?
It means UIS uses statistical methods to produce comparable estimates from available national information. Broad gaps are more informative than treating small percentage-point differences as precise rankings.
Related Articles
Green Map creates custom-edited map images using open geographic data sources such as geoBoundaries, Natural Earth, OpenStreetMap, and government open data. These maps are edited visual materials, not raw data files, and are provided for education, documents, presentations, and graphic reference.