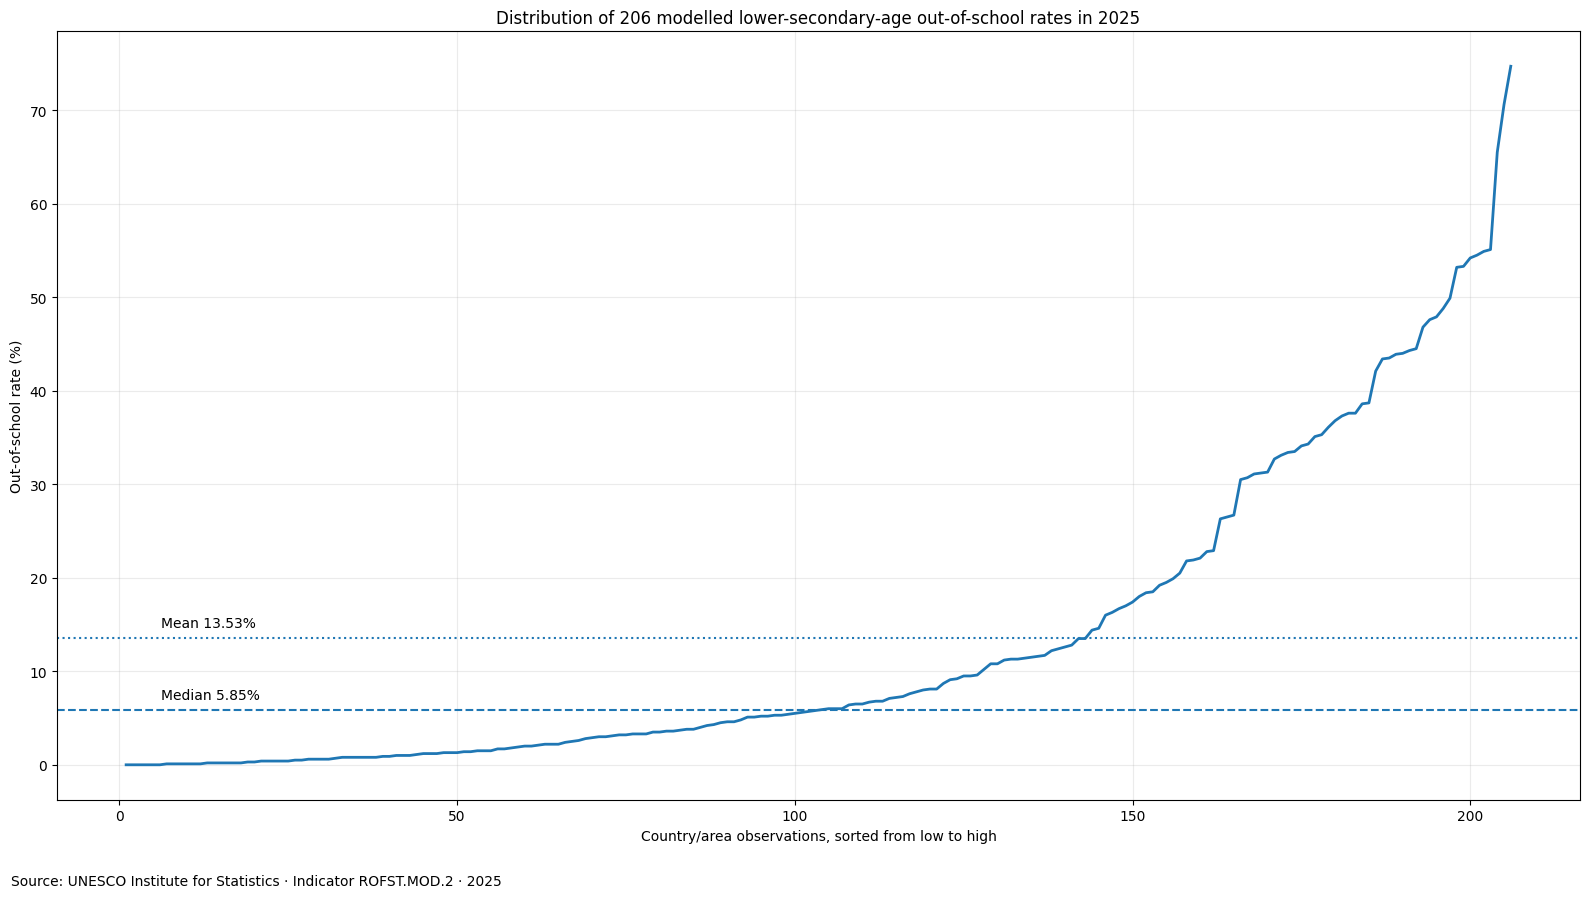
Modelled out-of-school rates for adolescents of official lower-secondary-school age vary sharply across the 206 country and area observations published for 2025. The median is 5.85%, while the unweighted mean is 13.53%. Afghanistan has the highest value at 74.7%, followed by Niger at 70.6% and Equatorial Guinea at 65.5%. The gap between the median and the mean immediately shows that the distribution is pulled upward by a substantial high-rate tail.
The series is UNESCO Institute for Statistics indicator ROFST.MOD.2: the out-of-school rate for adolescents of lower-secondary-school age, both sexes, reported as modelled data. It measures the share of the relevant official age group that is outside school participation under the UIS definition. It is not a learning-score indicator, a completion rate, a daily attendance rate, or a direct measure of school quality. Those distinctions matter because the same country can perform differently on participation, completion, and learning outcomes.
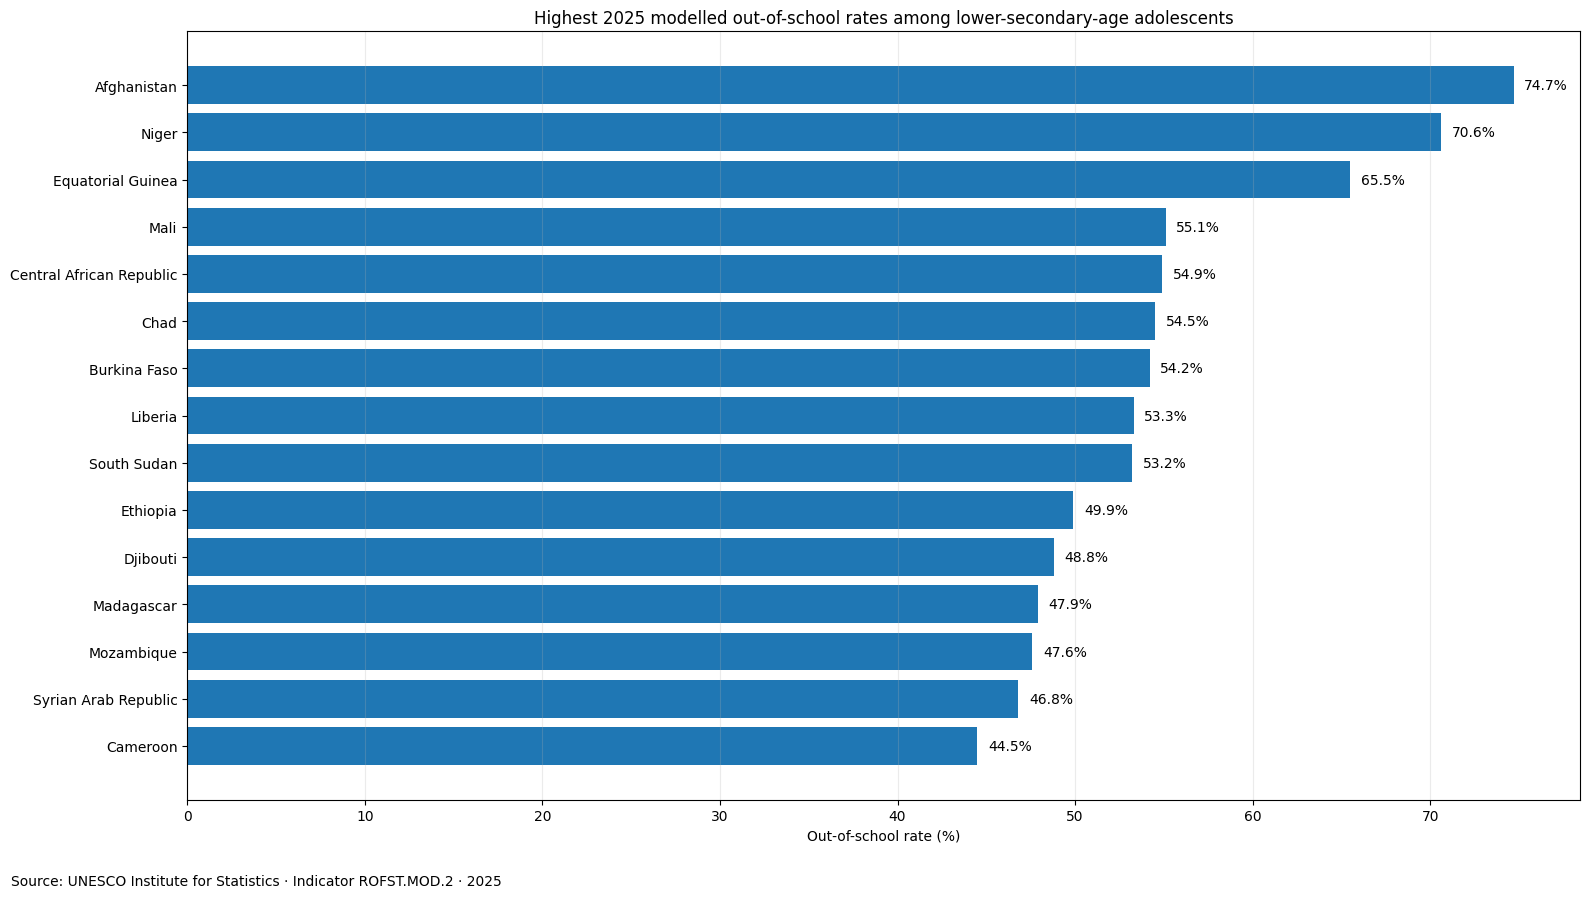
Table of Contents
The median is 5.85%, but the distribution has a long upper tail
Sorting all 206 observations gives a first quartile of 1.42%, a median of 5.85%, and a third quartile of 19.43%. In other words, the middle half of the reported values spans roughly 1.42% to 19.43%. The mean, at 13.53%, is 7.68 percentage points above the median because a group of much larger observations raises the arithmetic average.
Threshold counts make the spread easier to see. 50 observations are at or above 20%, 41 are at or above 30%, 21 reach at least 40%, and 9 are at or above 50%. At the other end, 127 observations are below 10% and 92 are below 5%. A single average therefore hides two very different parts of the distribution: a large low-rate group and a smaller but substantial group with very high estimated rates.
The highest reported estimates reach 50% to 75%
Afghanistan records 74.7%, Niger 70.6%, and Equatorial Guinea 65.5%. Mali, the Central African Republic, Chad, Burkina Faso, Liberia, and South Sudan are also above 50%. These percentages indicate a very high modelled share of adolescents of the relevant official age who are out of school. They do not, by themselves, identify why participation is low or tell us which specific barrier is most important in each country.
| Rank | Country or area | 2025 rate |
|---|---|---|
| 1 | Afghanistan | 74.7% |
| 2 | Niger | 70.6% |
| 3 | Equatorial Guinea | 65.5% |
| 4 | Mali | 55.1% |
| 5 | Central African Republic | 54.9% |
| 6 | Chad | 54.5% |
| 7 | Burkina Faso | 54.2% |
| 8 | Liberia | 53.3% |
| 9 | South Sudan | 53.2% |
| 10 | Ethiopia | 49.9% |
| 11 | Djibouti | 48.8% |
| 12 | Madagascar | 47.9% |
| 13 | Mozambique | 47.6% |
| 14 | Syrian Arab Republic | 46.8% |
| 15 | Cameroon | 44.5% |
Many of the highest values are in African countries, but the geographic clustering should be treated as description rather than explanation. School participation can be affected by conflict, displacement, household resources, school supply, travel distance, institutional rules, gender inequalities, and other conditions. The ROFST.MOD.2 values show the level of the outcome, not a causal decomposition. Country-level diagnosis requires additional administrative, survey, and historical evidence.
Official zero values are not the same as missing observations
The dataset contains 6 official values of 0.0%: Croatia, Ireland, Japan, Georgia, Sint Maarten (Dutch part), and Portugal. These zeros were supplied as values; they were not created by filling missing records. That difference is important because a zero says the modelled rate is reported as 0.0%, while an absent catalogue unit says no 2025 observation was supplied in this extract.
| Low-end position | Country or area | 2025 rate |
|---|---|---|
| 1 | Ireland | 0.0% |
| 2 | Georgia | 0.0% |
| 3 | Japan | 0.0% |
| 4 | Croatia | 0.0% |
| 5 | Sint Maarten (Dutch part) | 0.0% |
| 6 | Portugal | 0.0% |
| 7 | France | 0.1% |
| 8 | Lithuania | 0.1% |
| 9 | Brunei Darussalam | 0.1% |
| 10 | Montenegro | 0.1% |
There are 40 observations below 1%. Brunei Darussalam, the Republic of Moldova, Lithuania, Saudi Arabia, and France are each at 0.1%, while several others fall between 0.2% and 0.9%. Low out-of-school rates are consistent with broad school participation for the relevant age group, but they are not proof of high learning achievement, equal opportunity, strong attendance, or high teaching quality. Participation is only one dimension of an education system.
Out-of-school rate is not the same as dropout or completion
The out-of-school rate focuses on whether adolescents in the official age range for lower secondary education are connected to schooling. A completion rate asks whether a cohort completed a level, while a dropout measure focuses on leaving education after participation. The out-of-school population can include adolescents who never entered school as well as those who left, so the concept is broader than dropout alone.
UIS defines the out-of-school rate for an official school-age group in terms of people in that age range who are not enrolled in primary, secondary, or higher levels of education. This means the measure is age-based rather than limited to enrollment in the grade normally associated with that age. An adolescent who is still in primary school or has advanced beyond lower secondary can still be counted as in school. For that reason, ROFST.MOD.2 should not be treated as simply the inverse of a lower-secondary-only gross enrolment ratio.
Why the modelled-data label matters
The indicator name explicitly says “modelled data.” UIS uses modelling to help produce consistent time series where direct observations are incomplete or irregular across countries and years. Modelled estimates are therefore not equivalent to a single survey or administrative count conducted in 2025. Their value is comparability and broader coverage, but the modelling step needs to remain visible when the numbers are described.
Modelled estimates can also be revised as new country evidence becomes available or methods are updated. Small decimal differences should not be turned into precise league-table claims. A contrast between 5% and 50% is substantively clearer than a difference between 5.8% and 6.0%. For comparisons near the same level, national sources and uncertainty around the underlying evidence deserve more attention.
A single 2025 snapshot cannot show improvement or deterioration
Every row in this dataset refers to 2025, which is useful because it avoids mixing countries from different reference years. However, a one-year cross-section cannot tell whether a country is improving. Afghanistan’s 74.7% may be higher or lower than its earlier modelled values; that direction is not contained in the 2025 row alone. Trend analysis requires the same indicator across multiple years, with attention to any revisions in the modelled series.
The 13.53% mean is also not a population-weighted global out-of-school rate. Each of the 206 country and area observations receives the same weight in that calculation regardless of the size of its lower-secondary-age population. A global population share would require age-group population weights or an official UIS aggregate. The unweighted mean is useful for describing this set of observations, not for estimating the share of all adolescents worldwide who are out of school.
What the 2025 distribution says most clearly
The strongest result is the breadth of the cross-country spread. The median is 5.85%, yet the third quartile is 19.43% and the maximum is 74.7%. At the same time, 127 observations are below 10%. Countries and areas therefore occupy very different positions on school participation even when the age group, sex coverage, reference year, and indicator are held constant.
Four qualifiers should stay attached to any reused figure from this series: 2025, lower-secondary-school age, both sexes, and modelled data. Changing the age group, using male or female series, substituting an observed administrative series, or switching to completion or enrolment produces a different indicator. Keeping that identity intact is especially important when several UIS education metrics have similar percentage scales.
Source and calculation method
The country and area values come from the official UNESCO Institute for Statistics 2025 series ROFST.MOD.2. The supplied dataset contains 206 reported observations in percent and no missing values within those rows. The mean, median, quartiles, rankings, and threshold counts above were calculated directly from those 206 values. Official zeros remain zero; catalogue units not reported in the extract are not converted to zero.
The highest and lowest tables are simple rankings within the reported 2025 observations. They should not be read as rankings of overall education-system quality, policy effectiveness, or learning outcomes. Their purpose is to show the scale and distribution of school-participation differences in this specific age group.
Frequently Asked Questions
What does ROFST.MOD.2 measure?
It is the modelled percentage of adolescents of official lower-secondary-school age who are out of school, for both sexes combined.
What is the median across the 206 observations in 2025?
The median is 5.85% and the unweighted mean is 13.53%. High-rate observations pull the mean upward.
Does a value of 0.0% mean the data are missing?
No. The dataset contains 6 official 0.0% values. Unreported catalogue units are a different case and should remain missing.
Can the 2025 snapshot show whether a country is improving?
No. Improvement or deterioration requires multiple years of the same ROFST.MOD.2 modelled series.
Related Articles
Green Map creates custom-edited map images using open geographic data sources such as geoBoundaries, Natural Earth, OpenStreetMap, and government open data. These maps are edited visual materials, not raw data files, and are provided for education, documents, presentations, and graphic reference.