UNESCO Institute for Statistics reports a 2024 indicator describing the female percentage of enrolment in public institutions at the upper-secondary level. The available file contains 82 country and territory observations. Most values sit close to an even sex composition, but the complete span is wide enough to show meaningful variation: the lowest observation is 35.75% and the highest is 59.13%.
A useful way to read this dataset is not to treat a high percentage as automatically “better.” The indicator describes composition. A value near 50% means female and male enrolment in the covered public upper-secondary institutions is close to balanced, while values farther from 50% indicate a stronger tilt in one direction. It does not measure the share of girls who attend school, the upper-secondary enrolment rate, or educational quality.
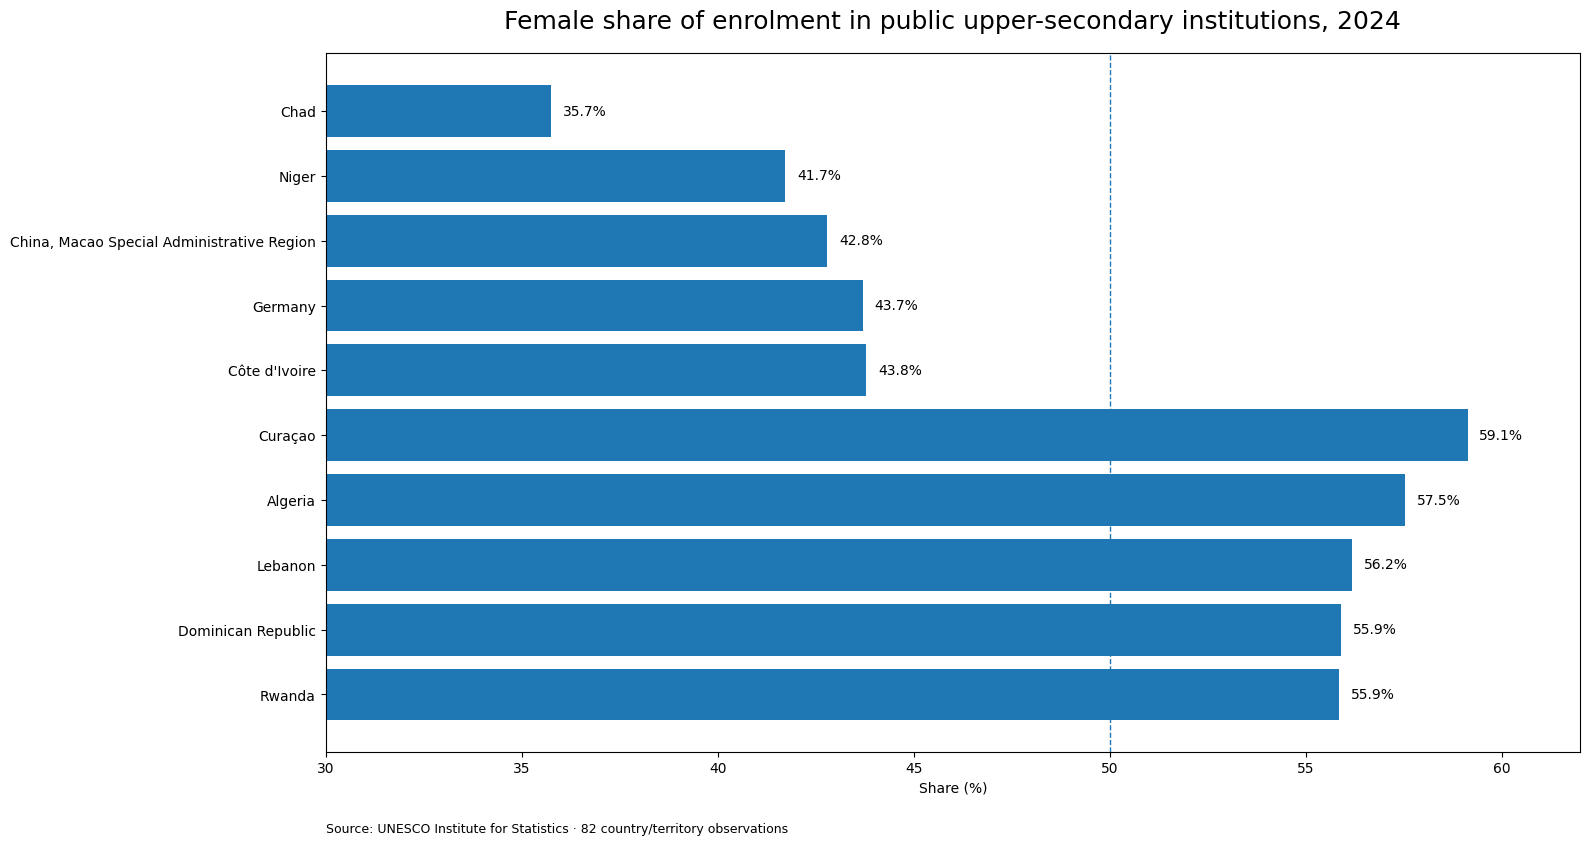
Table of Contents
What the 2024 indicator measures
The official series is titled “Percentage of enrolment in upper secondary education in public institutions, female (%).” In practical terms, it describes the female share of students counted in public upper-secondary education. If the value is 50%, female students account for roughly half of the reported enrolment in that category. A value above 50% indicates a female majority in the composition; a value below 50% indicates a male majority.
That distinction matters because this is an institution-type indicator, not a general participation rate. A country can have a female share below 50% in public upper-secondary institutions while showing a different pattern across all upper-secondary education if private institutions enroll a substantial number of students. The series therefore answers a narrow but useful question about who is enrolled in the public sector at this level.
The center of the distribution is close to parity
Across the 82 observations, the unweighted mean is 49.30% and the median is 49.00%. Their proximity shows that the center of the observed distribution is just below 50%. The first quartile is 47.34% and the third quartile is 50.97%, so the middle half of the reported countries and territories lies within a band only 3.63 percentage points wide.
Thirty observations are at or above 50%, while 52 are below 50%. That count suggests that a modest male majority is more common among the reported values, but it should not be exaggerated. The median is only about one percentage point below parity, and many observations are tightly clustered around the midpoint. The dataset is much more concentrated near 50% than the overall minimum-to-maximum range alone would imply.
The highest and lowest reported observations
Curaçao records the highest value in the file at 59.13%. It is followed by Algeria at 57.55%, Lebanon at 56.18%, the Dominican Republic at 55.91%, and Rwanda at 55.86%. At the other end, Chad is lowest at 35.75%, followed by Niger at 41.73%, Macao SAR at 42.80%, Germany at 43.70%, and Côte d’Ivoire at 43.80%.
| Country or territory | Female share in 2024 |
|---|---|
| Curaçao | 59.13% |
| Algeria | 57.55% |
| Lebanon | 56.18% |
| Dominican Republic | 55.91% |
| Rwanda | 55.86% |
| Chad | 35.75% |
| Niger | 41.73% |
| China, Macao Special Administrative Region | 42.80% |
| Germany | 43.70% |
| Côte d’Ivoire | 43.80% |
These endpoints do not form a simple regional pattern. Countries and territories from Africa, Europe, the Middle East, the Caribbean, and East Asia appear among the extremes. That makes it risky to turn the ranking into a broad claim about continents or income groups. Institutional structure, the public-private split, programme choice, student mobility, and national reporting systems can all affect the composition observed in public upper-secondary education.
Distance from 50% is more informative than rank alone
For a compositional indicator like this one, a ranking can hide an important symmetry. A country at 49% and another at 51% sit on opposite sides of the midpoint, but both are only one percentage point away from an even female-male split. By contrast, 35.75% and 59.13% are much farther from parity even though one is at the bottom and the other at the top of the ranking.
Looking at absolute distance from 50% therefore adds context. The middle 50% of observations, from 47.34% to 50.97%, stays within a relatively narrow band. This suggests that the typical reported country or territory is not dramatically skewed by sex within public upper-secondary enrolment. A small group of more distant observations creates much of the visible spread.
Coverage is incomplete, and missing does not mean zero
The 2024 file contains 82 national or territorial observations. Many countries do not appear in the supplied data. Those absences are missing observations for this series and year; they are not zero values. They should not be placed at the bottom of a ranking or interpreted as evidence that female students are absent from public upper-secondary education.
Coverage also limits what the mean can represent. The 49.30% average is the simple average of the 82 observed values, not a student-weighted world average. A small territory and a populous country each contribute one observation to that calculation. Estimating a global female share would require enrolment counts or other weights for all relevant countries, along with a clear treatment of missing data.
What can and cannot be inferred from the series
The series is well suited to describing the sex composition of public upper-secondary enrolment and to identifying observations that are unusually far from 50%. It can support comparisons of the reported countries, especially when the median and quartiles are shown alongside the extremes. It cannot, on its own, tell us whether girls have equal access to upper-secondary education, whether completion rates are equitable, or whether students receive comparable learning opportunities.
A single-year snapshot also cannot establish a trend. A country at 47% in 2024 may have moved toward or away from parity, but that requires earlier observations using the same definition. Likewise, an extreme value does not identify its cause. Policy, demographic structure, school type, programme availability, or reporting practices would need separate evidence before any causal explanation is made.
Useful companion indicators
For a fuller picture, this measure can be paired with the overall upper-secondary enrolment rate, the public-versus-private enrolment share, the corresponding male series, completion rates, and educational attainment. Those indicators answer different questions. Combining them helps separate the composition of public institutions from access to education and from outcomes after students enter school.
The main message from the 2024 observations is therefore straightforward: the center of the distribution is close to an even female-male split, but a limited number of countries and territories sit substantially farther from 50%. Reading the indicator as a composition measure, rather than a performance score, keeps the comparison accurate and avoids treating either a high or a low percentage as inherently desirable.
Frequently Asked Questions
What does 50% mean in this indicator?
It means female students make up about half of the reported enrolment in public upper-secondary institutions. Above 50% indicates a female majority; below 50% indicates a male majority.
Which observations are highest and lowest in 2024?
Among the 82 reported observations, Curaçao is highest at 59.13% and Chad is lowest at 35.75%.
Should countries missing from the file be treated as 0%?
No. They are unreported observations for this series and year, not zero values, and should not be inserted into rankings or averages as zero.
Related Articles
Green Map creates custom-edited map images using open geographic data sources such as geoBoundaries, Natural Earth, OpenStreetMap, and government open data. These maps are edited visual materials, not raw data files, and are provided for education, documents, presentations, and graphic reference.