UNESCO Institute for Statistics data for 2024 show a tightly clustered distribution in the public-institution share of female early childhood enrolment. Across 81 reporting countries and territories, the unweighted mean was 48.52% and the median was 48.73%. Sixty-two observations fell between 48% and 52%. The most important point is the denominator: this indicator does not measure the female share of pupils inside public early childhood institutions. It measures the percentage of female early childhood enrolment that is in public institutions.
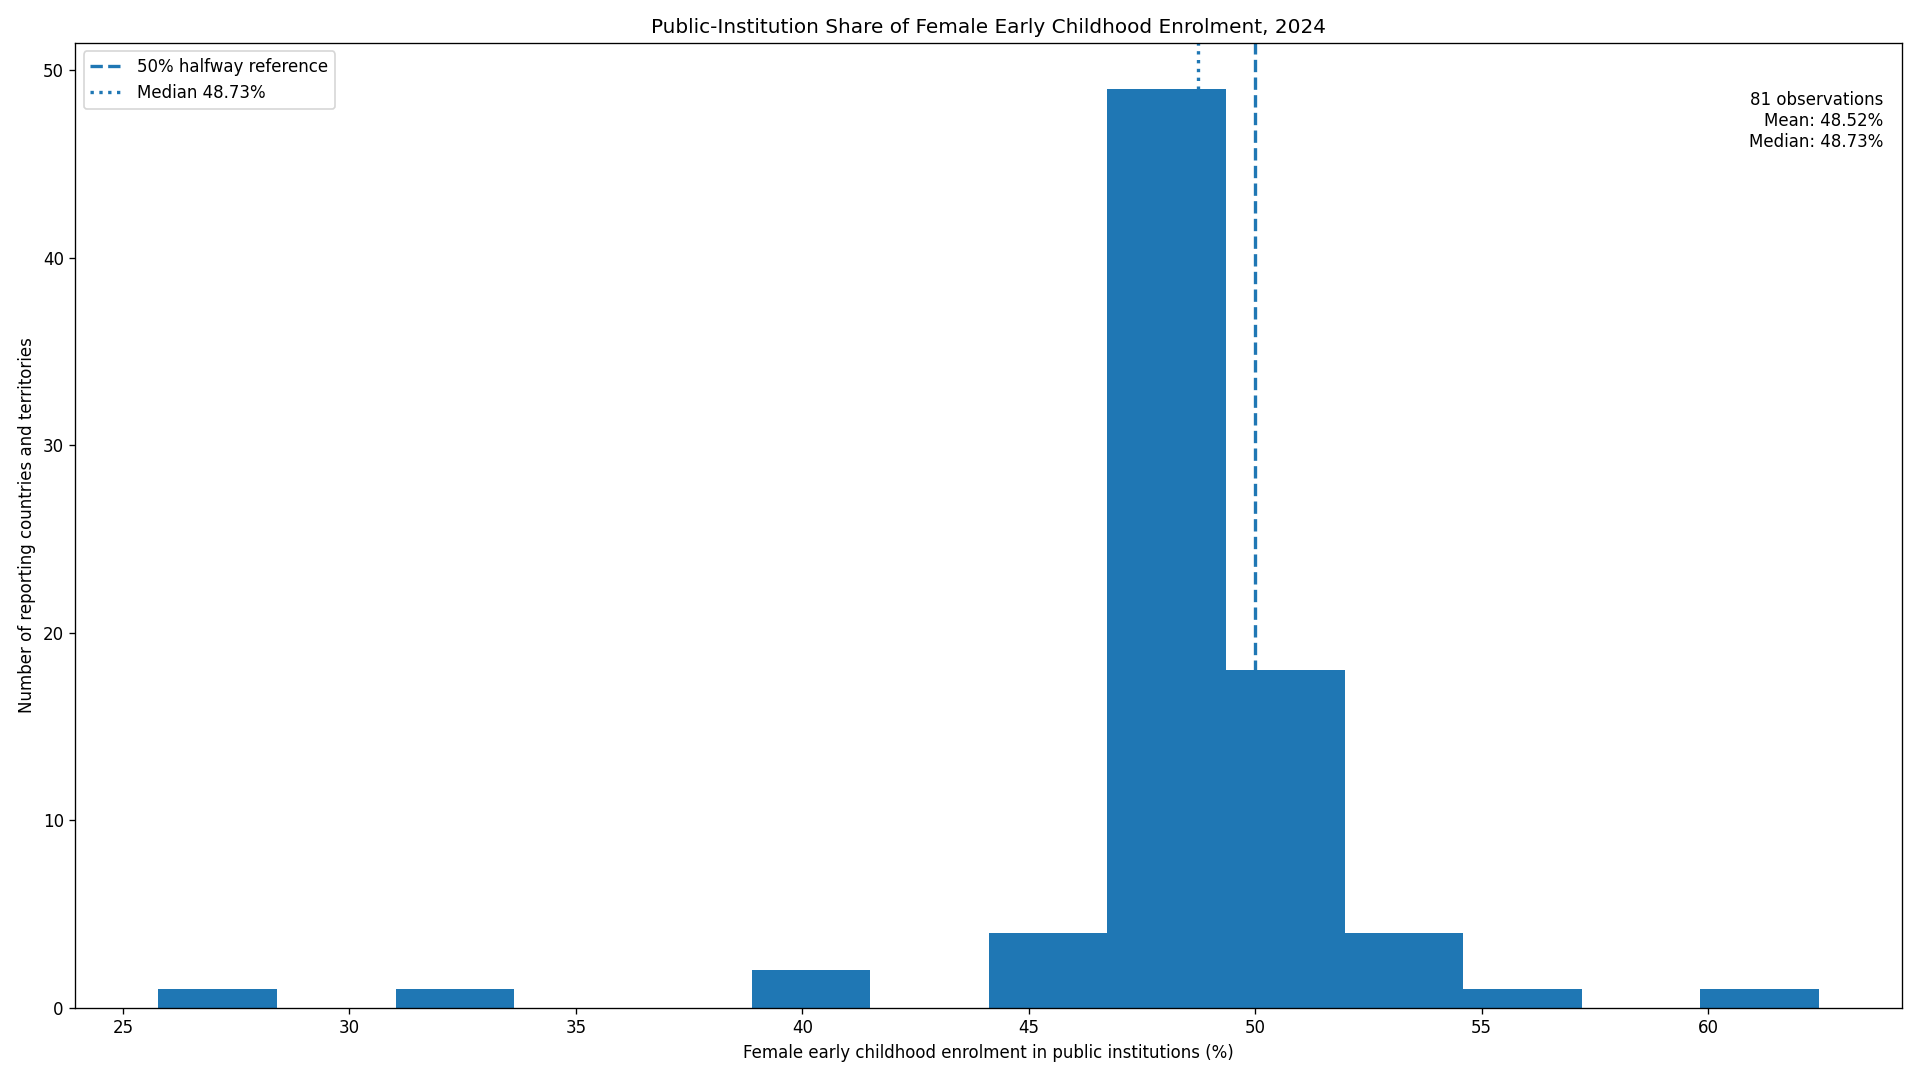
Table of Contents
The denominator is all female early childhood enrolment
The official indicator is “Percentage of enrolment in early childhood education programmes in public institutions, female (%)”. In practical terms, a value of 60% means that about 60% of female enrolment in early childhood education is recorded in public institutions. A value of 40% means public institutions account for about 40% of female enrolment. It does not mean that females are 60% or 40% of all children enrolled in public early childhood institutions.
This distinction changes how the numbers should be interpreted. The 50% line is not a gender-parity threshold. It is simply the point at which half of female early childhood enrolment is in public institutions. A value below 50% cannot by itself show weak female participation, and a value above 50% cannot by itself show better access or quality. The indicator is primarily about the institutional distribution of female enrolment.
Most 2024 observations were concentrated near 50%
The 81 reporting units had an unweighted mean of 48.52% and a median of 48.73%. The first quartile was 48.21% and the third quartile was 49.57%. A total of 62 observations, or about 76.5% of the sample, were between 48% and 52%. That narrow concentration is a stronger feature of the dataset than the simple ordering of countries.
67 observations were below 50%, while 14 were at or above 50%. Those counts should not be interpreted as a verdict on public versus private education. Early childhood systems differ in the way institutions are funded, owned, regulated, and classified. Two countries with the same percentage may have very different overall enrolment levels, fee structures, or public financing arrangements.
The highest public-institution shares
The Cook Islands recorded the highest value at 62.45%. The United Arab Emirates followed at 56.55%, with Niue at 53.73%, Senegal at 53.21%, and Qatar at 52.58%. These figures indicate that public institutions accounted for a relatively large share of female early childhood enrolment in those reporting units. They do not directly measure the quality of programmes, the affordability of care, or the overall proportion of girls enrolled in early childhood education.
The high-value group is geographically mixed and includes small island jurisdictions as well as countries in the Middle East and Africa. That makes a simple regional explanation difficult. It also illustrates why an unweighted country-level distribution is not the same as a global student-weighted measure: a small jurisdiction and a large country each contribute one observation to the mean used here.
The lowest observations were much farther from the centre
Hong Kong SAR, China recorded the lowest value at 25.78%. Maldives was at 33.61%, Uzbekistan at 41.12%, Cayman Islands at 41.27%, and South Sudan at 44.16%. These values show that public institutions represented a smaller share of female early childhood enrolment. They do not identify why the public share was lower. The explanation could involve the availability of private providers, national classification practices, public provision, or other institutional features not contained in this indicator.
Outliers such as Hong Kong SAR, China and Maldives are useful starting points for deeper research, but one year is not enough to establish a structural trend. A time series for the same indicator, combined with data on public and private institutions, enrolment rates, fees, and public spending, would be needed to distinguish a persistent system feature from a temporary movement.
Selected 2024 observations
| Country or territory | Female early childhood enrolment in public institutions |
|---|---|
| Cook Islands | 62.45% |
| United Arab Emirates | 56.55% |
| Senegal | 53.21% |
| Qatar | 52.58% |
| Belize | 50.84% |
| Brazil | 48.58% |
| Switzerland | 48.67% |
| Republic of Korea | 48.13% |
| China | 47.57% |
| Uzbekistan | 41.12% |
| Maldives | 33.61% |
| Hong Kong SAR, China | 25.78% |
The table samples the upper end, the dense middle, and the lower end of the distribution rather than presenting a full ranking. The Republic of Korea, at 48.13%, was close to the overall median of 48.73%. The broader pattern is that many reporting units cluster near 50%, while a small number of higher and lower observations widen the range.
Why “female” does not make this a gender-composition indicator
The word “female” identifies the population whose enrolment is being divided by institution type. It does not describe the sex composition of public institutions. To study gender composition, analysts would need either the male version of the same indicator or enrolment counts that allow females and males to be compared with a common denominator. This indicator alone cannot support a statement that public early childhood institutions have more girls than boys or more boys than girls.
The indicator also cannot show whether a system is more supportive of girls. Access, participation, affordability, geographic coverage, staffing, learning conditions, and outcomes are separate questions. A high public-institution share can coexist with either high or low overall early childhood participation. The number here is best treated as a measure of where female enrolment is located across institutional types.
What additional data would improve interpretation
A first useful comparison is the corresponding male public-institution share. If female and male percentages diverge, that can identify a possible difference in institutional distribution by sex. A second comparison is the overall early childhood enrolment or participation rate, which helps separate the institutional mix from the level of access. A third layer is the number of public and private providers, along with fees, class size, and government financing.
A time dimension would add another important perspective. With five or ten years of consistent observations, it would be possible to ask whether the public share is rising, falling, or stable. A single 2024 observation is a snapshot. It can describe cross-country differences in that year, but it should not be used on its own to infer the direction of policy or a long-term shift in early childhood provision.
Coverage and missing observations
The comparison includes only the 81 countries and territories with a reported 2024 value in the supplied UIS series. Catalogue units without a 2024 observation were not converted to zero. Missing data therefore mean “not reported in this extract,” not “no female enrolment in public institutions.” This is especially important when interpreting the mean, median, and country counts.
The mean is also not weighted by the number of children enrolled. Each reporting country or territory contributes one value. Calculating a global student-weighted public-institution share would require the underlying female enrolment counts for every reporting unit. The statistics used here are distribution summaries designed to compare the positions of national and territorial observations.
Source and calculation notes
The source is the UNESCO Institute for Statistics official education database, indicator ETOIP.0.PU.F. The 2024 values were used as published, without imputation or zero-filling. The mean, median, quartiles, and counts within selected ranges were calculated directly from the 81 observations. Indicator metadata and education series can be explored through the UNESCO UIS Data Browser.
Frequently Asked Questions
What does 50% mean in this indicator?
It means half of female early childhood enrolment is in public institutions. It does not mean females are half of all children enrolled in public institutions.
What was the median across the 2024 observations?
The median across 81 reporting countries and territories was 48.73%. The unweighted mean was 48.52%, not a global student-weighted share.
Does a low value mean low female participation in early childhood education?
No. It only means public institutions account for a smaller share of female early childhood enrolment. Overall participation requires a separate enrolment or participation-rate indicator.
Related Articles
Green Map creates custom-edited map images using open geographic data sources such as geoBoundaries, Natural Earth, OpenStreetMap, and government open data. These maps are edited visual materials, not raw data files, and are provided for education, documents, presentations, and graphic reference.