Hawaii reported the largest 2024 state value for distillate fuel oil used for electricity generation in the U.S. Electric Power Sector Non-CHP. Its value was 2,510.008 thousand barrels, followed by Alaska at 895.764 and Maryland at 458.723. The 50 state observations sum to 9,254.344 thousand barrels, so Hawaii alone represents 27.12% of the total. This comparison keeps the EIA dimensions fixed at fueltypeid DFO, sectorid 90, the field consumption-for-eg, annual frequency, and year 2024.
Those dimensions make the scope narrower than the broad phrase “oil use in the power sector” might suggest. The series does not measure all distillate fuel oil consumed in a state, all petroleum used by every electricity producer, or electricity output itself. It measures a physical quantity of distillate fuel oil assigned to electricity generation within the Electric Power Sector Non-CHP category. EIA reports state distillate fuel oil physical consumption in thousand barrels, so the figures should not be read as megawatthours, MMBtu, costs, emissions, or percentages of a state electricity mix.
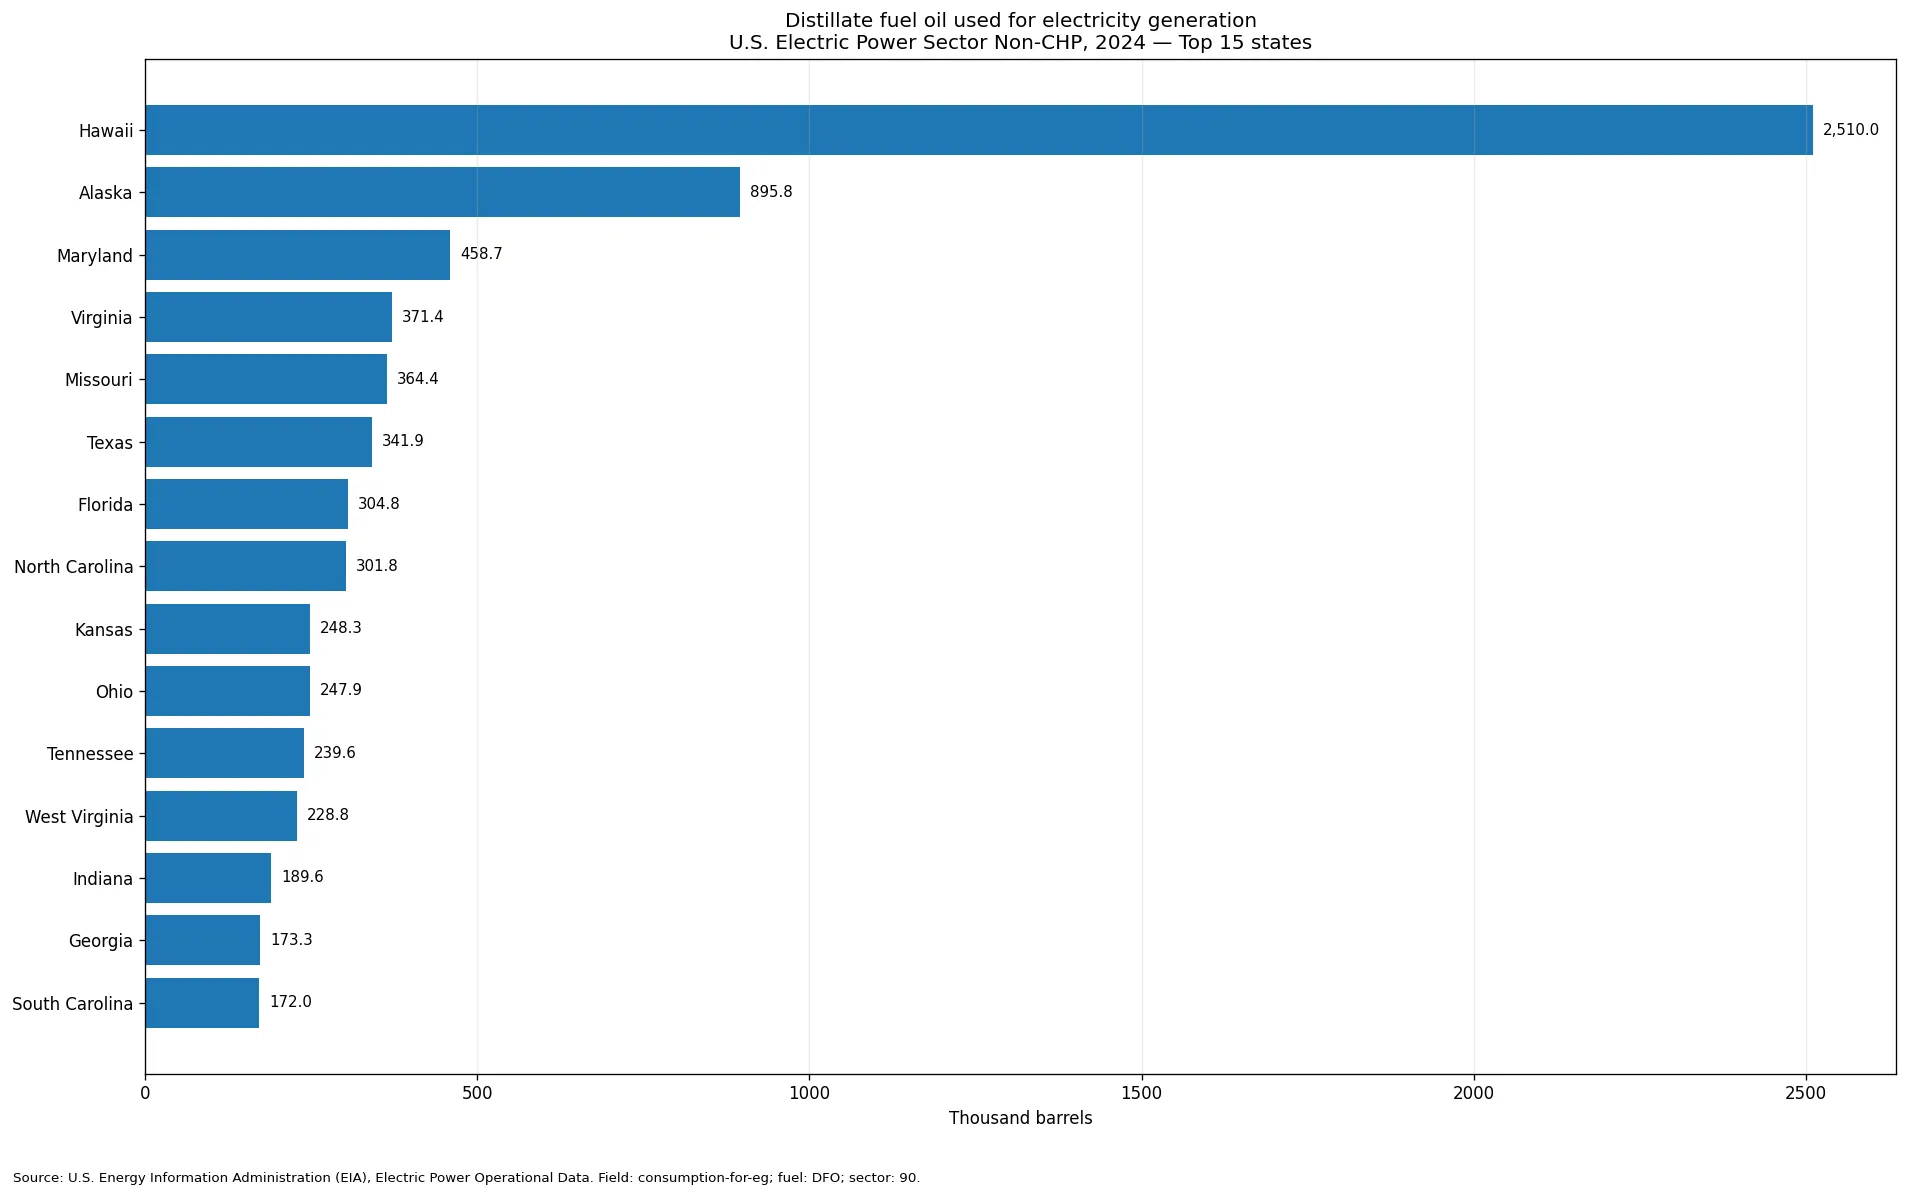
Table of Contents
Hawaii accounted for 27.1% and the top ten states reached 65.3%
Hawaii’s 2,510.008 thousand barrels equal 27.12% of the simple sum across the 50 states. Alaska contributes 9.68% and Maryland 4.96%. Together, the top three account for 41.76%. The gap between Hawaii and the rest is substantial: Hawaii is about 2.8 times Alaska and more than 26.4 times the median state value.
Virginia ranks fourth at 371.436 thousand barrels, followed by Missouri at 364.383, Texas at 341.877, Florida at 304.833, North Carolina at 301.835, Kansas at 248.311, and Ohio at 247.921. The top ten together represent 65.32% of the 50-state sum. The leaders are geographically diverse, spanning the Pacific, Alaska, the Mid-Atlantic, the South, and the Midwest, so a single regional explanation would be too simple.
| State | Code | DFO for electricity generation (thousand barrels) | Share of 50-state sum |
|---|---|---|---|
| Hawaii | HI | 2,510.008 | 27.12% |
| Alaska | AK | 895.764 | 9.68% |
| Maryland | MD | 458.723 | 4.96% |
| Virginia | VA | 371.436 | 4.01% |
| Missouri | MO | 364.383 | 3.94% |
| Texas | TX | 341.877 | 3.69% |
| Florida | FL | 304.833 | 3.29% |
| North Carolina | NC | 301.835 | 3.26% |
| Kansas | KS | 248.311 | 2.68% |
| Ohio | OH | 247.921 | 2.68% |
The ranking is based on absolute fuel consumption. It is not adjusted for population, electricity demand, installed generating capacity, or total generation. A state can have a large absolute value without distillate fuel oil making up a large share of its electricity supply. A dependency or fuel-mix question requires a denominator, such as total generation or total fuel input for the same sector and year. Absolute consumption and relative dependence answer different questions and should not be substituted for each other.
The median was about half the mean because the distribution is strongly right-skewed
The arithmetic mean across the 50 states was 185.087 thousand barrels, while the median was only 94.971. The first quartile was 36.129 and the third quartile 185.562. The large difference between mean and median shows how strongly the largest observations pull the average upward. Hawaii and Alaska are especially influential, which makes the mean less representative of a typical state than it would be in a more balanced distribution.
The median is useful because half the observations fall below it and half above it, while an extreme maximum does not move it very much. In this series, three quarters of states are at or below roughly 186 thousand barrels, yet Hawaii is above 2,500 thousand barrels. The state pattern is therefore better described with several statistics at once: rank order for the leaders, median and quartiles for the middle, and concentration shares for how much of the total is held by the upper tail.
Sector 90 and consumption-for-eg define a specific slice of EIA power data
EIA electric-power operational data are multidimensional. Fuel identifies the energy source, sector identifies the population of activity, the data field identifies what is being measured, and the year fixes the period. Here, DFO is distillate fuel oil and sectorid 90 is labeled Electric Power Sector Non-CHP. The Non-CHP qualifier matters because a broader Electric Power sector or an All Sectors category can include a different set of activities and therefore legitimately produce different state totals.
The field consumption-for-eg narrows the metric further. It refers to fuel consumption for electricity generation. It should not be confused with total-consumption, consumption-uto, generation, generation-btu, or average-heat-content. Similar article titles can hide these differences. Generation is an electrical output measure, while consumption-for-eg is a fuel-input measure. Average heat content describes the energy characteristic of consumed fuel, and BTU fields express energy content rather than the physical barrel volume reported here.
For duplicate checking, the safest identity test is to compare fuel, sector, field, year, and unit together. A 2024 DFO article using sector 98 or a total-consumption field is related but not identical to this sector 90 consumption-for-eg series. On the other hand, if all five dimensions match, a second article would likely repeat the same statistic and should generally be merged with or used to strengthen the existing article instead of being published as a separate page.
Thousand barrels is a physical fuel-volume measure, not electricity generation
Distillate fuel oil is a liquid petroleum product, and EIA state physical-consumption tables report it in thousand barrels. A barrel count answers the narrow question of how much liquid fuel was consumed under the selected data definition. It does not tell us how many megawatthours were produced from that fuel, how much heat energy it contained, what it cost, or how much carbon dioxide was emitted. Those concepts require other fields or conversion factors.
That distinction is important for interpreting the 27.12% Hawaii share. The percentage means Hawaii contributed 27.12% of the sum of the 50 state observations in this DFO, sector 90, consumption-for-eg, 2024 series. It does not mean Hawaii generated 27.12% of U.S. petroleum-fired electricity, consumed 27.12% of all U.S. distillate fuel oil, or held a 27.12% oil share in its own electricity mix. Each of those statements uses a different denominator or a different measure.
The geography is descriptive, but the single annual series does not prove why states differ
The upper ranking is geographically mixed. Hawaii and Alaska stand out, but Maryland, Virginia, Missouri, Texas, Florida, North Carolina, Kansas, and Ohio also appear in the top ten. That diversity suggests caution with simple causal stories. Fuel delivery systems, plant portfolios, local grid conditions, peaking or reserve operation, weather, alternative fuels, and market structure could all matter, but the annual state total does not isolate any of those drivers.
The data also do not reveal the operating role of the fuel. A high annual total could arise from many hours of moderate use, shorter periods of intense operation, or a concentration of fuel use at a small number of facilities. Distinguishing those possibilities would require monthly or plant-level observations. Explaining price effects would require fuel-price data, and explaining efficiency would require generation and heat-input information. The state ranking is therefore most defensible as a descriptive comparison of physical fuel input.
All 50 states had numeric positive observations
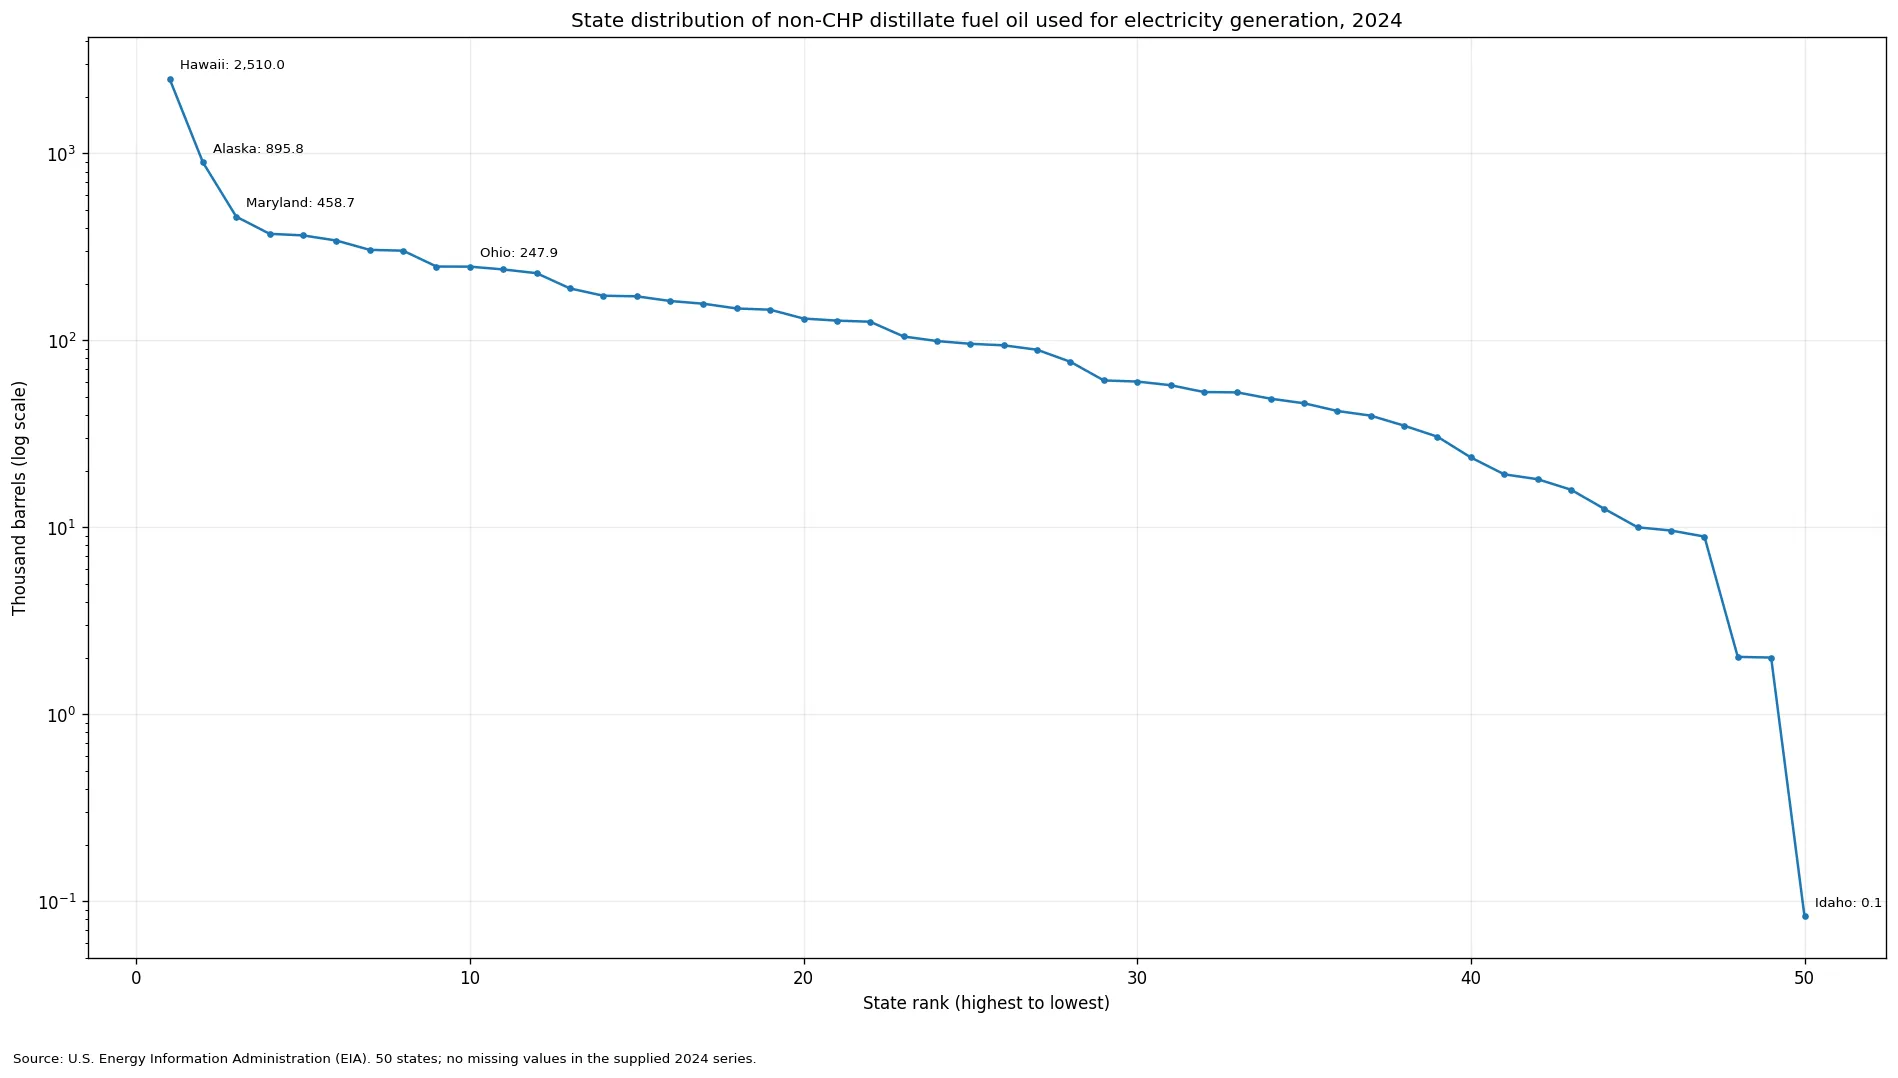
No state is missing from the 50-state series, and no state has an exact zero. Idaho is the minimum at only 0.083 thousand barrels. New Mexico is next at 2.011, followed by Maine at 2.028. These very small positive values matter because they show that the lower end of the distribution is not being created by replacing missing observations with zeros.
The top 20 states account for 84.21% of the 50-state sum, leaving about 15.79% spread across the remaining 30 states. That is a useful way to describe the shape: consumption is concentrated near the top, yet positive observations extend across the entire state set. A standard linear bar chart can visually compress the lower values because Hawaii is so large, which is why the accompanying rank plot uses a logarithmic vertical scale.
What the metric can answer—and what needs additional data
This series can answer where 2024 non-CHP electric-power DFO consumption for electricity generation was largest, how states rank within the same definition, how concentrated the reported state total was, and how the distribution looks relative to its mean, median, and quartiles. Those conclusions come directly from the state observations and do not require assumptions about plant behavior or policy.
The series cannot, by itself, answer why consumption was high, whether petroleum was important in a state’s overall electricity mix, whether plants were efficient, what the fuel cost, or what emissions resulted. Those questions require additional denominators and variables. A useful next step for dependence would be to pair the fuel input with total generation or total fuel consumption for the same sector. A useful next step for efficiency would be to compare energy input with electricity output while keeping the sector and time period aligned.
The source is the U.S. Energy Information Administration (EIA) Open Data Electric Power Operational Data, based on Form EIA-923 reporting. When comparing this result with other EIA energy pages, keep five identifiers together: DFO, sector 90, consumption-for-eg, 2024, and thousand barrels. That compact checklist prevents most false comparisons between closely related petroleum and electricity statistics.
Frequently Asked Questions
Which state used the most distillate fuel oil for non-CHP electricity generation in 2024?
Hawaii ranked first at 2,510.008 thousand barrels, equal to 27.12% of the sum of the 50 state observations.
Does this measure all U.S. distillate fuel oil consumption?
No. It is limited to DFO, EIA sector 90 (Electric Power Sector Non-CHP), the consumption-for-eg field, and 2024.
What unit is used for this physical fuel-consumption series?
For distillate fuel oil physical consumption, the unit is thousand barrels. It is not an electricity-output or heat-content unit.
Are any of the 50 states missing or reported as zero?
No. All 50 observations are numeric and positive; Idaho is the minimum at 0.083 thousand barrels.
Related Articles
Green Map creates custom-edited map images using open geographic data sources such as geoBoundaries, Natural Earth, OpenStreetMap, and government open data. These maps are edited visual materials, not raw data files, and are provided for education, documents, presentations, and graphic reference.