Tuberculosis case detection rate compares the number of new and relapse tuberculosis cases notified to WHO in a year with WHO’s estimate of incident tuberculosis cases for the same year. Across 208 latest available World Bank observations for indicator SH.TBS.DTEC.ZS, the median is 75% and the simple mean is 76.89%. Mongolia has the lowest latest value at 18%, while Belgium has the highest at 140%. Bulgaria and Croatia also exceed 100% at 110%.
The indicator is not a simple test-accuracy measure and it is not a directly observed percentage of every true tuberculosis case. The numerator is notified new and relapse cases; the denominator is an estimated number of incident cases. WHO incidence estimates can be recalculated as new information becomes available and methods improve. Because the denominator is an estimate, notified cases can exceed estimated incidence and the calculated rate can rise above 100%.
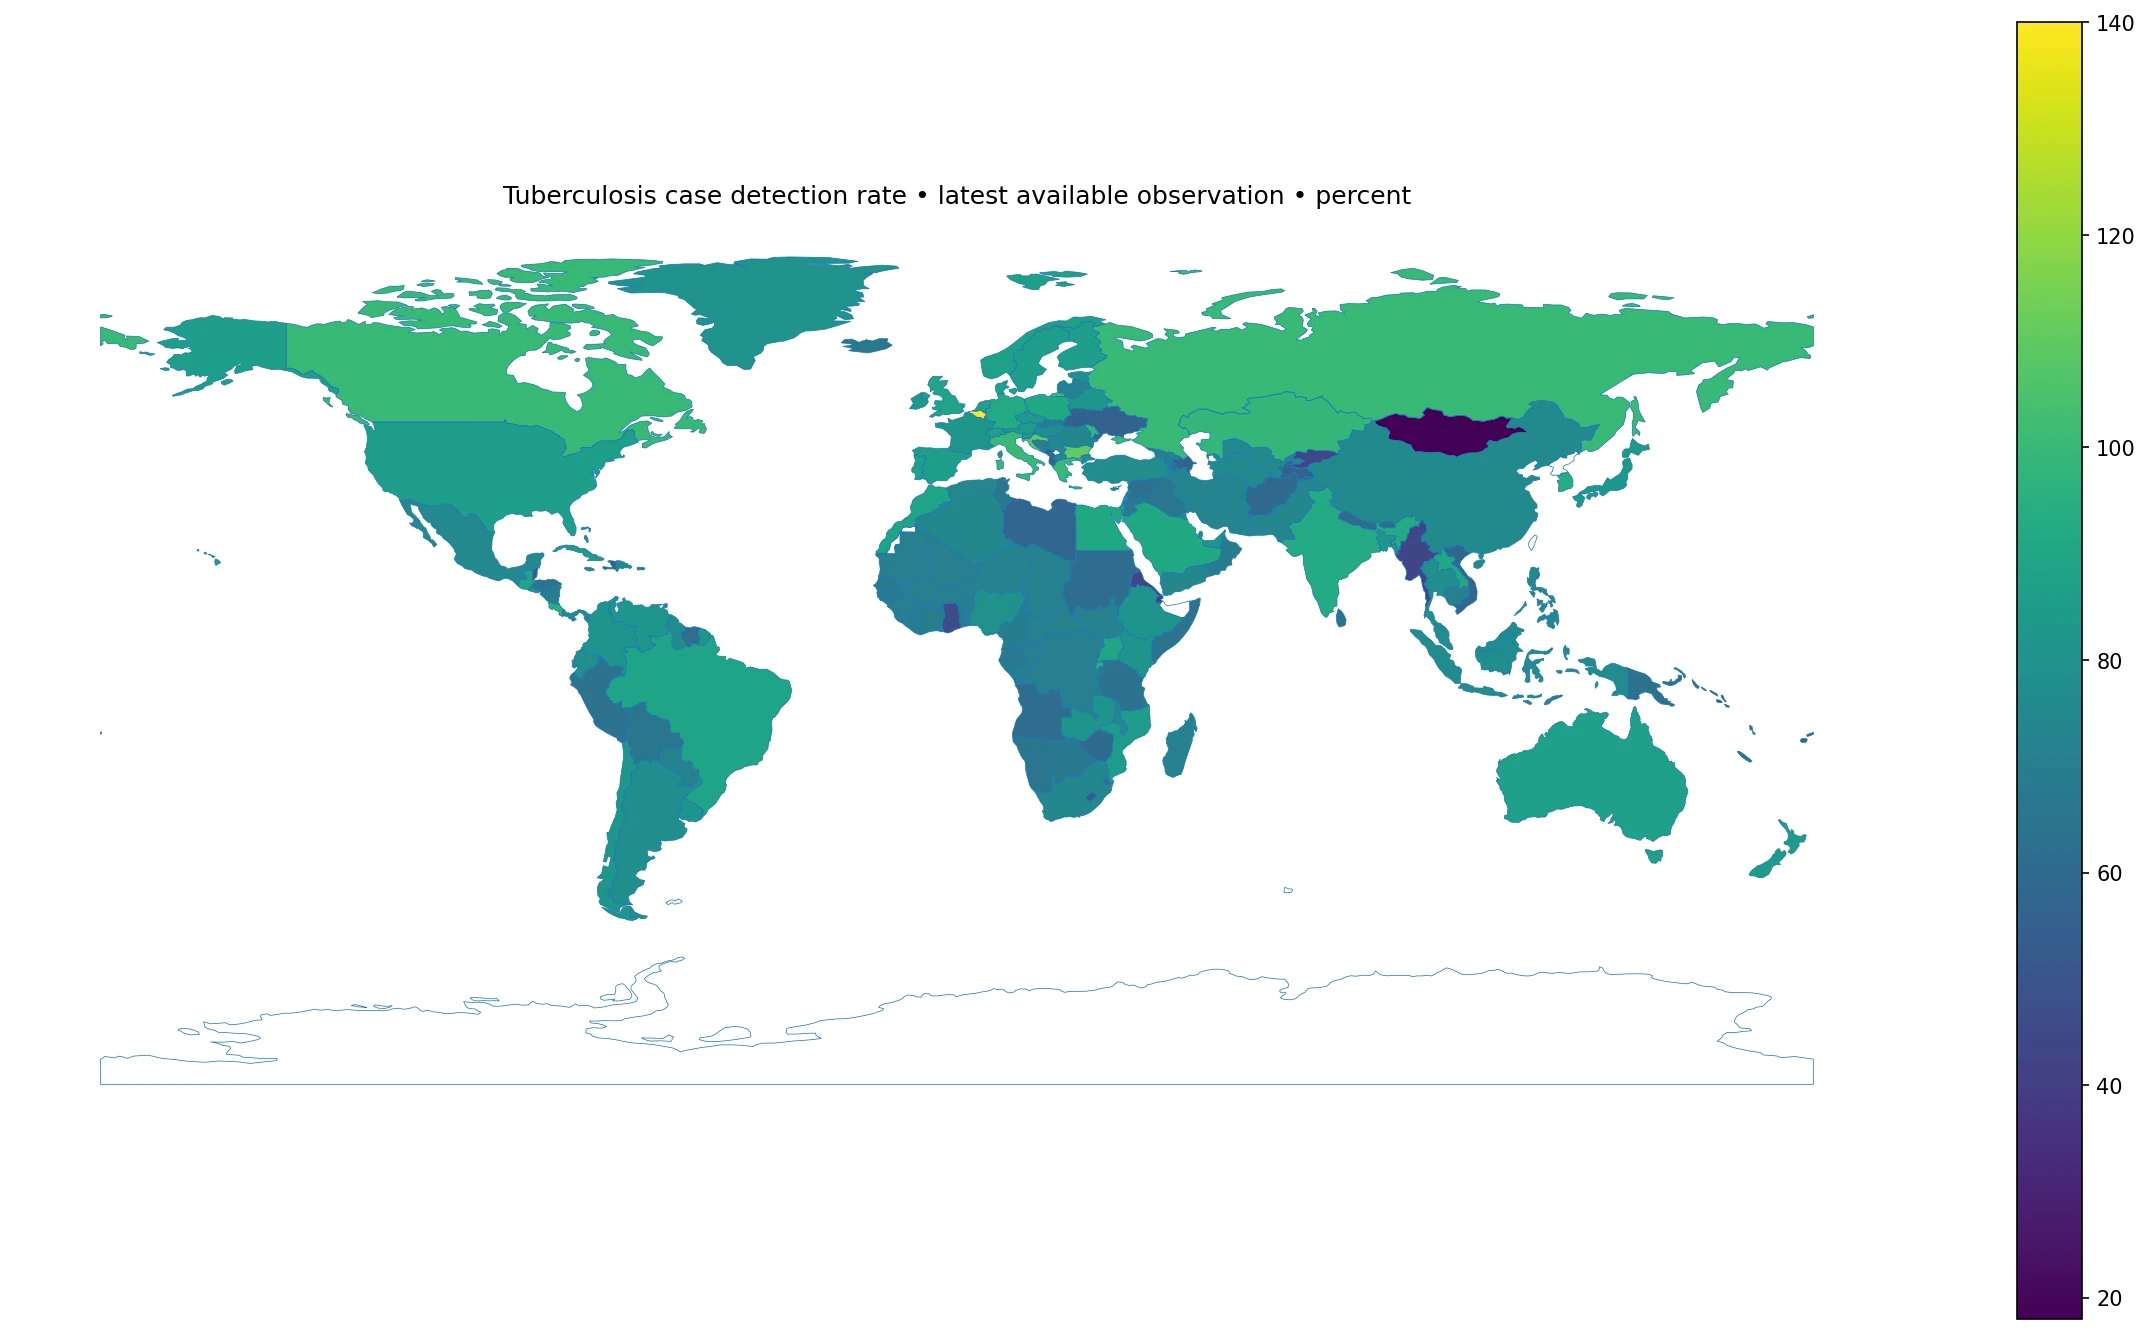
Table of Contents
The median latest observation is 75%
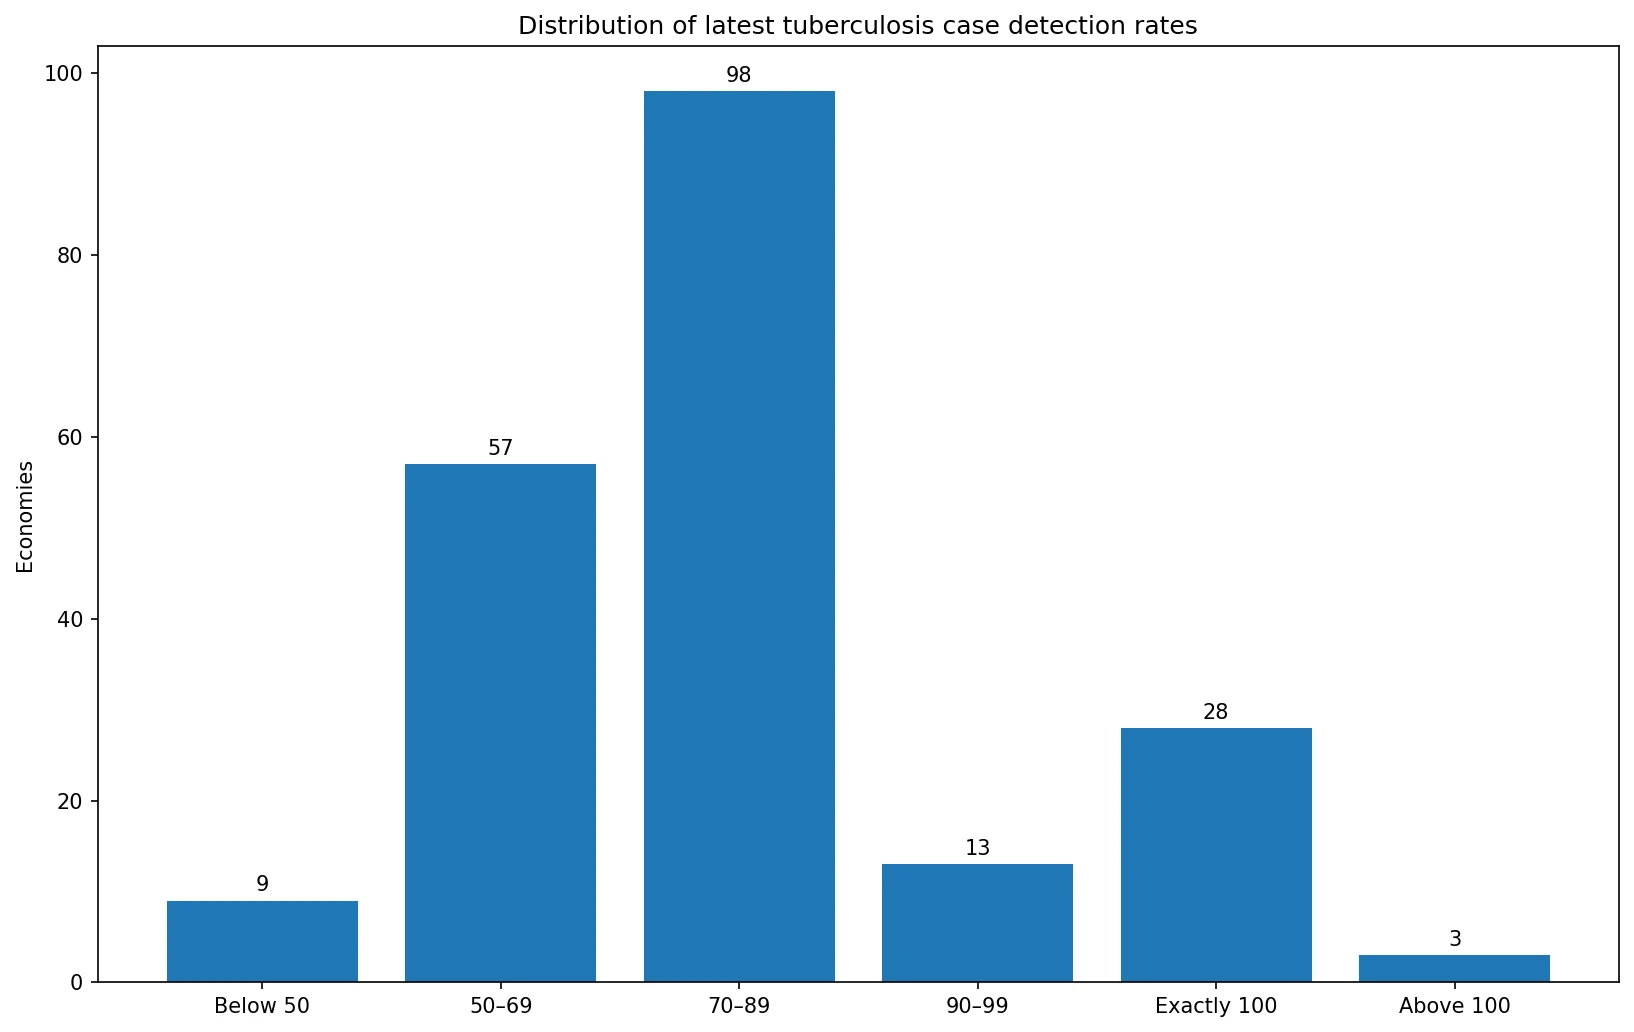
The first quartile is 67% and the third quartile is 87.25%, so the middle half of economies lies between roughly 67% and 87%. Forty-four observations are at least 90%, 28 are exactly 100%, and three exceed 100%. Only nine are below 50%.
The mean of 76.89% is close to the median, but the distribution still has meaningful tails. The upper tail includes three values above 100%, while the lower tail extends to 18%. The median, threshold counts, and extreme values together describe the global pattern more clearly than a single average.
A rate above 100% is possible and should not be treated automatically as an error
Belgium records 140% in 2024, while Bulgaria and Croatia each record 110%. If case detection rate were a directly observed fraction of all true cases, these values would be impossible. But the denominator is WHO’s estimate of incident tuberculosis cases rather than a perfect census of every infection.
A value above 100% means notified new and relapse cases exceeded the estimated number of incident cases used in the denominator. It can reflect uncertainty in incidence estimation, reporting patterns, timing, or later methodological revisions. It should not be interpreted as proof that a health system somehow found ‘more than all’ true cases, nor should it be used as a simple performance score.
The highest latest available observations
| Country or territory | Observation year | Tuberculosis case detection rate |
|---|---|---|
| Belgium | 2024 | 140% |
| Bulgaria | 2024 | 110% |
| Croatia | 2024 | 110% |
| Aruba | 2024 | 100% |
| Andorra | 2024 | 100% |
| American Samoa | 2020 | 100% |
| Antigua and Barbuda | 2024 | 100% |
| Bermuda | 2024 | 100% |
| Barbados | 2023 | 100% |
| Canada | 2024 | 100% |
| Curacao | 2022 | 100% |
| Cayman Islands | 2023 | 100% |
Belgium is the highest at 140%, followed by Bulgaria and Croatia at 110%. The next group contains many economies reported at exactly 100%; there are 28 such latest observations in the full dataset. A 100% value means the notified count and WHO’s estimated incident count align at the level represented by the indicator, not that every individual case is known with certainty.
Countries near or above 100% are best interpreted with the source methodology in mind. Small differences in notification counts, incidence estimates, and revisions can materially change a rate around the 100% boundary. Other tuberculosis indicators provide necessary context for any substantive health-system comparison.
The lowest observations point to large gaps between notifications and estimated incidence
| Country or territory | Observation year | Tuberculosis case detection rate |
|---|---|---|
| Mongolia | 2024 | 18% |
| Djibouti | 2024 | 41% |
| Eritrea | 2024 | 43% |
| Kyrgyz Republic | 2024 | 43% |
| Myanmar | 2024 | 44% |
| Solomon Islands | 2024 | 45% |
| Ghana | 2024 | 46% |
| Micronesia, Fed. Sts. | 2024 | 47% |
| Kiribati | 2024 | 47% |
| Lesotho | 2024 | 51% |
| Belize | 2024 | 52% |
| Haiti | 2024 | 54% |
Mongolia has the lowest latest value at 18% in 2024. Djibouti follows at 41%, Eritrea and the Kyrgyz Republic at 43%, Myanmar at 44%, and Solomon Islands at 45%. Ghana is at 46%, while the Federated States of Micronesia and Kiribati are at 47%.
A low value means notified new and relapse cases are far below WHO’s estimated incident cases. The gap can be associated with underdiagnosis, incomplete notification, access barriers, surveillance coverage, private-sector reporting, or other factors, but this indicator alone cannot identify the cause. Country-specific program and surveillance information is needed for explanation.
Most observations are from 2024
The period alignment is unusually strong for a latest-available global dataset. Of 208 observations, 191—about 91.8%—are from 2024. Twelve are from 2023, one from 2022, one from 2020, two from 2018, and one from 2003.
This makes broad comparison more contemporaneous than a dataset mixing many decades, but the 17 older observations still require caution. A value last observed in 2003 or 2018 may not describe the country’s present tuberculosis detection system.
The 2024-only subset has the same 75% median
Restricting the file to the 191 observations from 2024 gives a median of 75% and a simple mean of about 76.37%. The first quartile is 67% and the third quartile is 87%. All three values above 100% are 2024 observations.
The similarity between the full latest-observation distribution and the 2024 subset means the older 17 values do not materially shift the center. For pairwise country comparisons, however, the observation year should still be checked.
Case detection rate is different from tuberculosis incidence
Tuberculosis incidence estimates how many new and relapse cases occur in a population during a period, commonly expressed as a rate per population. Case detection rate compares notified cases with the estimated incident count. A country can have high tuberculosis incidence and also a high detection rate, or low incidence and a low detection rate.
The two indicators answer different questions: one concerns disease burden, the other concerns the relationship between notifications and estimated burden. Conflating them can make a country with better case finding appear to have more disease simply because more cases are notified.
Detection and treatment success describe different stages
Case detection concerns whether people with incident tuberculosis are identified and notified. Treatment success concerns outcomes among people who entered treatment cohorts. A health system can perform differently at these stages: high detection does not guarantee high treatment success, and strong treatment outcomes do not prove that most incident cases were found.
A fuller tuberculosis picture therefore combines incidence, case notifications, case detection, treatment coverage, treatment success, drug resistance, mortality, and preventive treatment. This map addresses only one part of that pathway.
Rates near 100% should not be treated as a precise target score
The intuitive idea that 100% equals perfect detection is too simple because the denominator is modeled or estimated rather than known with complete certainty. The presence of values above 100% demonstrates that the indicator is not bounded like a directly observed share of a complete census.
A comparison such as 95% versus 105% should therefore not be described as a straightforward ten-point difference in health-system quality. Incidence uncertainty, reporting completeness, and later revisions can all influence the ratio.
WHO incidence estimates may be revised
The World Bank topic documentation notes that estimates for all years are recalculated when new information becomes available and techniques are refined. That means a historical case-detection value seen today may differ from a value published in an older report even when the nominal year is unchanged.
This revision process is normal for modeled public-health indicators. It improves consistency with the best available evidence, but it also means analysts should avoid mixing values copied from different publication vintages when building a time series.
The world map is useful for locating large gaps and unusual values
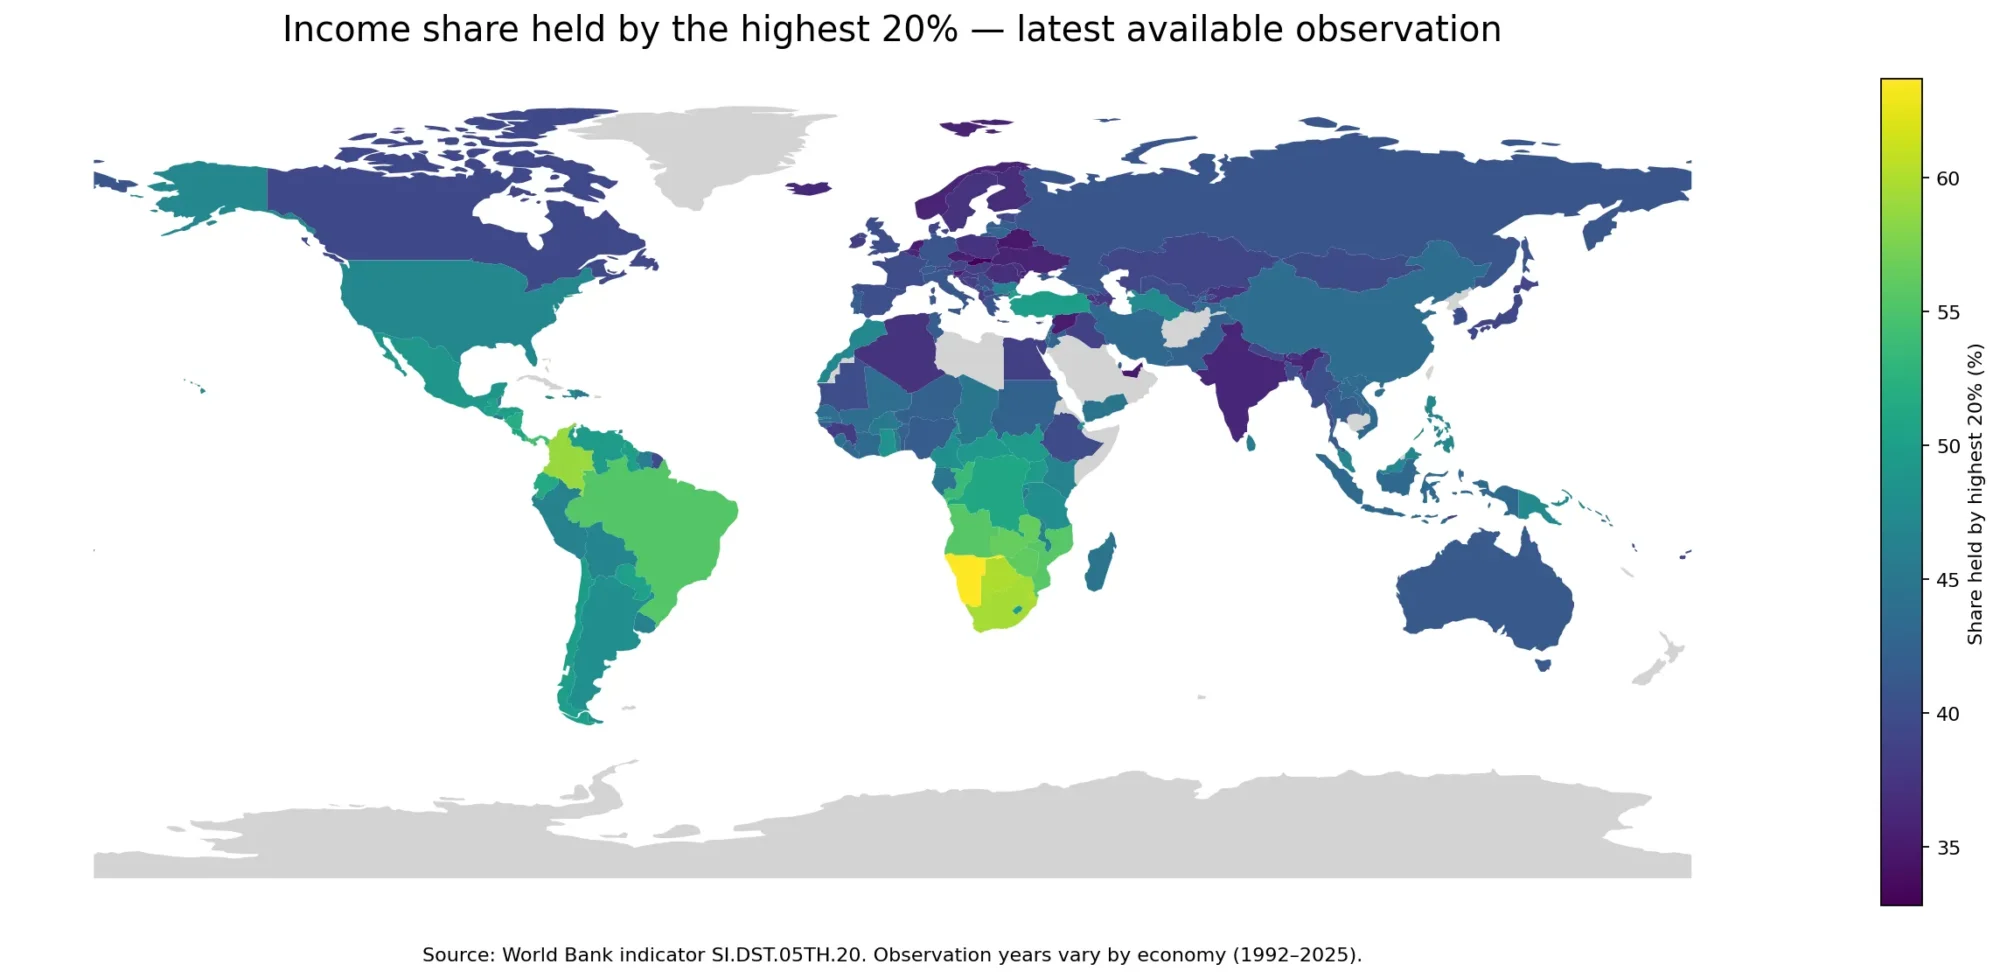
The map quickly shows where detection rates fall below the main 70–90% cluster and where values reach or exceed 100%. The distribution chart complements the map by showing how many economies fall into each range.
Some small island states and territories do not have separate polygons in the low-resolution world boundary file. Their observations remain included in the statistical calculations and ranking tables, so the map should be treated as a spatial aid rather than the complete inventory of values.
Data source and calculation method
The source is World Bank indicator SH.TBS.DTEC.ZS, ‘Tuberculosis case detection rate (%, all forms).’ The indicator is defined as new and relapse tuberculosis cases notified to WHO in a year divided by WHO’s estimate of incident tuberculosis cases in the same year, expressed as a percentage. The verified file contains the most recent non-empty observation for each of 208 countries and territories.
The mean, median, quartiles, threshold counts, and ranking tables are calculated directly from those 208 official observations. Missing values are not converted to zero. ISO3 country codes are joined to a low-resolution world boundary layer for the map; small unmatched jurisdictions remain in all tables and summary statistics.
Frequently Asked Questions
Can tuberculosis case detection rate exceed 100%?
Yes. The denominator is WHO's estimated incident cases rather than a complete count of every true case. If notified new and relapse cases exceed the estimate, the ratio can be above 100%.
Is tuberculosis case detection rate the same as tuberculosis incidence?
No. Incidence estimates how many cases occur, while case detection compares notified cases with that estimated number.
Does a high detection rate guarantee high treatment success?
No. Detection and treatment outcomes describe different stages of tuberculosis control and should be evaluated with separate indicators.
Related Articles
Green Map creates custom-edited map images using open geographic data sources such as geoBoundaries, Natural Earth, OpenStreetMap, and government open data. These maps are edited visual materials, not raw data files, and are provided for education, documents, presentations, and graphic reference.