Eurostat’s 2025 business digitalisation data show clear differences in the share of enterprises using artificial intelligence technologies that identify objects or persons from images. Finland records the highest value among 32 reporting countries at 7.70%, followed by Sweden at 4.90%, Denmark at 7.28% and Belgium at 6.54%. At the lower end, Malta records 4.89%, Czechia 2.10%, Cyprus 2.34% and Bosnia and Herzegovina 2.36%.
The simple mean of the 32 national rates is 3.89%, while the median is 3.42%. The first quartile is 2.39% and the third quartile 4.98%. The difference between the maximum and minimum is 7.62 percentage points. Much of the distribution is concentrated in the low single digits, so actual percentage-point gaps are often more informative than rank alone.
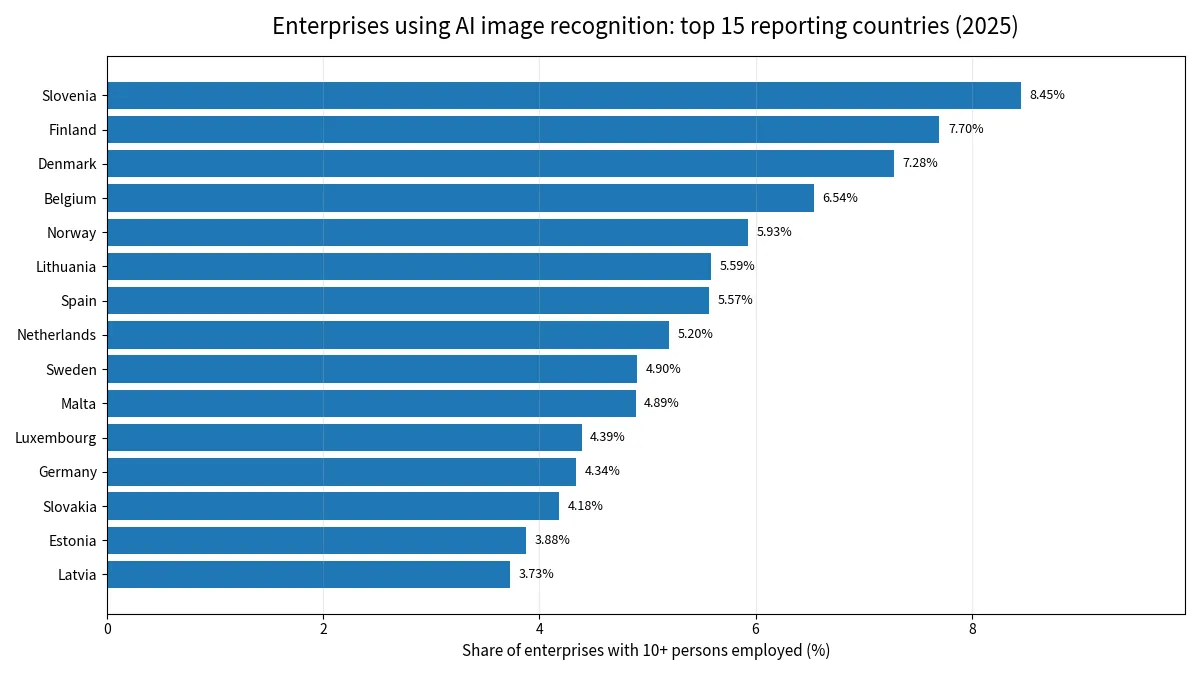
Table of Contents
The measure covers recognition in images, not image generation
E_AI_TIR is not a measure of generative-image tools. It covers AI technologies that identify objects or persons from images. Business uses can include visual quality inspection, object detection in logistics, document-image classification, stock recognition, security workflows and other forms of computer vision. The national percentage does not identify which use case dominates or which software architecture is used.
GE10 limits the population to enterprises with ten or more persons employed, and PC_ENT expresses the result as a percentage of enterprises. Very large and relatively small eligible firms each count as one enterprise. The indicator therefore does not measure the number of workers using image AI, the number of images processed, model accuracy, spending or productivity impact.
Image recognition is a broad label for a family of operational tasks. A manufacturer may use vision systems to inspect defects, a logistics operator may detect objects, a retailer may classify stock, and another enterprise may analyse scanned documents or security imagery. These activities can have very different levels of complexity and business importance even though they all contribute to the same country-level adoption rate.
A low national percentage should not automatically be interpreted as weak demand for visual AI. Adoption can be shaped by the industrial structure of the economy, the share of businesses with image-heavy workflows, outsourcing, privacy requirements and the amount of existing automation equipment. Those factors are not variables in this dataset, so they remain possible explanations rather than demonstrated causes.
Finland and Sweden are near the top
Finland leads at 7.70%, followed by Sweden at 4.90% and Denmark at 7.28%. Norway records 5.93%. The simple average for Denmark, Finland, Norway and Sweden is 6.45%, above the overall mean of 3.89%. This is an unweighted average of national percentages rather than a regional enterprise-weighted estimate.
The Benelux average is 5.38%, the Baltic average 4.40%, a five-country southern grouping 3.77% and a seven-country central grouping 3.85%. These groupings are descriptive only. Internal variation within each group shows that geographic proximity does not produce a single common rate.
The distribution is concentrated in low single digits
The mean is 3.89% and the median 3.42%. The first quartile of 2.39% and third quartile of 4.98% place the middle half of observations between about 2.39% and 4.98%. Even the maximum of 8.45% is below 10%, making this a relatively narrow AI technology category.
By broad bands, 3 countries are at 7% or above, 5 are from 5% to below 7%, 11 are from 3% to below 5%, 12 are from 1% to below 3%, and 1 are below 1%. The top eight countries average 6.53%, compared with 1.87% for the bottom eight.
The relatively small difference between mean and median matters as well. Higher observations lift the mean, but most countries remain clustered in a compact range. It is therefore more accurate to describe the pattern as a low adoption rate with meaningful national variation rather than as a distribution dominated by a handful of extreme outliers.
Small differences can move countries several places
A large part of the table is compressed between roughly 3% and 5%. In this range, a difference of only a few tenths of a percentage point can change the ranking by several positions. Rank should therefore be treated as a convenient ordering device, not as a precise measure of capability.
Germany, France, Italy and Spain have a simple average of 4.13%. This is not a combined enterprise-weighted rate. A regional weighted figure would require the eligible enterprise population for each country.
The size threshold also affects interpretation. Enterprises with fewer than ten persons employed are outside the GE10 category. Countries with different business-size structures can therefore have different surveyed populations. The percentages should not be extended automatically to every business, freelancer or micro-enterprise in the economy.
Low image-recognition use does not mean low AI use overall
Malta at 4.89%, Czechia at 2.10%, Cyprus at 2.34%, Bosnia and Herzegovina at 2.36% and Albania at 2.37% are among the lower observations. Enterprises can still use natural-language generation, speech recognition, workflow automation, predictive systems or other AI tools without using image recognition.
The measure also cannot distinguish a limited pilot from deep operational use. Both can count as adoption. Comparing maturity, scale or business impact would require more detailed data.
Different AI technology indicators can overlap at the enterprise level. A company can simultaneously use image recognition, language generation and workflow automation. For that reason, percentages from separate Eurostat AI indicators should not be added together to calculate a total AI-use rate.
All 32 comparable observations for 2025
The table orders all 32 national observations from highest to lowest under one consistent statistical definition. The ranking is useful for navigation but should not be treated as a composite ranking of AI competitiveness or innovation.
| Rank | Country | Share of enterprises |
|---|---|---|
| 1 | Slovenia | 8.45% |
| 2 | Finland | 7.70% |
| 3 | Denmark | 7.28% |
| 4 | Belgium | 6.54% |
| 5 | Norway | 5.93% |
| 6 | Lithuania | 5.59% |
| 7 | Spain | 5.57% |
| 8 | Netherlands | 5.20% |
| 9 | Sweden | 4.90% |
| 10 | Malta | 4.89% |
| 11 | Luxembourg | 4.39% |
| 12 | Germany | 4.34% |
| 13 | Slovakia | 4.18% |
| 14 | Estonia | 3.88% |
| 15 | Latvia | 3.73% |
| 16 | France | 3.69% |
| 17 | Austria | 3.15% |
| 18 | Portugal | 3.11% |
| 19 | Croatia | 3.04% |
| 20 | Italy | 2.92% |
| 21 | Türkiye | 2.91% |
| 22 | Hungary | 2.89% |
| 23 | Ireland | 2.72% |
| 24 | Bulgaria | 2.40% |
| 25 | Albania | 2.37% |
| 26 | Bosnia and Herzegovina | 2.36% |
| 27 | Cyprus | 2.34% |
| 28 | Czechia | 2.10% |
| 29 | Poland | 1.84% |
| 30 | Romania | 1.60% |
| 31 | Montenegro | 1.55% |
| 32 | Serbia | 0.83% |
A single year does not show the speed of adoption
This is a 2025 cross-section. It does not show whether a country recently accelerated, slowed down or remained stable. A high level is not the same as a high growth rate, and a low level does not imply declining use. A trend analysis would require earlier years under the same survey definition.
When comparing across years, the indicator, size class, industry aggregate and unit need to remain consistent. Changes in survey coverage can create apparent movements that are not caused by technology adoption itself. The present comparison therefore keeps the scope deliberately narrow and focuses on one year.
What the comparison can and cannot establish
The data directly support a comparison of national prevalence in 2025. The simple mean is 3.89%, the median 3.42%, the maximum 8.45% and the minimum 0.83%. They also show strong concentration in the low-single-digit range.
The same evidence cannot establish that higher adoption causes stronger productivity, profitability or technical quality. Sector detail, enterprise-size breakdowns, operational intensity and time-series data would be needed to explain the differences more fully.
Source and indicator definition
The source is Eurostat isoc_eb_ai for 2025. The indicator is E_AI_TIR, the enterprise-size class is GE10, the sector aggregate is C10-S951_X_K and the unit is PC_ENT. The mean, median, quartiles and distribution bands are calculated from the 32 national observations reported under that common definition.
Frequently Asked Questions
Which country had the highest share of enterprises using AI image recognition in 2025?
Finland had the highest share at 7.70%, followed by Sweden and Denmark.
Does E_AI_TIR measure generative image AI?
No. It measures enterprises using AI technologies that identify objects or persons from images.
What are the mean and median across the 32 countries?
The simple mean is 3.89% and the median is 3.42%.
Does a low image-recognition rate mean overall AI use is low?
No. Enterprises can use other AI technologies without using image recognition.
Related Articles
Green Map creates custom-edited map images using open geographic data sources such as geoBoundaries, Natural Earth, OpenStreetMap, and government open data. These maps are edited visual materials, not raw data files, and are provided for education, documents, presentations, and graphic reference.