Comanche County lies in southwestern Kansas, where Coldwater provides the clearest anchor for understanding roads, settlements, drainage, and relief across a broad rural landscape. Protection is west of Coldwater, Wilmore is to the north, and U.S. 160 and U.S. 183 make Coldwater easy to locate on the general map. The supplied map set separates county roads and place names from city relationships, waterways, and elevation, so the same area can be examined without overloading one view. High-resolution JPG files corresponding to the web maps can be downloaded together from the ZIP box later on this page. High-resolution map files are available for download in the section below.
The county is not a featureless plain. The elevation surface spans roughly 482 to 686 meters, with a mean of about 590 meters. Higher ground dominates much of the north and northwest, while lower valleys become more pronounced toward the south and east. Salt Fork Arkansas River, Nescatunga Creek and its branches, Mule Creek, Indian Creek, and numerous smaller channels follow those lower corridors and divide the uplands into repeated ridges and shallow valleys.
The Kansas Historical Society places Comanche County in southwestern Kansas and identifies its physical setting with the Red Hills and High Plains. That regional description is useful when reading the supplied maps because broad elevated surfaces and strongly dissected stream country appear side by side. Rather than memorizing Coldwater, Protection, and Wilmore as isolated labels, it is more useful to connect them to U.S. 160 and 183, the Salt Fork drainage, and the changing elevation across the county.
Table of Contents
Coldwater as the road anchor for a wide rural county
The general map makes Coldwater the most practical first reference point. U.S. 160 crosses the county from west to east near the city, while U.S. 183 runs north and south through the same area. These two highways establish a simple framework before the smaller state and county roads are considered. Protection is positioned to the west, Wilmore is north of Coldwater, and the eastern half of the county contains far fewer settlement labels. The contrast makes it clear that roads and drainage become more important than towns when describing the less populated eastern country.
Smaller roads create a loose grid, but the pattern is repeatedly interrupted or redirected by drainage valleys. That is especially visible away from Coldwater, where thin blue channels become dense and the road network crosses a more dissected surface. The map is useful for county-scale orientation, not for live navigation. Road construction, closures, and driving conditions can change, so current routing should be checked with an up-to-date navigation or transportation source.
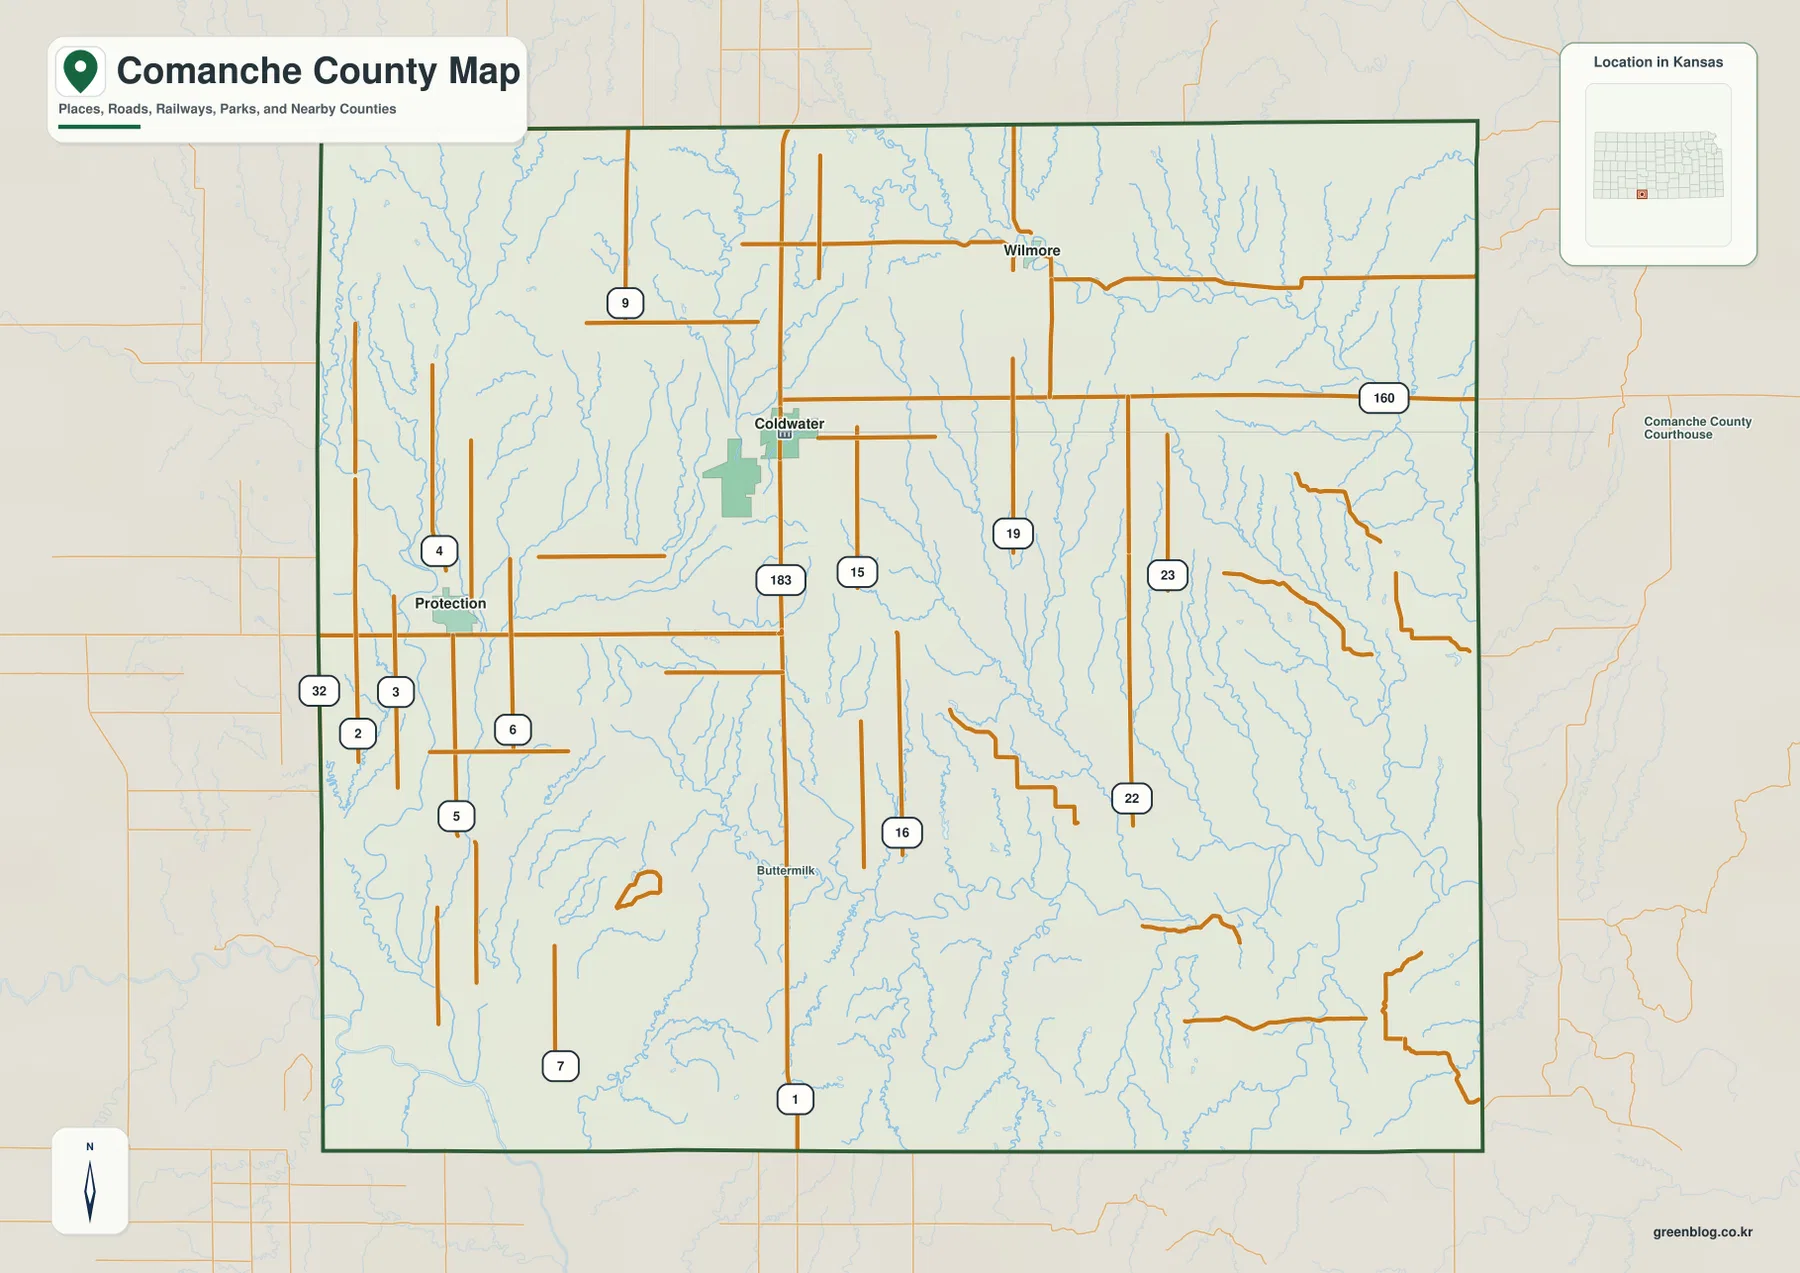
A few smaller labels, including Buttermilk south of Coldwater, help orient the interior, but most of the county is defined by roads, streams, and open space rather than a continuous chain of towns. This is an important distinction when preparing a classroom or regional reference map. Comanche County is better understood as a large rural area organized around a small number of communities than as an urban corridor where place names occur every few miles.
Protection, Coldwater, and Wilmore as three settlement reference points
The city connection map removes most road detail and focuses on Coldwater, Protection, and Wilmore. Coldwater is marked as the hub, Protection lies to the west, and Wilmore is north of the hub. The map presents approximate straight-line relationships of about 10 miles to Protection and about 8 miles to Wilmore. Those figures are useful for scale and orientation, but the connecting lines are not road routes and should not be read as current driving mileage.
This simple arrangement is especially helpful because the eastern and southern parts of the county contain few prominent settlement labels. Once the three communities are fixed in mind, U.S. 160 can be used to extend the mental map eastward and the major creeks can provide additional natural reference points. A reader looking only at the city map learns where the communities sit relative to one another; a reader moving back to the general map can then see which roads actually connect the broader landscape.
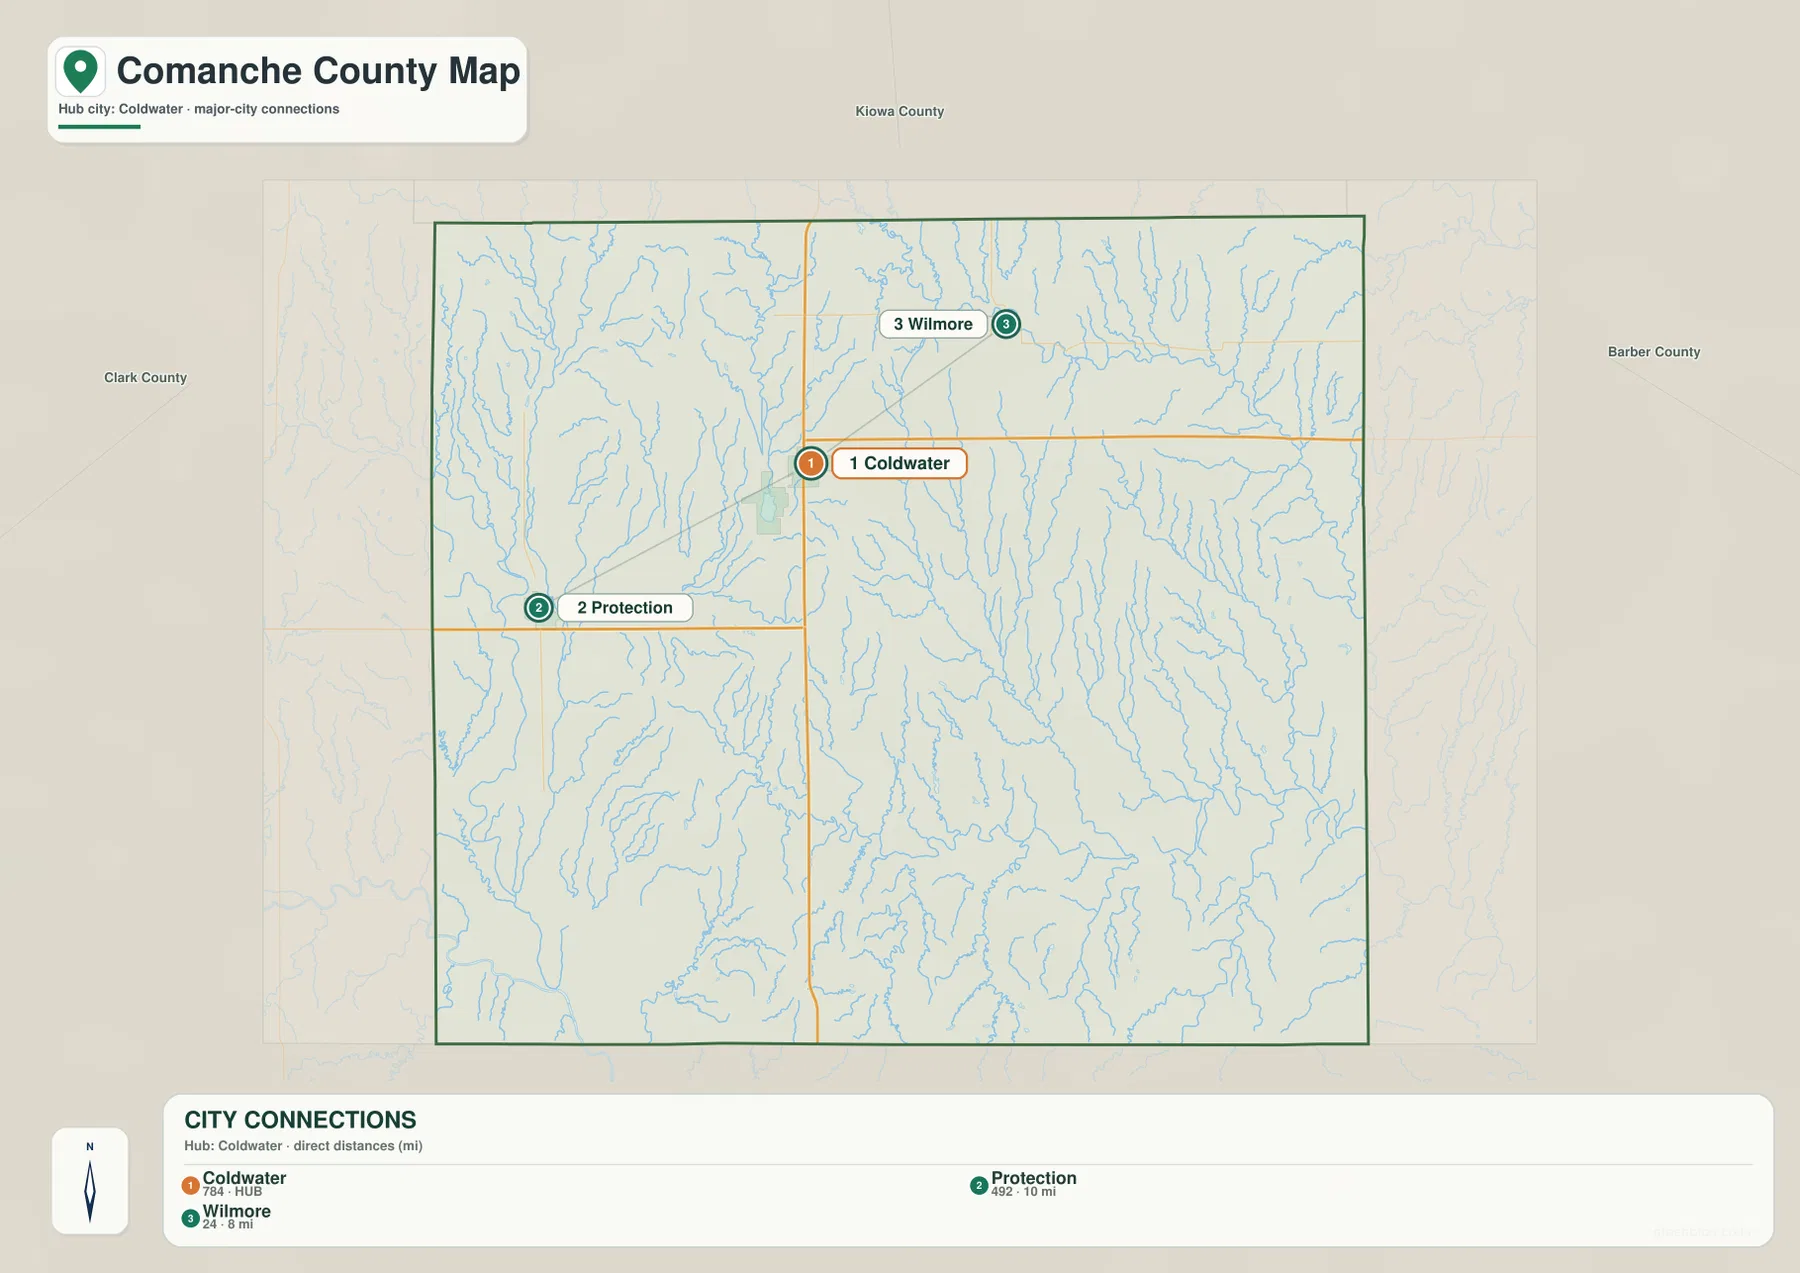
The map is also useful for explaining why Coldwater is the dominant orientation point even though the county covers much more territory to the east and south. Comanche County’s official website identifies Coldwater as the county seat and most populous city and lists Protection and Wilmore among its communities. That administrative role matches the geographic prominence of Coldwater on the supplied maps, where the city sits at the intersection of the two major U.S. highways.
Salt Fork Arkansas River and the Nescatunga Creek drainage
The terrain and water map reveals a much denser pattern than the settlement view. Salt Fork Arkansas River bends across the southern portion of the county and forms one of the most important low corridors. A small segment of the Cimarron River appears near the southwestern edge, but the Salt Fork and the Nescatunga Creek system do more to explain the interior drainage. Numerous minor channels descend from higher ground toward these larger valleys, creating a branching network across nearly every part of the map.
Nescatunga Creek runs southward through the central-eastern area and is joined by labeled West Branch and East Branch channels. Mule Creek crosses the north and northeast, while Indian Creek and Owl Creek mark the eastern side. In the west, Bluff Creek, Cavalry Creek, and Kiowa Creek provide additional references. Together these streams show that Comanche County is not drained by a single straight river corridor. Different parts of the upland surface feed separate valleys that eventually connect with the larger regional river system.
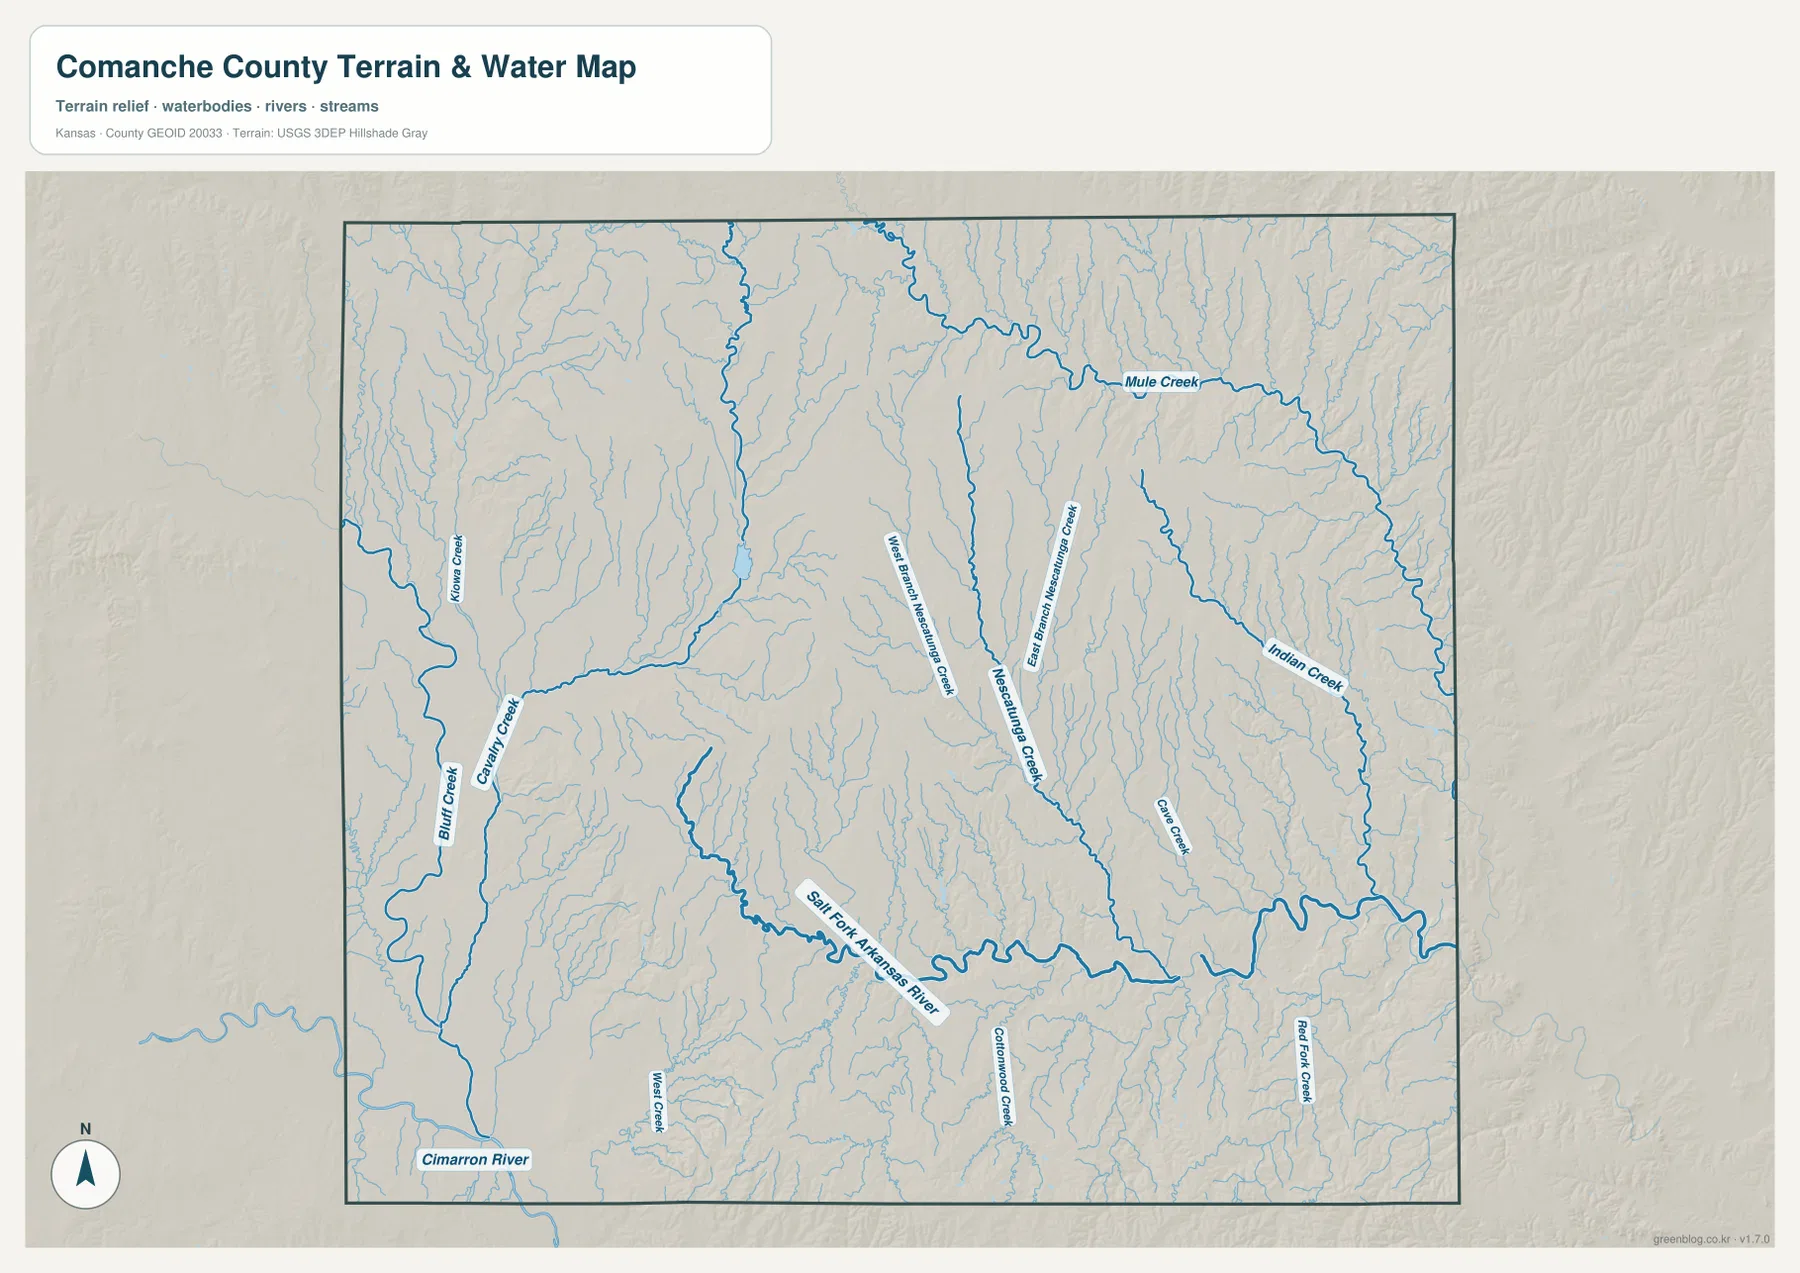
The close spacing of small channels is especially important when the water map is compared with the elevation view. Many thin tributaries begin on the higher northern surface and cut toward lower country in the south and east. This map should not be treated as a real-time flood, streamflow, or water-quality product. Current conditions require live observations from USGS or another responsible agency. Its purpose here is to show where drainage corridors lie and how they divide the landscape.
From 686-meter uplands to 482-meter stream valleys
The elevation map shows an actual county range of approximately 482 to 686 meters and a mean elevation of about 590 meters. Brown and tan tones mark broad areas of higher ground across much of the north and northwest. The southern and eastern portions contain more green, indicating lower elevations associated with larger stream valleys. The pattern is gradual at county scale but becomes sharply textured where individual creeks have cut into the upland surface.
The eastern half is particularly dissected. Rather than one isolated mountain or escarpment, the landscape consists of ridges separated by many branching valleys. Similar relief appears in the west, although the broad color pattern suggests stronger high-ground dominance toward the north. The lower Salt Fork corridor and the valleys feeding it form a useful contrast to those uplands. This relationship explains why the water map and elevation map reinforce one another so clearly.
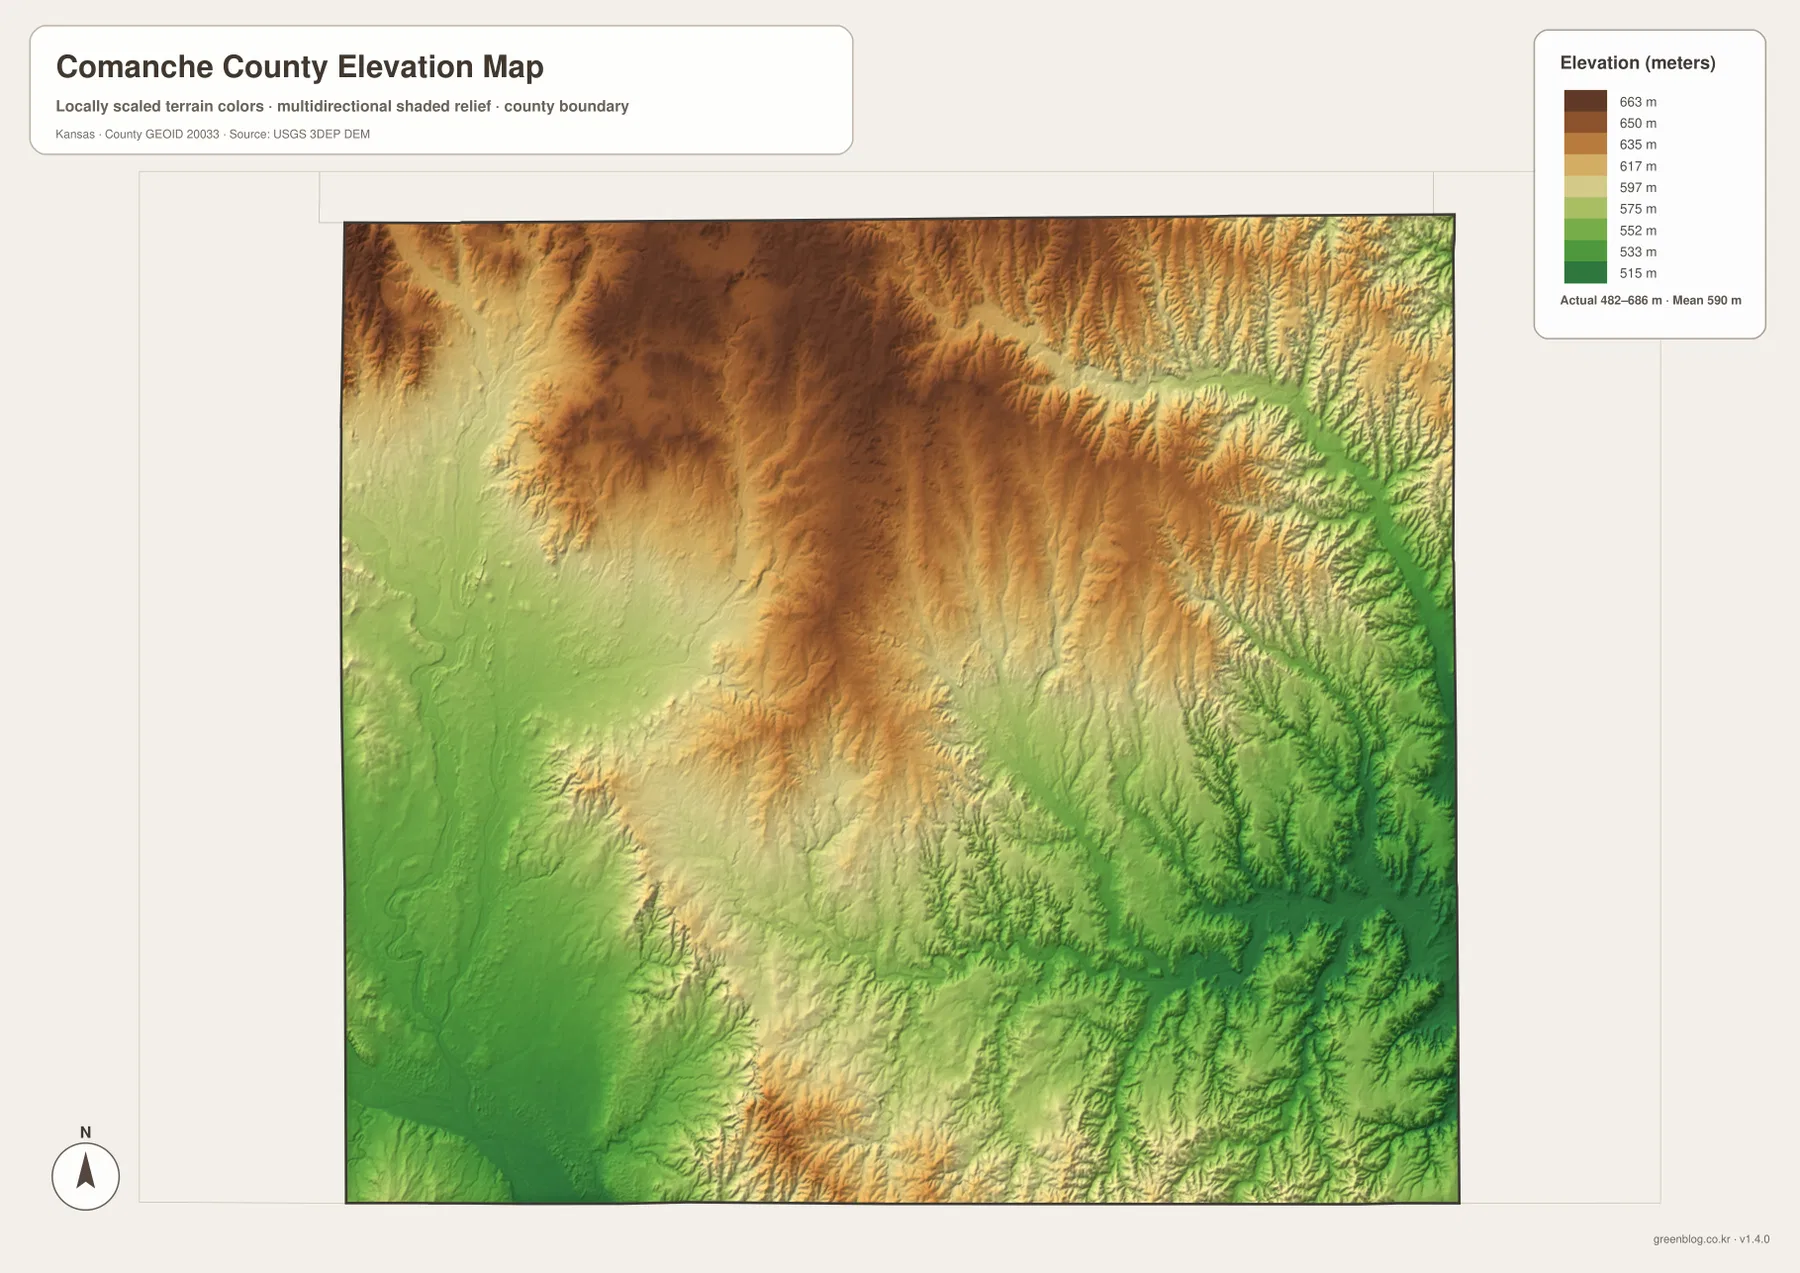
The elevation surface is meant for broad geographic comparison. It is not a survey-grade product for establishing an exact parcel elevation, designing drainage, or making engineering decisions. Its strength is visual context: a reader can see where the high plains surface is preserved, where streams have cut into it, and why the county becomes greener on the elevation scale toward several southern and eastern valleys.
Reading the Red Hills and High Plains transition
Kansas Historical Society material identifies Comanche County with both the Red Hills and High Plains physiographic regions. The map does not draw a hard line between those landscapes because the transition occurs through changing relief rather than a legal boundary. Broad elevated ground is easier to recognize in the north, while the south and east show increasingly carved stream valleys. That gradual change is more useful than trying to assign every road or town to one side of an imaginary line.
Coldwater sits in a practical middle position for observing this transition. Moving north from the city leads toward generally higher terrain, while movement south toward the Salt Fork drainage brings more pronounced valleys into view. Farther east, Indian Creek and many unnamed tributaries create a tightly cut surface. These differences explain why a county that looks simple on a highway map can appear far more complex on a shaded-relief image.
The official county website identifies Coldwater as the county seat and most populous city, with Protection and Wilmore also named as local communities. That information aligns with the city map’s visual hierarchy. Coldwater is therefore not only an administrative center but also the most convenient geographic anchor when explaining how roads, drainage, and relief fit together across Comanche County.
Selecting a map for orientation, terrain, or printing
For a first look at the county, start with the general map and locate Coldwater at U.S. 160 and U.S. 183. Add Protection to the west and Wilmore to the north, then use the highways to extend orientation into the large areas without prominent towns. This approach works well for regional introductions, school assignments, local history materials, and trip preparation because it establishes the settlement and road framework before natural features are added.
For physical geography, begin instead with Salt Fork Arkansas River and the Nescatunga Creek system. The terrain and water map reveals how tributaries descend from higher ground, while the elevation map makes the north-to-south and west-to-east relief differences easier to recognize. Indian Creek, Mule Creek, and the western tributaries provide smaller reference points when describing particular parts of the county. Linking those names to Coldwater or Protection makes the setting much easier to remember.
For printing or placement in a larger document, the high-resolution JPG files in the ZIP are preferable to the reduced web previews. The download preserves the map images at a size better suited to enlarged labels and detailed inspection. Anyone republishing or modifying a map should check the relevant source and attribution requirements. Projects that depend on current road status, live stream conditions, flood hazards, or exact elevations should pair these reference maps with the latest authoritative data.
Frequently Asked Questions
Where is Coldwater on the Comanche County map?
Coldwater is in the northwestern half of the county near the intersection of U.S. 160 and U.S. 183. Protection is west of Coldwater and Wilmore is to the north. Because the official county website identifies Coldwater as the county seat, it is also the most useful settlement anchor for understanding the rest of the map.
What do Salt Fork Arkansas River and Nescatunga Creek show about the county?
They mark important low drainage corridors through a landscape that is higher across much of the north and northwest. Nescatunga Creek and its branches collect water from upland areas before joining larger southern drainage, while Salt Fork Arkansas River follows one of the county’s broadest low corridors. The map shows geographic relationships, not live streamflow or flood conditions.
Can the 482–686 meter elevation map be used for surveys or engineering?
No. The elevation map is a county-scale visual reference for comparing uplands, ridges, and valleys. Exact parcel elevations, construction, drainage design, and legal surveys require purpose-built data and professional methods appropriate to those tasks.
Map File Information
Download the high-resolution JPG files corresponding to the Comanche County general, city connection, terrain-and-water, and elevation maps in one ZIP archive.
- Included Files: Use only the versions confirmed in the article and supplied images
- File Type: Use the confirmed download contents
- Intended Use: Printing, education, presentations, and map-based projects
Related Maps
Sources and references
- Comanche County, Kansas official website — county offices, Coldwater, Protection, Wilmore, and local information
- Kansas Historical Society — Comanche County, Kansas — county history and Red Hills/High Plains regional context
- U.S. Census Bureau TIGER/Line — boundary and geographic data resources
- USGS National Hydrography — hydrography and stream-network data information
- USGS 3D Elevation Program — elevation data information
Green Map creates custom-edited map images using open geographic data sources such as geoBoundaries, Natural Earth, OpenStreetMap, and government open data.
These maps are edited visual materials, not raw data files, and are provided for education, documents, presentations, and graphic reference.