Woodford County is easiest to understand by starting with two contrasts: the low Illinois River edge on the west and the higher rolling ground that fills most of the county to the east. Eureka sits in the south-central part of the map as a useful reference point, while Metamora and Roanoke form separate centers farther north. El Paso lies near the eastern boundary, Minonk is well to the northeast, and Germantown Hills is closer to the Illinois River side. The maps on this page show those settlements with major roads, waterways, and an elevation range of about 135 to 260 meters. The matching high-resolution JPG maps are also available as a downloadable ZIP for closer viewing or printing.
For road orientation, US-24 is one of the clearest lines on the county map. It crosses Eureka and continues east toward El Paso, while IL-116 runs through the Metamora–Roanoke part of the county. IL-26 follows the western side near the Illinois River, and I-39 with US-51 defines a strong north-south route near El Paso and Kappa on the east. I-74 and US-150 appear along the southern edge near Goodfield and Congerville. Those roads make it possible to place the scattered towns before moving to the more detailed water and elevation views.
The physical landscape changes quickly near the river. Dark green on the elevation map marks the broad western lowland, while steep, closely cut slopes rise just east of the Illinois River. Much of the interior is higher, shown in tan and brown, but narrow lower valleys return along Panther Creek, Walnut Creek, and the Mackinaw River system. That combination of river bottom, bluff-like slopes, rolling uplands, and incised stream valleys gives Woodford County a much more varied surface than a simple flat-county description would suggest.
Table of Contents
Eureka anchors a road network that spreads toward Metamora, Roanoke, and El Paso
The general county map places Eureka slightly south of center where US-24 meets a north-south road. Metamora is northwest of Eureka, and Roanoke is farther east along the IL-116 corridor. El Paso sits close to the eastern county line near I-39 and US-51, giving the east side a very different road pattern from the river side. Minonk is near the northeastern edge, while Germantown Hills is farther west, closer to the Illinois River. The major settlements are therefore distributed across the county rather than packed into one continuous urban belt.
Smaller labels help explain the county’s unusual outline. Spring Bay and Bay View Gardens appear near the river on the west. Washburn is shown near the northern edge, Panola is north of El Paso, and Kappa lies in the southeastern section near the US-51 corridor. Goodfield and Congerville sit along the southern road network. The boundary itself has a large inward step on the southwest and several rectangular changes along the south and southeast, so the county cannot be understood as a simple box around Eureka.
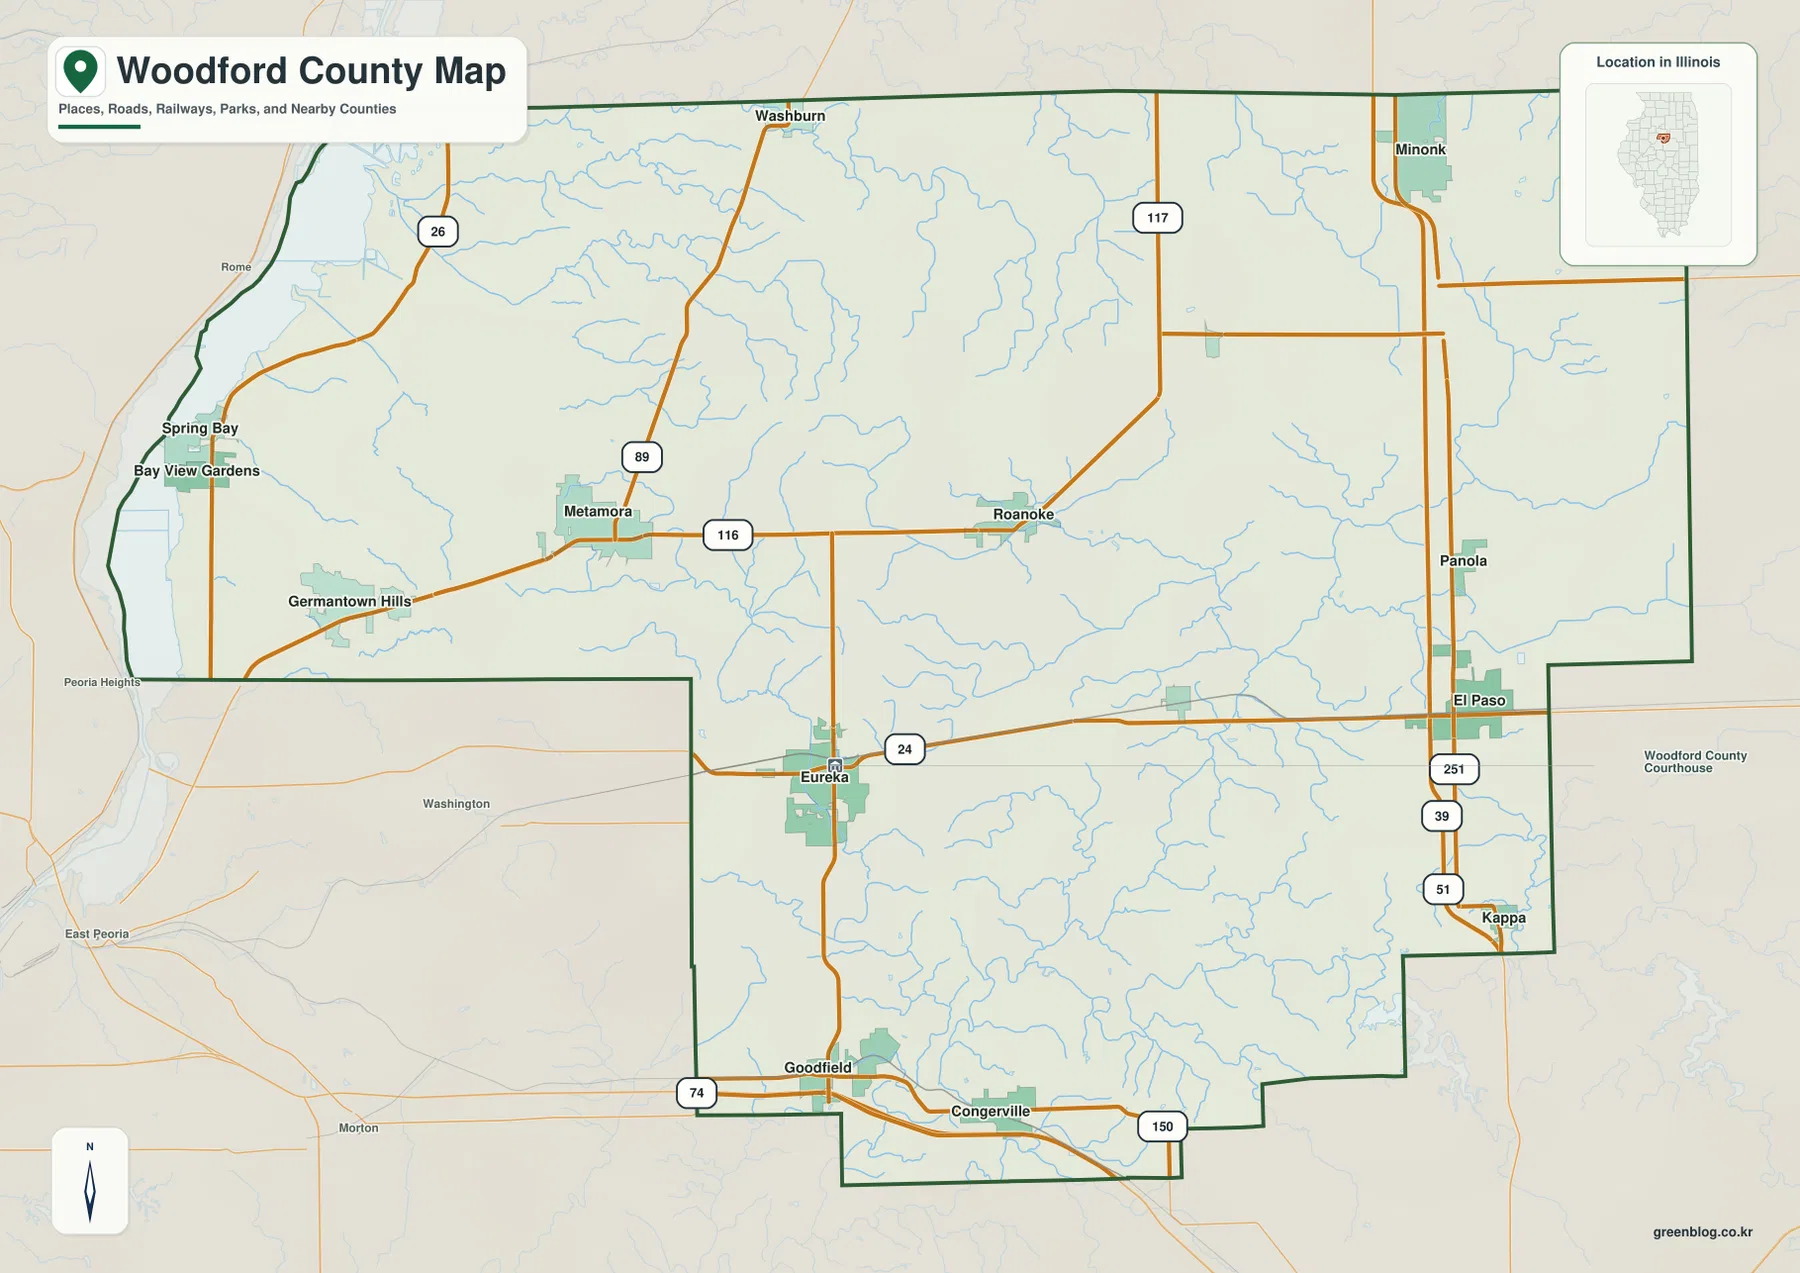
Several state and federal routes make good visual reference lines. IL-26 runs close to the river on the western side, while IL-89 heads north from the Metamora area toward Washburn. IL-117 appears in the north-central and northeastern part of the county, and the I-39/US-51 corridor is prominent near the east side. US-24 is especially useful because it crosses Eureka and continues to El Paso, linking the central-southern part of the county with the eastern transportation corridor.
This map is the best starting point when you need roads, place names, county edges, and nearby communities together. It is not a live traffic or turn-by-turn navigation product. If a trip between Eureka, Metamora, Roanoke, or El Paso is the goal, use the map to establish direction first, then check current road conditions and a navigation service for the actual route and travel time.
Six ranked communities reveal a dispersed settlement pattern
The city-distribution map strips away much of the road detail and highlights six communities. Eureka is ranked first, followed by Metamora, Germantown Hills, El Paso, Roanoke, and Minonk. The reference figures printed in the map are 5,007 for Eureka, 4,159 for Metamora, 3,436 for Germantown Hills, 2,917 for El Paso, 1,967 for Roanoke, and 1,941 for Minonk. These numbers are useful for comparing the places as presented in this map package, but they should not be treated as a substitute for the latest official population estimate.
The locations matter as much as the ranking. Eureka is in the south-central area, Metamora is west-central, and Roanoke is farther east. El Paso sits near the eastern boundary, Germantown Hills occupies the western side, and Minonk is separated from the others in the northeast. There is no single short corridor containing all six. Instead, the map shows a network of separate town centers spread across a broad interior between the Illinois River and the eastern county line.
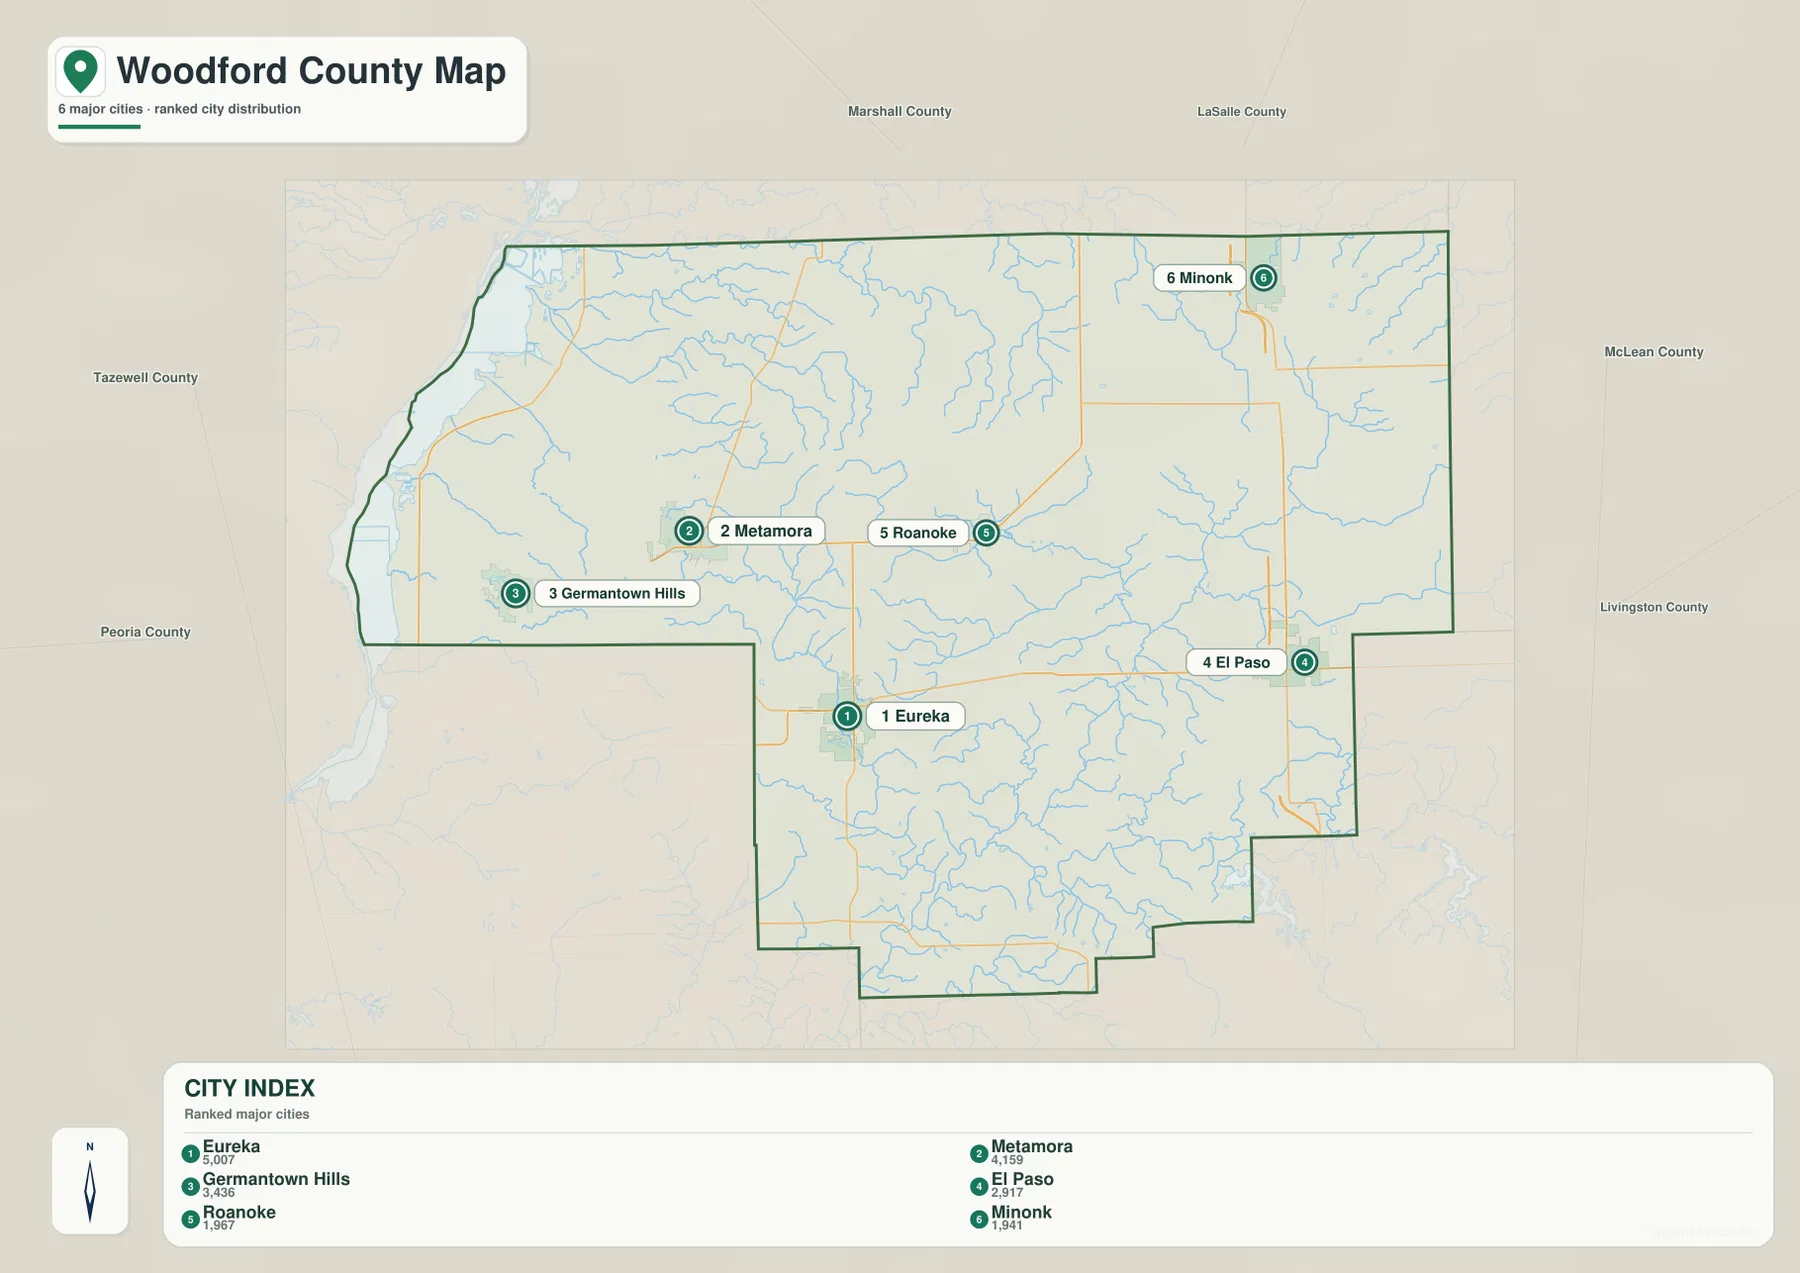
Neighboring county labels around the frame add another layer of orientation. Tazewell and Peoria counties appear to the west and southwest, Marshall lies to the north, LaSalle is farther north and northeast, and McLean and Livingston are on the eastern side. This helps explain why the western communities visually relate to the Illinois River and Peoria-area side, while El Paso and Minonk sit much closer to the eastern and northeastern edges of Woodford County.
The city map does not provide driving distances or travel times. It is most useful for seeing relative direction and separation without the clutter of every road and creek. After identifying the six places here, switch back to the county map to see which route connects them. That two-step approach is particularly helpful for Eureka and El Paso along US-24 or Metamora and Roanoke along IL-116.
The Illinois River lowland gives way to Panther Creek and Mackinaw River valleys
The terrain-and-water map is dominated by the Illinois River along the western edge. A broad low water-and-bottomland zone occupies that side of the county, with Douglas Lake labeled in the northwest. Richland Creek and White Oak Lake appear farther south, while Snag Creek crosses the northern part of the county toward the river. East of the river, the waterways become narrower and branch through the rolling interior rather than forming one broad lowland.
Partridge River and Walnut Creek are labeled in the central portion of the map, and Eureka Lake provides a recognizable local water body near Eureka. Farther east, West Branch Panther Creek and Panther Creek create a more pronounced drainage line through the east-central and southeastern interior. The Mackinaw River is labeled near the southern and southeastern part of the county, with additional tributary valleys approaching it. Barwell Lake is also marked in the south.
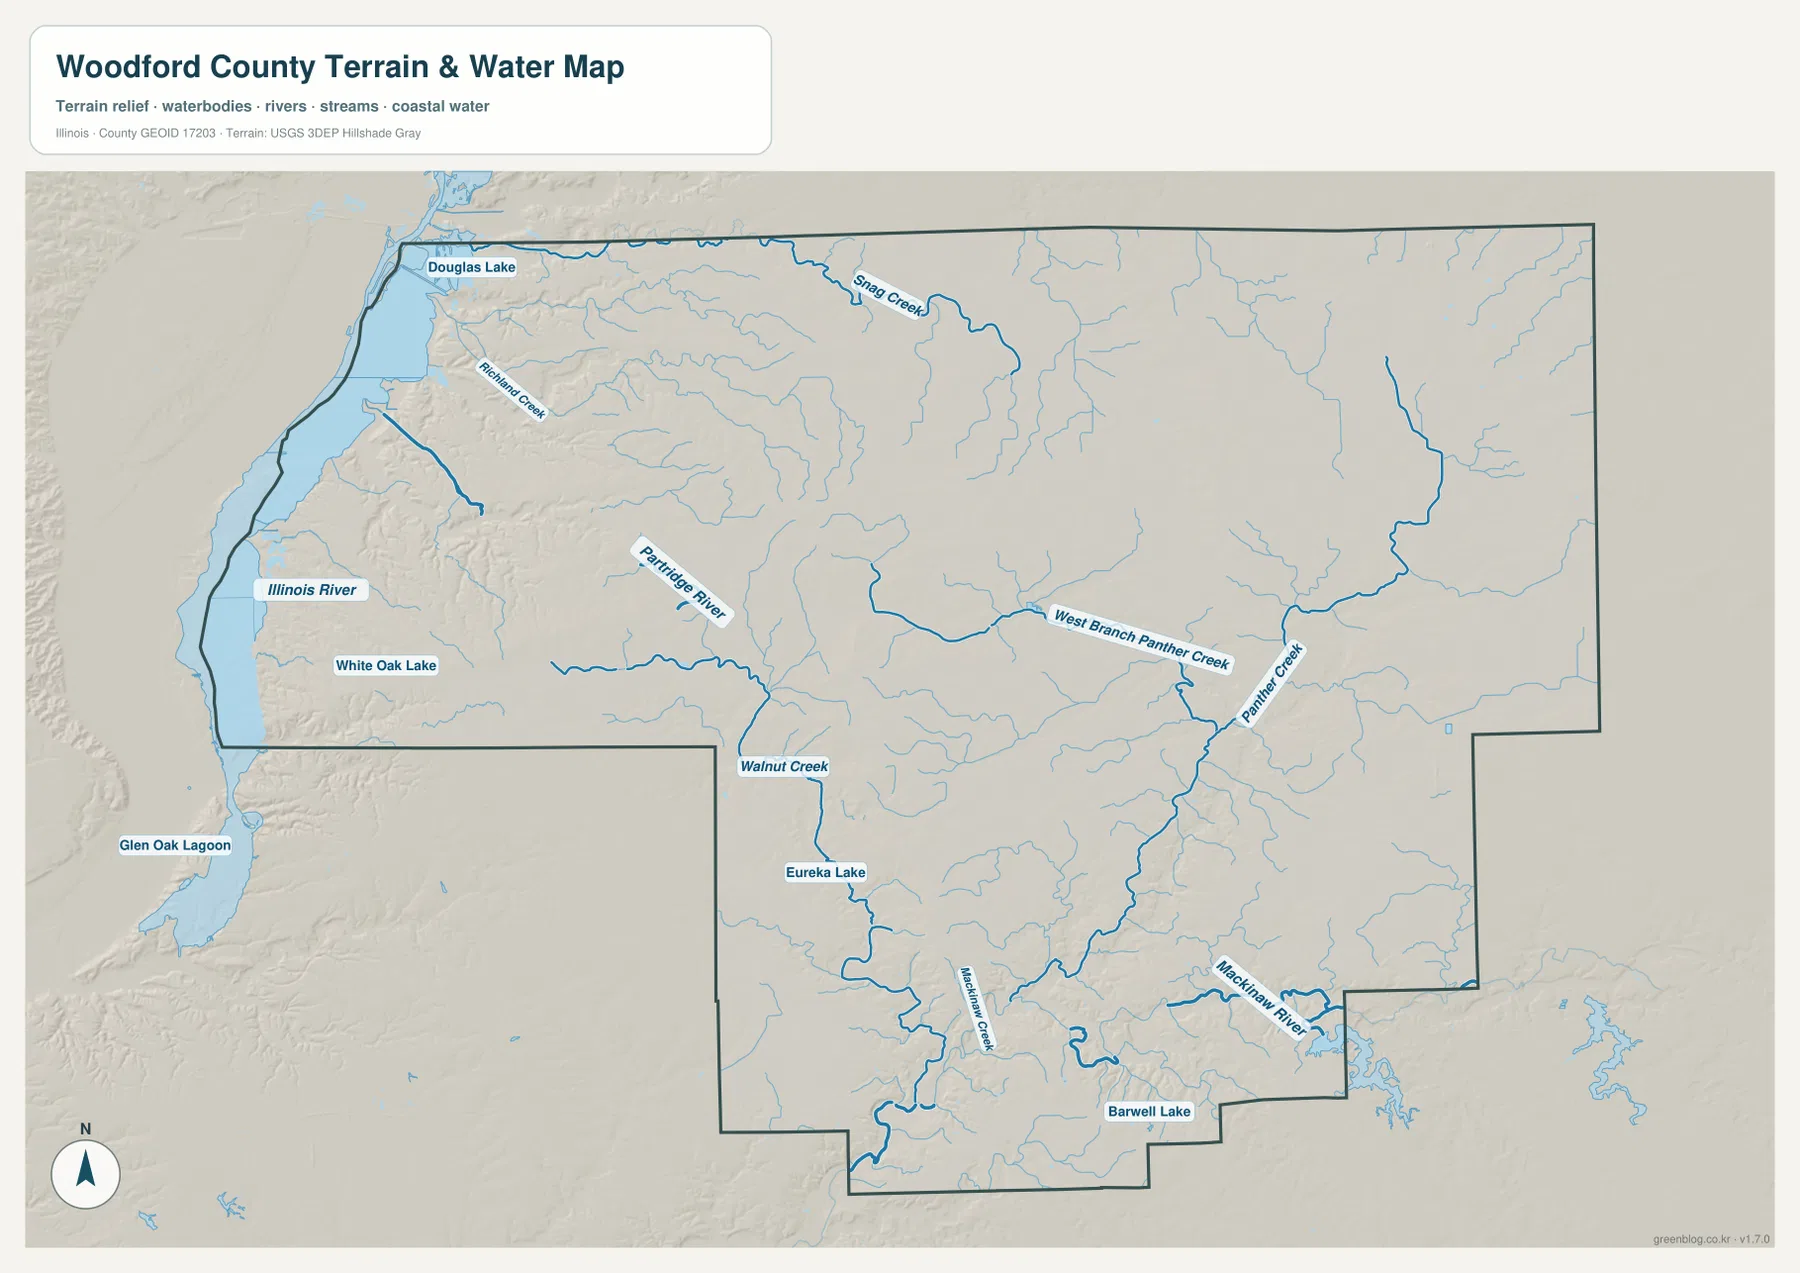
The difference between the west and the interior is important. The Illinois River side is broad and open, with larger water bodies and a wide low strip. The central and eastern sections are cut by smaller branching streams that occupy narrower valleys between higher ground. The water map therefore does more than locate named rivers: it shows why the western edge looks fundamentally different from the upland interior on the elevation map.
This graphic is a reference map for water location and terrain context, not a flood-risk, depth, navigation, parcel, or legal-boundary product. A blue channel tells you where a stream or river is emphasized, not whether a site is safe from flooding or whether the channel is navigable. For floodplain, water-management, engineering, or property questions, use the current official source designed for that purpose.
A 135–260 m elevation range separates the river floor from the higher interior
The elevation map gives Woodford County an actual range of about 135 to 260 meters, with a mean near 216 meters. The lowest ground is the dark green strip along the Illinois River on the west. Moving east from the river, the colors change quickly through green and yellow into tan and brown. The northwest is especially detailed, where narrow valleys cut into steeper slopes immediately beside the river lowland.
Most of the central, northern, and northeastern interior is higher than the river edge. Broad tan and brown areas occupy the uplands, but stream valleys create narrow lower ribbons that break up the surface. In the south, the terrain remains mostly elevated while lower corridors follow the Mackinaw River system. The result is a county with a pronounced west-to-east rise near the Illinois River and a rolling interior dissected by many creeks.
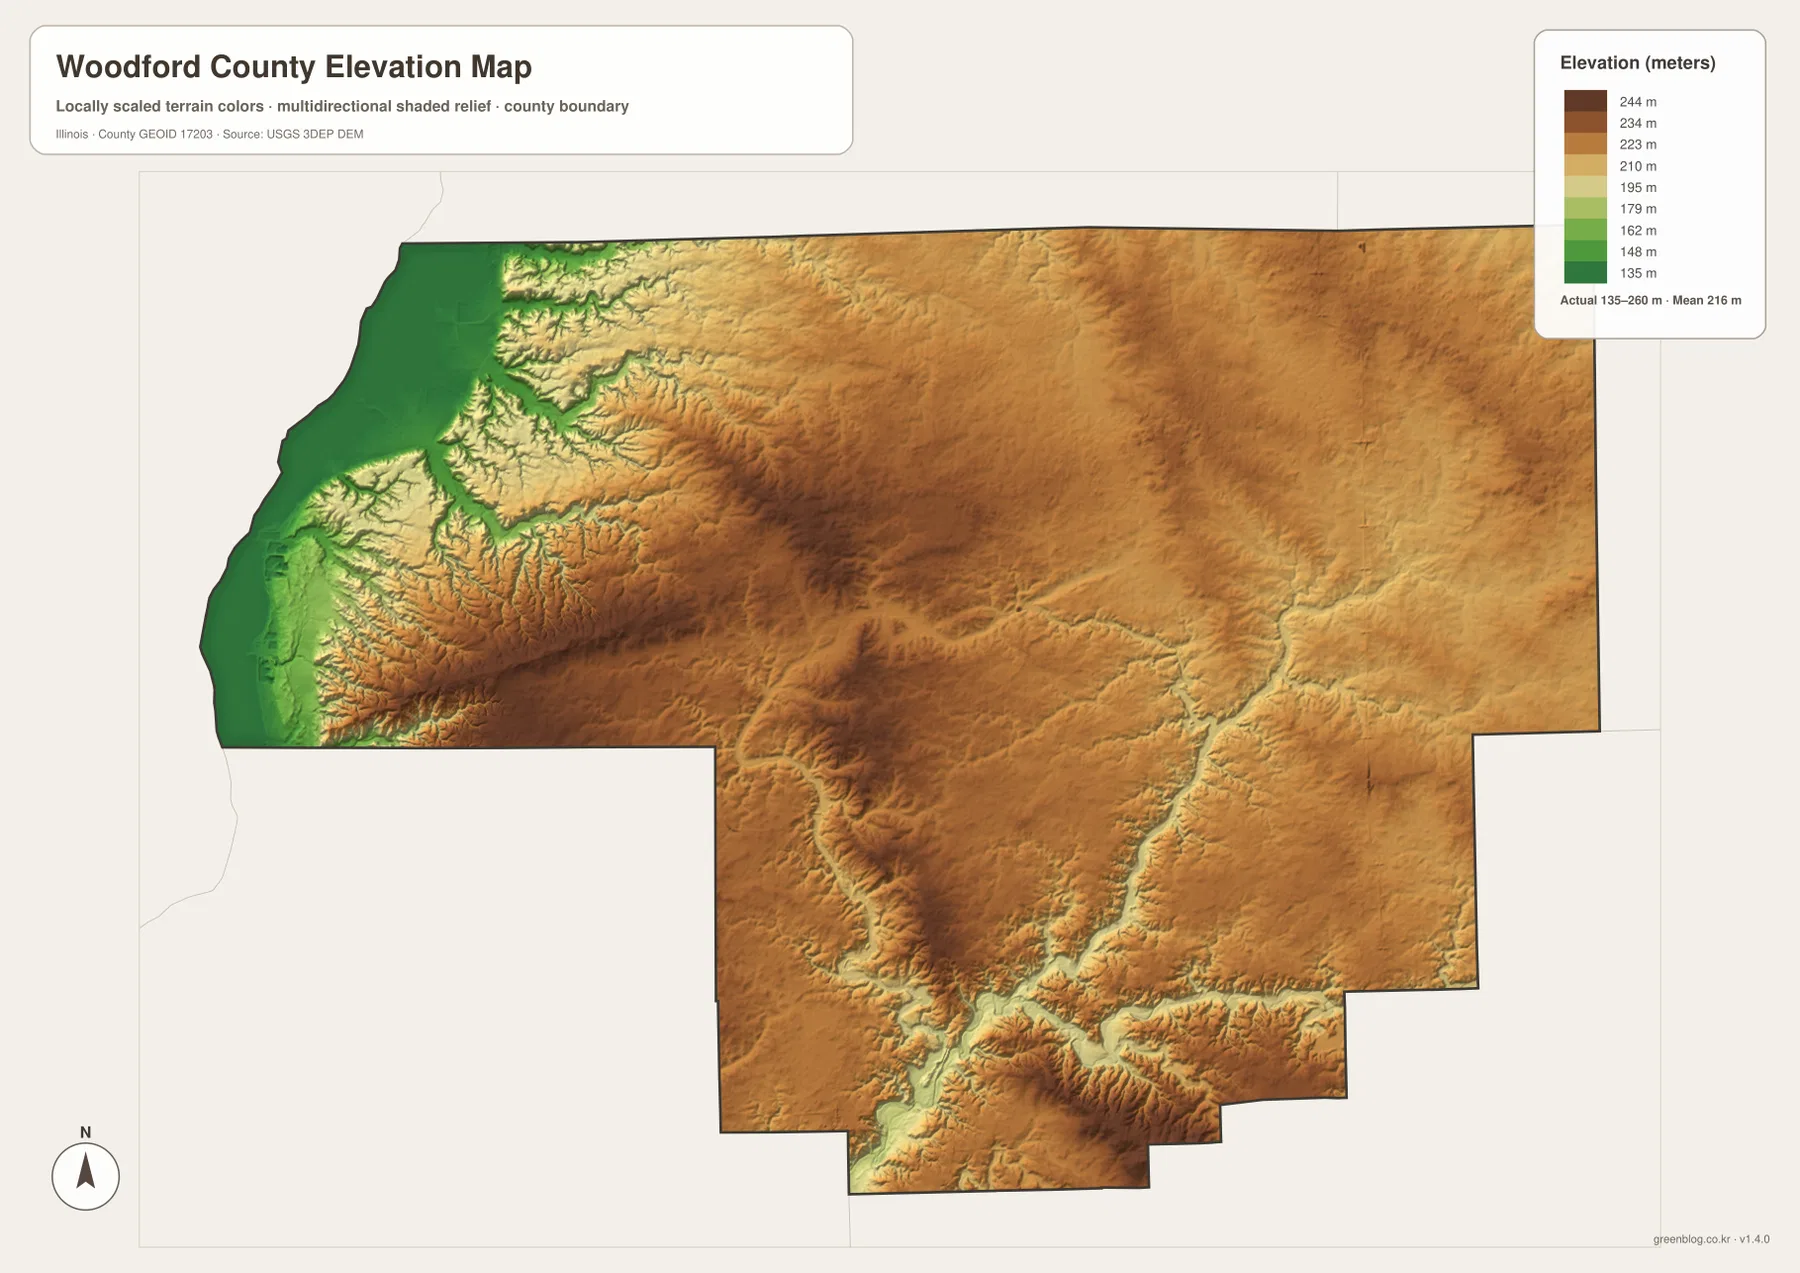
Comparing the elevation and water maps makes the drainage pattern easier to understand. The Illinois River coincides with the county’s widest low zone, while Panther Creek, Walnut Creek, and the Mackinaw River occupy narrower low corridors farther inland. Eureka and Roanoke sit in terrain that is generally higher than the river floor, while Spring Bay lies much closer to the low western edge. These differences do not by themselves explain every settlement or road, but they provide useful physical context for the county map.
The elevation image is a county-scale surface, not survey-grade measurement for a parcel, road, bridge, or construction project. The 135–260 meter range is appropriate for comparing the river lowland, slopes, and uplands across the county. Engineering, drainage design, grading, or property-specific work requires more detailed authoritative elevation data or a professional survey.
Match the map to the question you have about Woodford County
Use the general county map first when you need to connect Eureka with Metamora, Roanoke, El Paso, Minonk, Germantown Hills, or the river-side communities. It keeps the county outline, main roads, settlement labels, and smaller water features on one page. The city-distribution map is better when the only question is where the six ranked communities sit relative to one another. It removes most of the road detail so the dispersed settlement pattern is easier to see.
For the landscape, pair the water and elevation maps. The water map identifies the Illinois River, Panther Creek, Mackinaw River, and smaller lakes and tributaries. The elevation map then shows which waterways occupy the lowest ground and where the county rises into higher rolling terrain. This comparison is especially revealing on the west side, where the Illinois River lowland changes rapidly into steeply cut hills, and in the southeast where creek valleys cross the uplands.
The WebP images on the page are optimized for quick viewing. The downloadable ZIP contains the corresponding original JPG maps at 3638 × 2572 pixels each, making small labels and stream lines easier to inspect and giving more room for printing. Keeping all four files is useful because no single version can show roads, ranked communities, waterways, and terrain with equal clarity.
Frequently Asked Questions
Which map is best for comparing Eureka with Metamora, Roanoke, and El Paso?
Start with the general county map if you need roads as well as place names. It shows Eureka on US-24, Metamora and Roanoke along the IL-116 corridor, and El Paso near I-39 and US-51. The city-distribution map is cleaner when you only need the relative positions of the six ranked communities. Neither image provides live traffic conditions or actual driving times.
What causes the strongest terrain contrast on the Woodford County maps?
The most obvious contrast is between the low Illinois River corridor on the west and the higher interior immediately to its east. The elevation map drops to about 135 meters along the river side and rises into tan and brown uplands farther inland. The water map reinforces the same pattern by showing the broad Illinois River lowland and narrower creek valleys crossing the higher interior.
Are the downloadable files the same maps shown on the page?
Yes. The ZIP contains high-resolution JPG versions of the general county map, city-distribution map, terrain-and-water map, and elevation map described here. Each image is 3638 × 2572 pixels, which is more convenient for zooming and printing than the page-sized WebP previews. The maps remain general reference products and should not replace legal surveys, flood determinations, or engineering plans.
Map File Information
The ZIP contains the high-resolution JPG versions of the Woodford County reference map, city-distribution map, terrain-and-water map, and elevation map shown on this page.
- Included Files: 4 high-resolution JPG maps
- Printable Size: 3638 × 2572 px each
Related Maps
Sources and References
- Woodford County, Illinois – official county government information
- Illinois Department of Natural Resources – Woodford State Fish & Wildlife Area – official information about the Illinois River-side natural area
- U.S. Census Bureau TIGER/Line Shapefiles – county boundaries, roads, and place references
- USGS National Hydrography – rivers, streams, and water features
- USGS 3D Elevation Program – elevation data
Green Map creates custom-edited map images using open geographic data sources such as geoBoundaries, Natural Earth, OpenStreetMap, and government open data.
These maps are edited visual materials, not raw data files, and are provided for education, documents, presentations, and graphic reference.