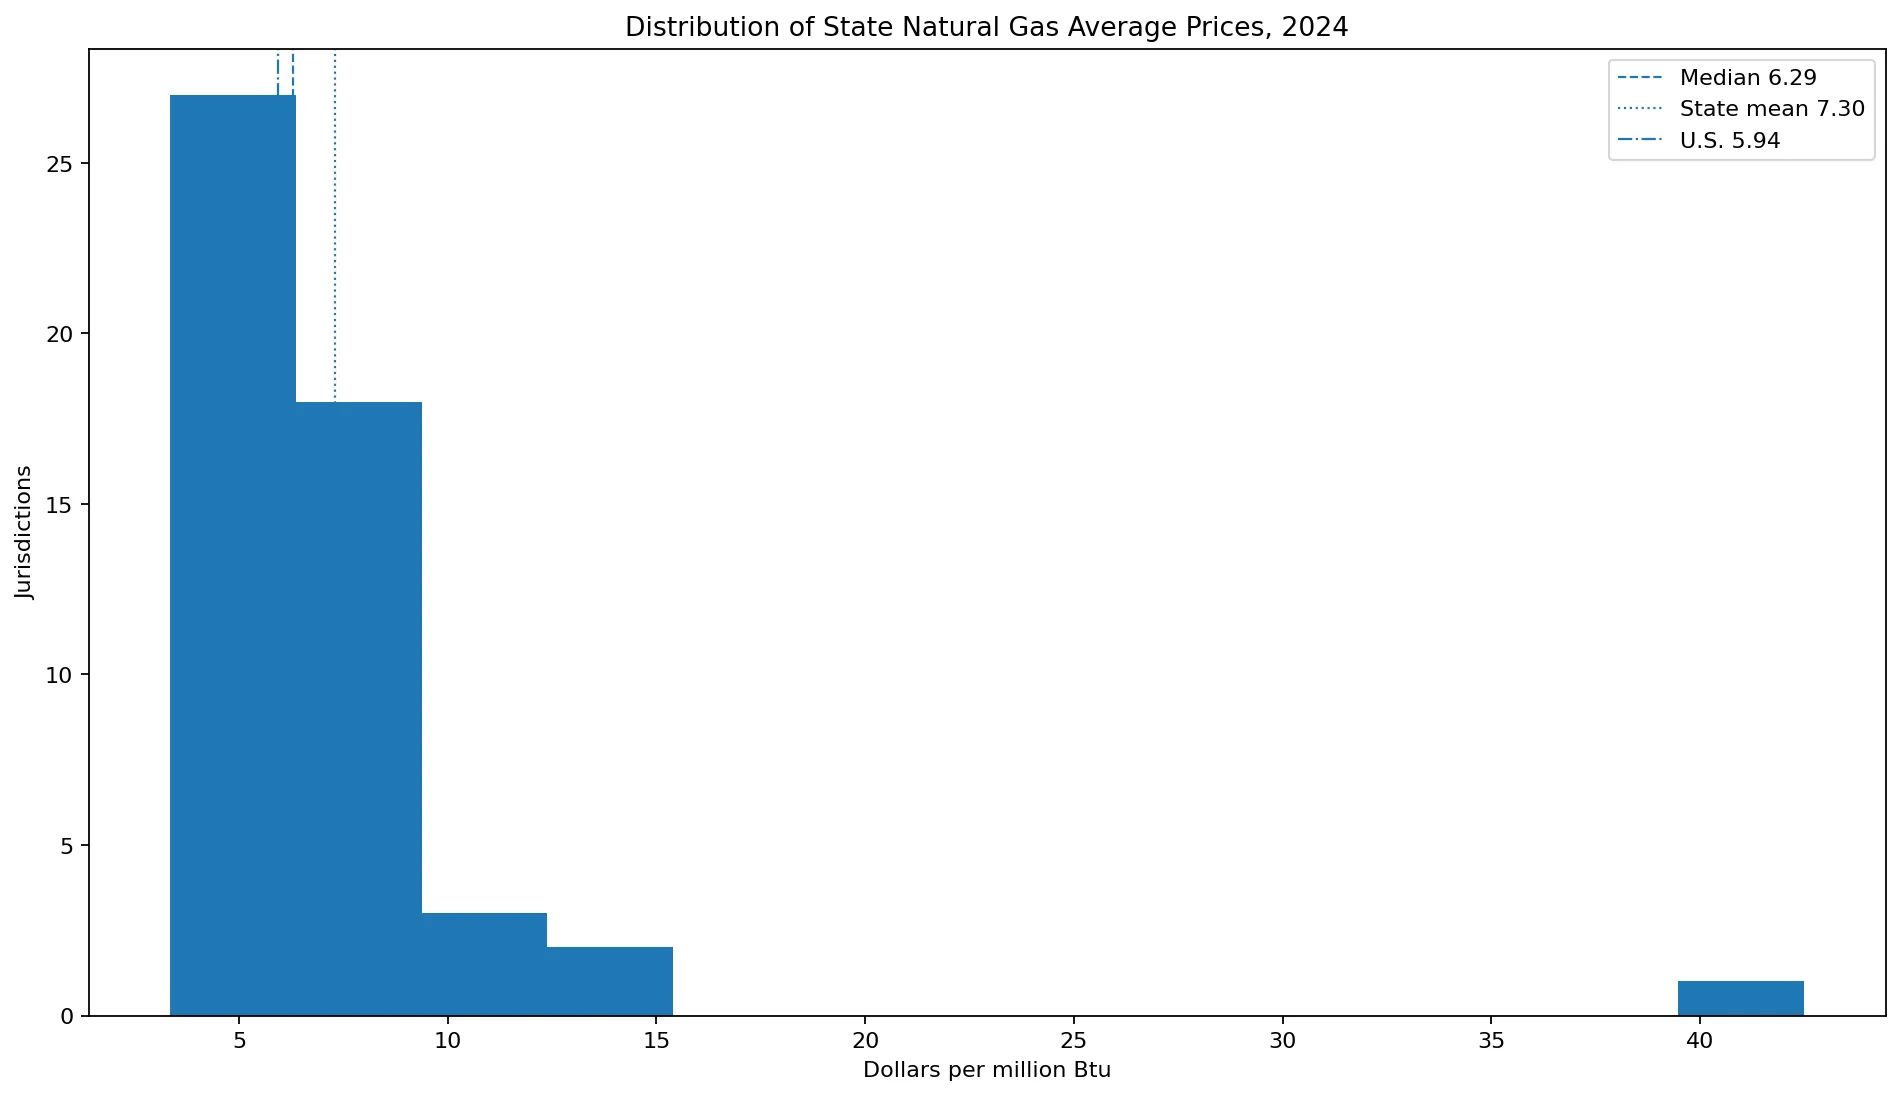
Natural gas average prices across all sectors varied widely by U.S. state in 2024. In EIA’s State Energy Data System, Hawaii had the highest value at $42.49 per million Btu. The District of Columbia followed at $14.59, Massachusetts at $13.44, and California at $10.87. Texas was lowest at $3.36/MMBtu. The unweighted mean across the 50 states and D.C. was about $7.30 and the median was $6.29, while EIA’s U.S. all-sector natural gas price was $5.94/MMBtu.
The phrase “all sectors” does not mean EIA simply averages five published sector prices. The NGTCD series combines residential, commercial, industrial, transportation vehicle-fuel, and electric-power expenditures and divides total expenditures by natural gas consumption adjusted for expenditure calculations. A state’s overall price therefore reflects both sector-specific prices and the amount of gas consumed in each sector.
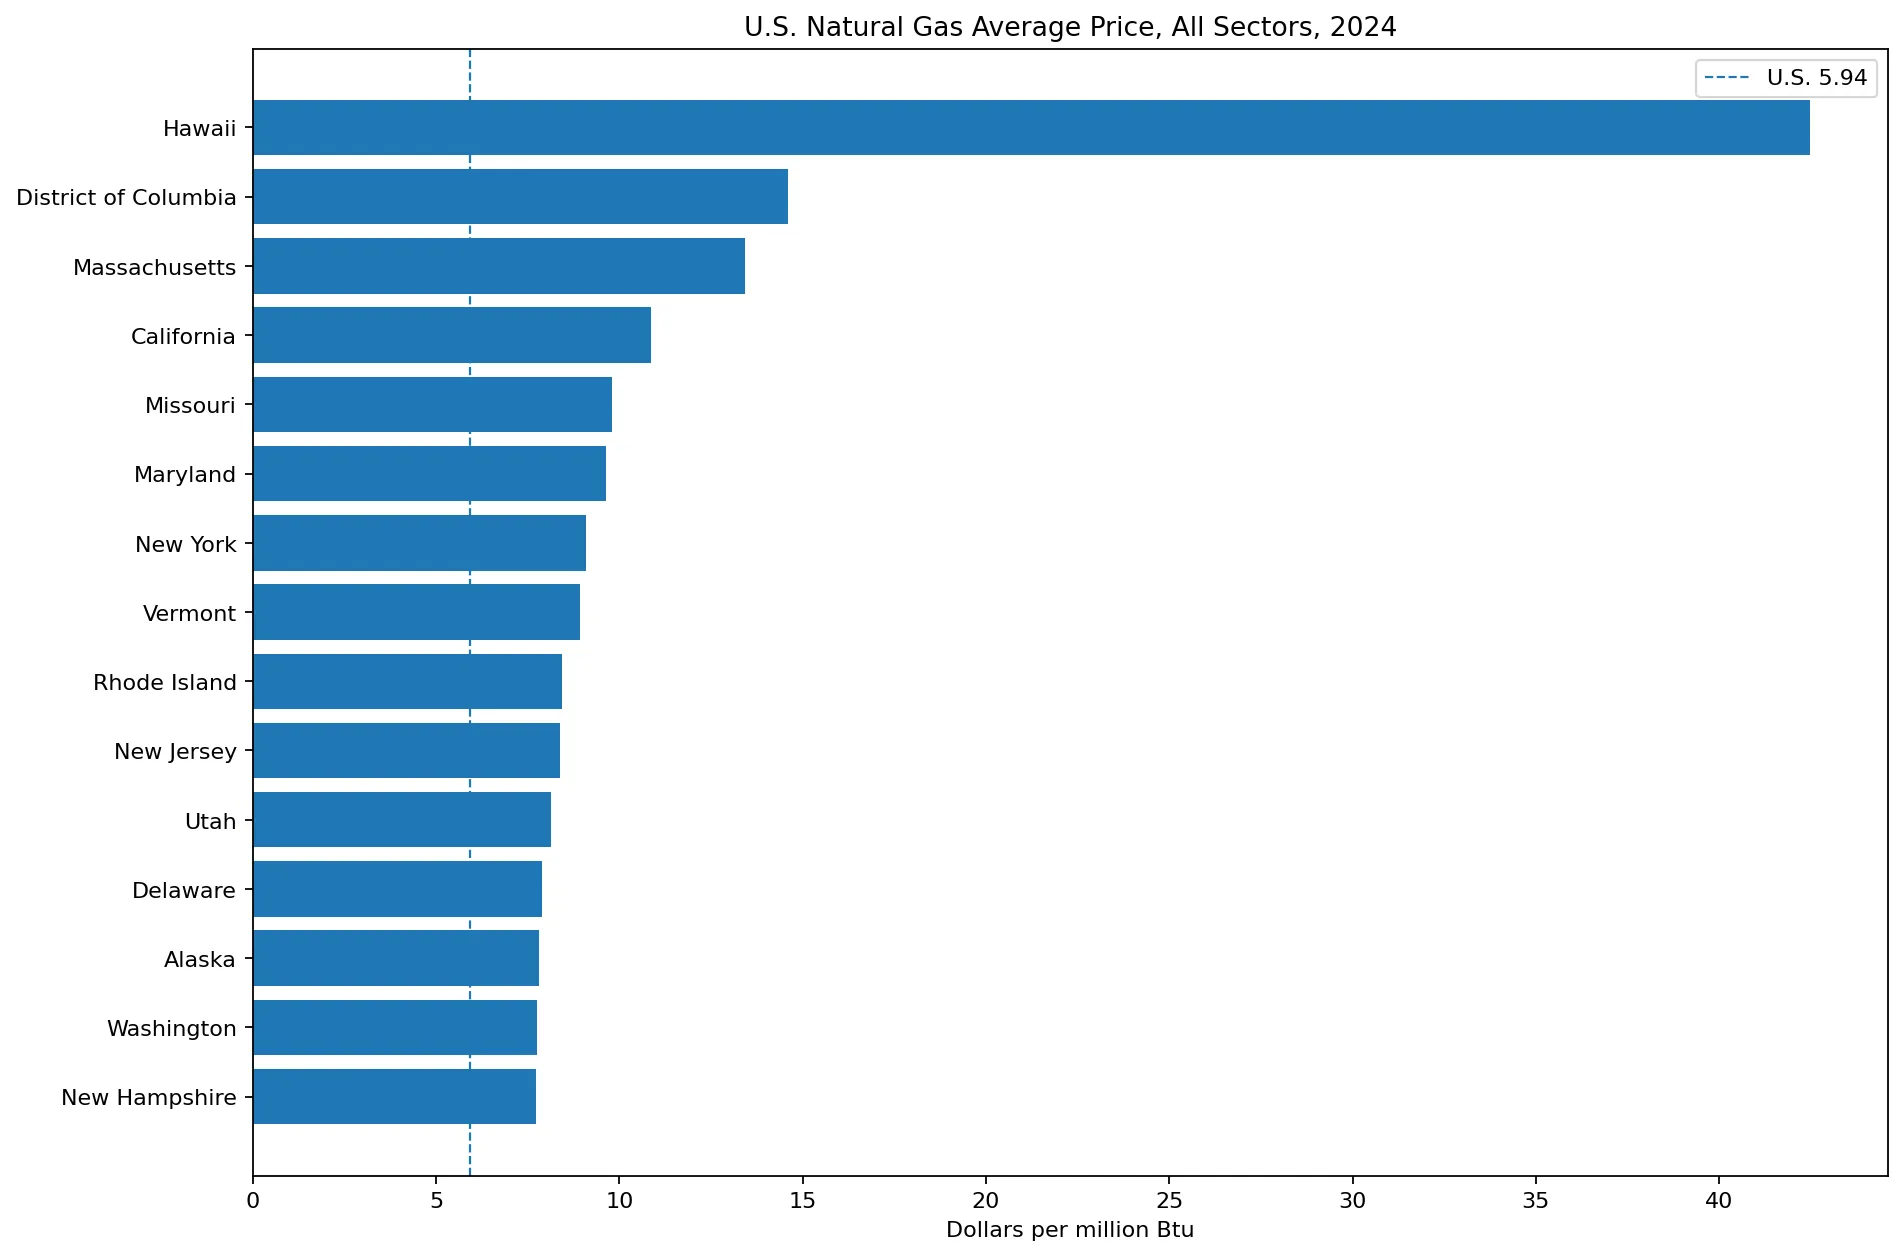
Table of Contents
What the all-sector natural gas price measures
EIA Table F33 separates natural gas prices into residential, commercial, industrial, transportation, and electric power sectors and then provides a Total column. The transportation price applies to natural gas used as vehicle fuel. SEDS removes pipeline and distribution fuel from the transportation consumption used for expenditures, and it adjusts industrial consumption to exclude refinery fuel and lease and plant fuel.
These adjustments matter because price and expenditure estimates are intended to correspond to gas that has a customer expenditure attached to it. The all-sector price, NGTCD, is calculated as total natural gas expenditures divided by adjusted total natural gas consumption, multiplied by 1000 to express the result in dollars per million Btu.
The definition also includes supplemental gaseous fuels. These are small quantities of gases introduced into or commingled with natural gas, including examples such as synthetic natural gas, renewable natural gas, propane-air, coke oven gas, refinery gas, biomass gas, manufactured gas, and gases used for Btu stabilization. SEDS handles double-counting separately when building total-energy accounts.
Hawaii is a clear high-price outlier
Hawaii’s $42.49/MMBtu all-sector price is about 2.9 times the District of Columbia’s $14.59 and roughly 7.2 times EIA’s U.S. value of $5.94. Table F33 shows Hawaii at $53.25 in the residential sector, $40.01 in commercial, and $30.88 in industrial, with no transportation or electric-power natural gas consumption reported in the table.
That sector profile is important. In many mainland states, large volumes of relatively low-priced natural gas are consumed by electric generators and industry, pulling the all-sector average below residential and commercial rates. Hawaii lacks that same reported power-sector gas component in Table F33, while its observed end-use sector prices are extremely high.
The dataset itself does not establish a single reason for Hawaii’s high level. Island fuel logistics, infrastructure, market scale, fuel availability, and the composition of gas supply can all matter. A state price table is useful for documenting the outcome but not for assigning causality without additional market data.
Texas has the lowest all-sector price
Texas records $3.36/MMBtu, followed by Louisiana at $3.49, North Dakota at $3.62, New Mexico at $3.65, Mississippi at $3.72, Alabama at $4.13, and Oklahoma at $4.38. Arizona and Florida are in the mid-$4 range, and Wyoming is $4.80.
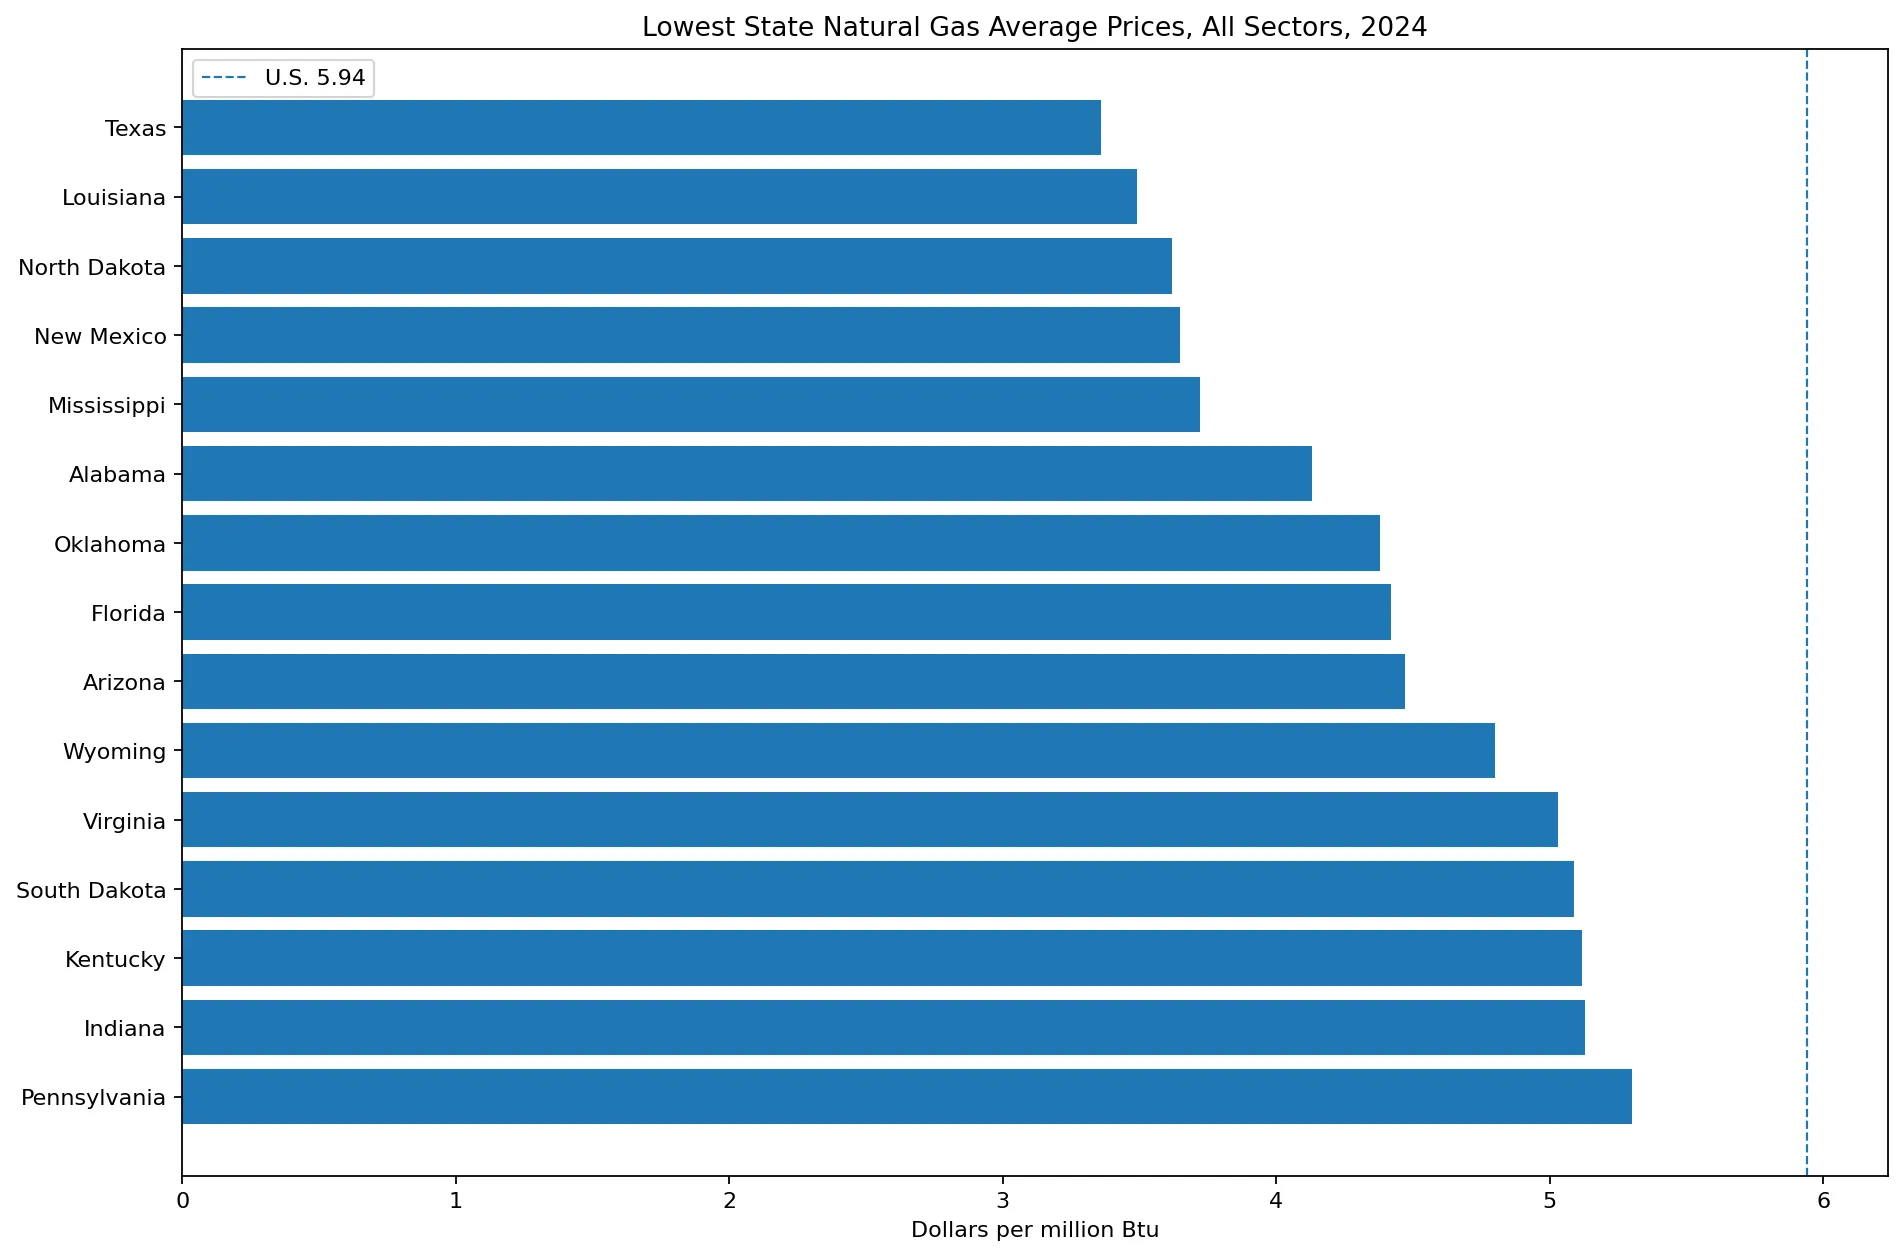
Table F33 helps explain why Texas can have a low Total even though residential customers pay much more. Texas’s residential price is $17.64/MMBtu, but its industrial price is $2.47 and its electric-power price is $2.14. Because Texas uses very large quantities of natural gas in industry and electricity generation, those lower-priced sectors can exert strong downward pressure on the all-sector average.
This is why the Total column should not be used as a household gas-bill measure. A homeowner, industrial facility, vehicle-fuel user, and power plant can face very different prices in the same state. The all-sector number is an aggregate energy-accounting price across those uses.
Why the U.S. price is below the simple state average
The unweighted average of the 51 state and D.C. observations is about $7.30/MMBtu. EIA’s U.S. Total is $5.94. The difference is substantial because the national value is not the arithmetic average of state prices. EIA derives the national price from U.S. expenditures and U.S. adjusted natural gas consumption.
Large gas-consuming states such as Texas, California, Pennsylvania, Louisiana, and others therefore have far more influence on the U.S. number than a one-state-one-vote average would give them. High-price jurisdictions can appear near the top of the ranking while accounting for a relatively small share of national gas consumption.
The median of $6.29 answers a different question: it marks the middle state-level observation. For describing a typical jurisdiction, the median can be useful. For describing the effective average price across U.S. natural gas use included in the expenditure calculation, the EIA national value of $5.94 is the appropriate reference.
The state distribution is much tighter without Hawaii
The first quartile is about $5.13 and the third quartile about $7.78/MMBtu. Half of the 51 jurisdictions therefore fall inside a band only about $2.66 wide. The full range from $3.36 to $42.49 looks enormous mainly because Hawaii is such an extreme upper observation.
The simple state mean of $7.30 is also pushed upward by Hawaii and, to a lesser extent, the District of Columbia and Massachusetts. The fact that the mean exceeds the median is a classic sign of a right-skewed distribution. Reporting the median alongside the mean gives a better picture of the typical state.
All sectors is different from all end-use sectors
SEDS also publishes NGTXD, the natural gas average price for all end-use sectors. That measure excludes electric-power consumption from the denominator and electric-power expenditures from the numerator. NGTCD, the series used here, includes electric power. The distinction can be large in states where power plants consume large quantities of low-priced gas.
California illustrates the sector mix clearly. Its 2024 prices in Table F33 are $18.44 residential, $13.50 commercial, $11.06 industrial, $10.12 transportation, and $3.83 electric power, while the all-sector Total is $10.87. The low power-sector price and large power-sector consumption help pull the aggregate below the residential and commercial levels.
What supplemental gaseous fuels means
SEDS natural gas estimates include small quantities of supplemental gaseous fuels that are introduced into or mixed with natural gas. EIA examples include synthetic natural gas, renewable natural gas, propane-air, coke oven gas, refinery gas, biomass gas, manufactured gas, and air injected for Btu stabilization.
Because many supplemental gaseous fuels originate from fossil fuels or biomass that can already be counted elsewhere as primary energy, SEDS makes separate adjustments when calculating total energy consumption to avoid double counting. For the natural gas price and expenditure series, however, the public definition remains natural gas including supplemental gaseous fuels.
The ranking reflects sector mix, not just wholesale gas markets
The ranked curve shows Hawaii far above the rest, followed by the District of Columbia and Massachusetts. California is the only other jurisdiction above $10. Most states cluster from roughly $5 to $8, while several producing and industrial states occupy the $3–$5 range.
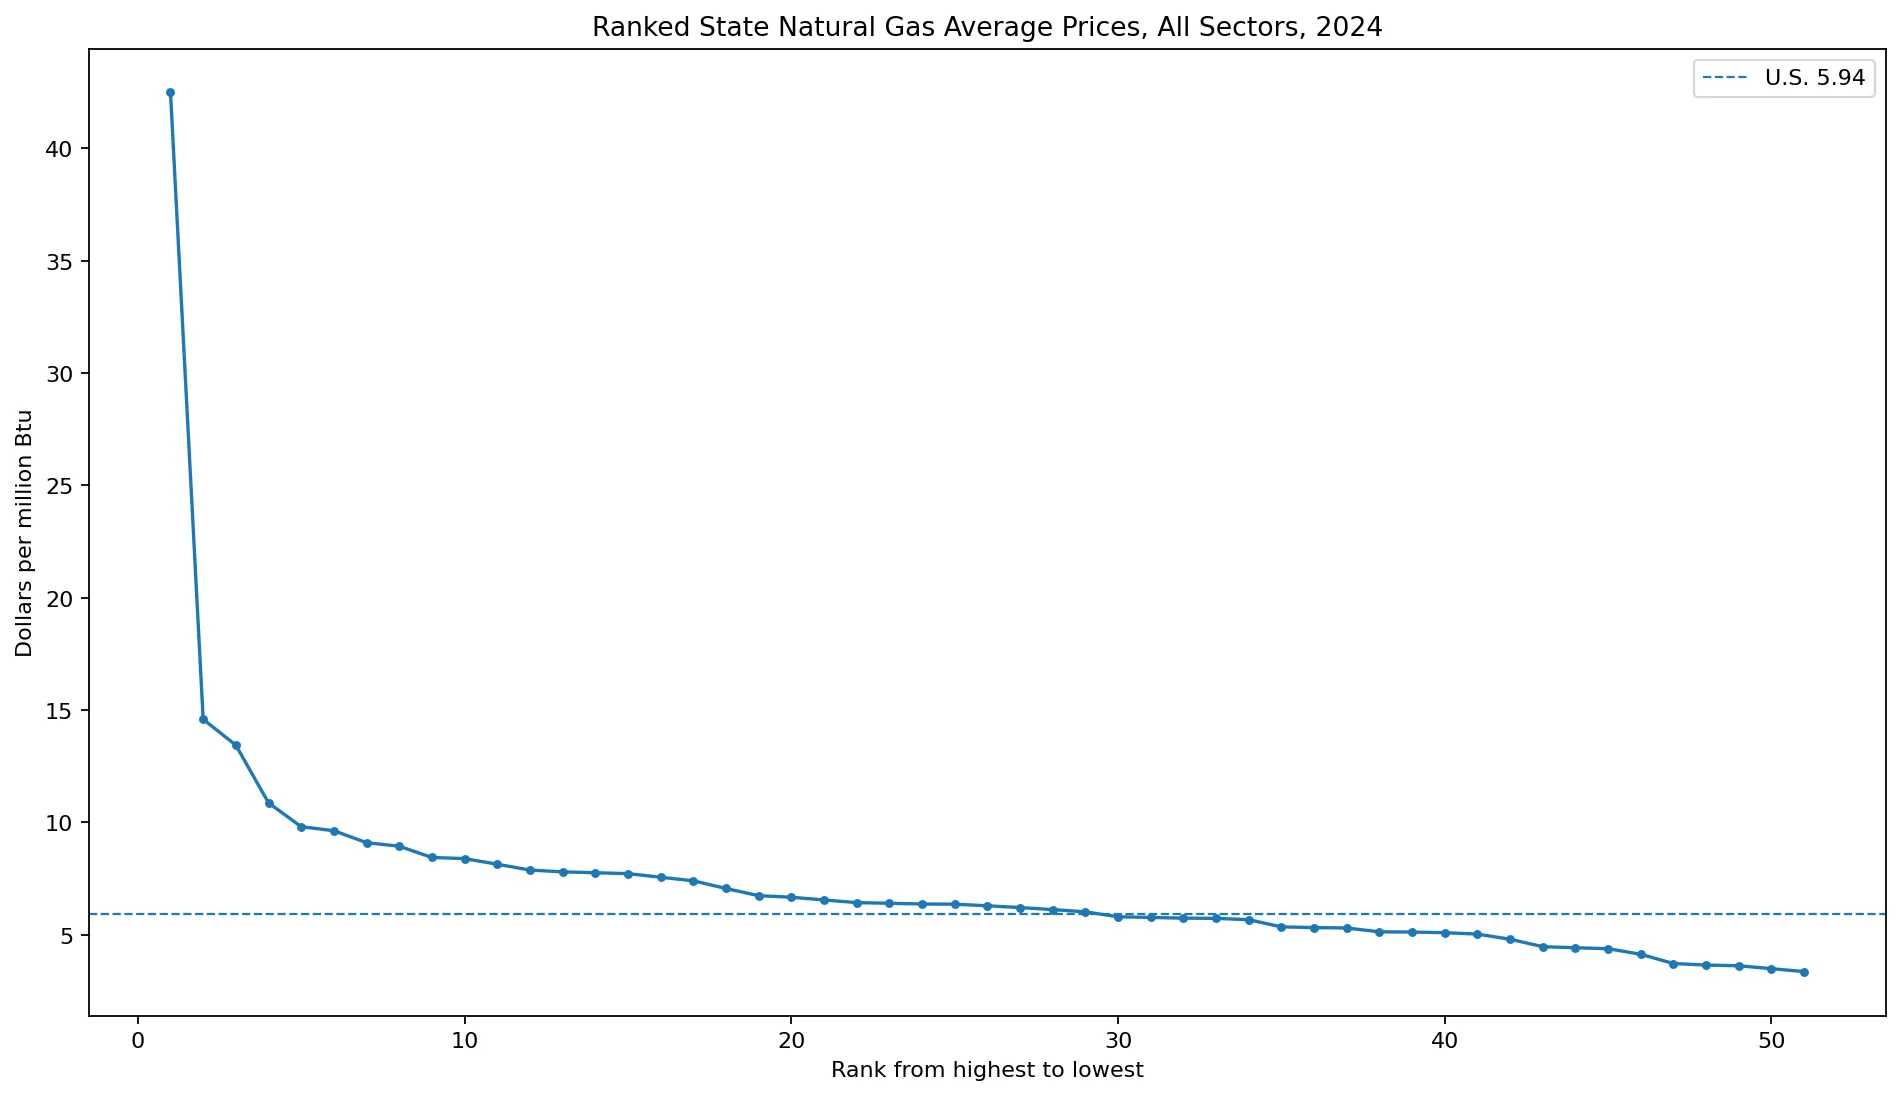
That ranking should not be described as a wholesale natural gas market ranking. NGTCD combines customer prices, electric-power fuel prices, sector consumption weights, and expenditure adjustments. A sector-specific comparison should use the corresponding residential, commercial, industrial, transportation, or electric-power column instead.
Official EIA references
EIA Table F33 provides 2024 natural gas prices and expenditures for the residential, commercial, industrial, transportation, electric-power, and total categories. Its notes specify that the estimates include supplemental gaseous fuels.
The 2024 SEDS price and expenditure variable definitions define NGTCD as the natural gas average price for all sectors and provide the formula NGTCD = NGTCV ÷ NGSCB × 1000. EIA’s natural gas price documentation explains the sector price definitions and expenditure-related consumption adjustments.
All 51 jurisdictions in 2024
The table below lists the 50 states and the District of Columbia from highest to lowest 2024 all-sector natural gas average price. All 51 observations are positive and the unit is dollars per million Btu.
| Rank | State | Code | Year | $/MMBtu |
|---|---|---|---|---|
| 1 | Hawaii | HI | 2024 | 42.49 |
| 2 | District of Columbia | DC | 2024 | 14.59 |
| 3 | Massachusetts | MA | 2024 | 13.44 |
| 4 | California | CA | 2024 | 10.87 |
| 5 | Missouri | MO | 2024 | 9.81 |
| 6 | Maryland | MD | 2024 | 9.63 |
| 7 | New York | NY | 2024 | 9.10 |
| 8 | Vermont | VT | 2024 | 8.94 |
| 9 | Rhode Island | RI | 2024 | 8.44 |
| 10 | New Jersey | NJ | 2024 | 8.39 |
| 11 | Utah | UT | 2024 | 8.14 |
| 12 | Delaware | DE | 2024 | 7.88 |
| 13 | Alaska | AK | 2024 | 7.80 |
| 14 | Washington | WA | 2024 | 7.76 |
| 15 | New Hampshire | NH | 2024 | 7.72 |
| 16 | Illinois | IL | 2024 | 7.56 |
| 17 | Maine | ME | 2024 | 7.40 |
| 18 | Nevada | NV | 2024 | 7.06 |
| 19 | Connecticut | CT | 2024 | 6.74 |
| 20 | Colorado | CO | 2024 | 6.67 |
| 21 | Kansas | KS | 2024 | 6.55 |
| 22 | West Virginia | WV | 2024 | 6.43 |
| 23 | Montana | MT | 2024 | 6.40 |
| 24 | Georgia | GA | 2024 | 6.37 |
| 25 | Minnesota | MN | 2024 | 6.36 |
| 26 | North Carolina | NC | 2024 | 6.29 |
| 27 | Michigan | MI | 2024 | 6.21 |
| 28 | Arkansas | AR | 2024 | 6.12 |
| 29 | Ohio | OH | 2024 | 6.02 |
| 30 | Wisconsin | WI | 2024 | 5.80 |
| 31 | Nebraska | NE | 2024 | 5.77 |
| 32 | Iowa | IA | 2024 | 5.74 |
| 33 | South Carolina | SC | 2024 | 5.73 |
| 34 | Oregon | OR | 2024 | 5.67 |
| 35 | Idaho | ID | 2024 | 5.35 |
| 36 | Tennessee | TN | 2024 | 5.32 |
| 37 | Pennsylvania | PA | 2024 | 5.30 |
| 38 | Indiana | IN | 2024 | 5.13 |
| 39 | Kentucky | KY | 2024 | 5.12 |
| 40 | South Dakota | SD | 2024 | 5.09 |
| 41 | Virginia | VA | 2024 | 5.03 |
| 42 | Wyoming | WY | 2024 | 4.80 |
| 43 | Arizona | AZ | 2024 | 4.47 |
| 44 | Florida | FL | 2024 | 4.42 |
| 45 | Oklahoma | OK | 2024 | 4.38 |
| 46 | Alabama | AL | 2024 | 4.13 |
| 47 | Mississippi | MS | 2024 | 3.72 |
| 48 | New Mexico | NM | 2024 | 3.65 |
| 49 | North Dakota | ND | 2024 | 3.62 |
| 50 | Louisiana | LA | 2024 | 3.49 |
| 51 | Texas | TX | 2024 | 3.36 |
Frequently Asked Questions
Which jurisdiction had the highest all-sector natural gas price in 2024?
Hawaii was highest at $42.49/MMBtu, followed by the District of Columbia at $14.59 and Massachusetts at $13.44.
Which state had the lowest all-sector natural gas price?
Texas was lowest at $3.36/MMBtu, followed by Louisiana at $3.49 and North Dakota at $3.62.
Is the all-sector price a simple average of sector prices?
No. EIA calculates NGTCD from total natural gas expenditures divided by consumption adjusted for expenditure calculations, so sector consumption weights matter.
What was the U.S. all-sector natural gas price in 2024?
EIA Table F33 reports $5.94 per million Btu for the United States.
Related Articles
Green Map creates custom-edited map images using open geographic data sources such as geoBoundaries, Natural Earth, OpenStreetMap, and government open data. These maps are edited visual materials, not raw data files, and are provided for education, documents, presentations, and graphic reference.