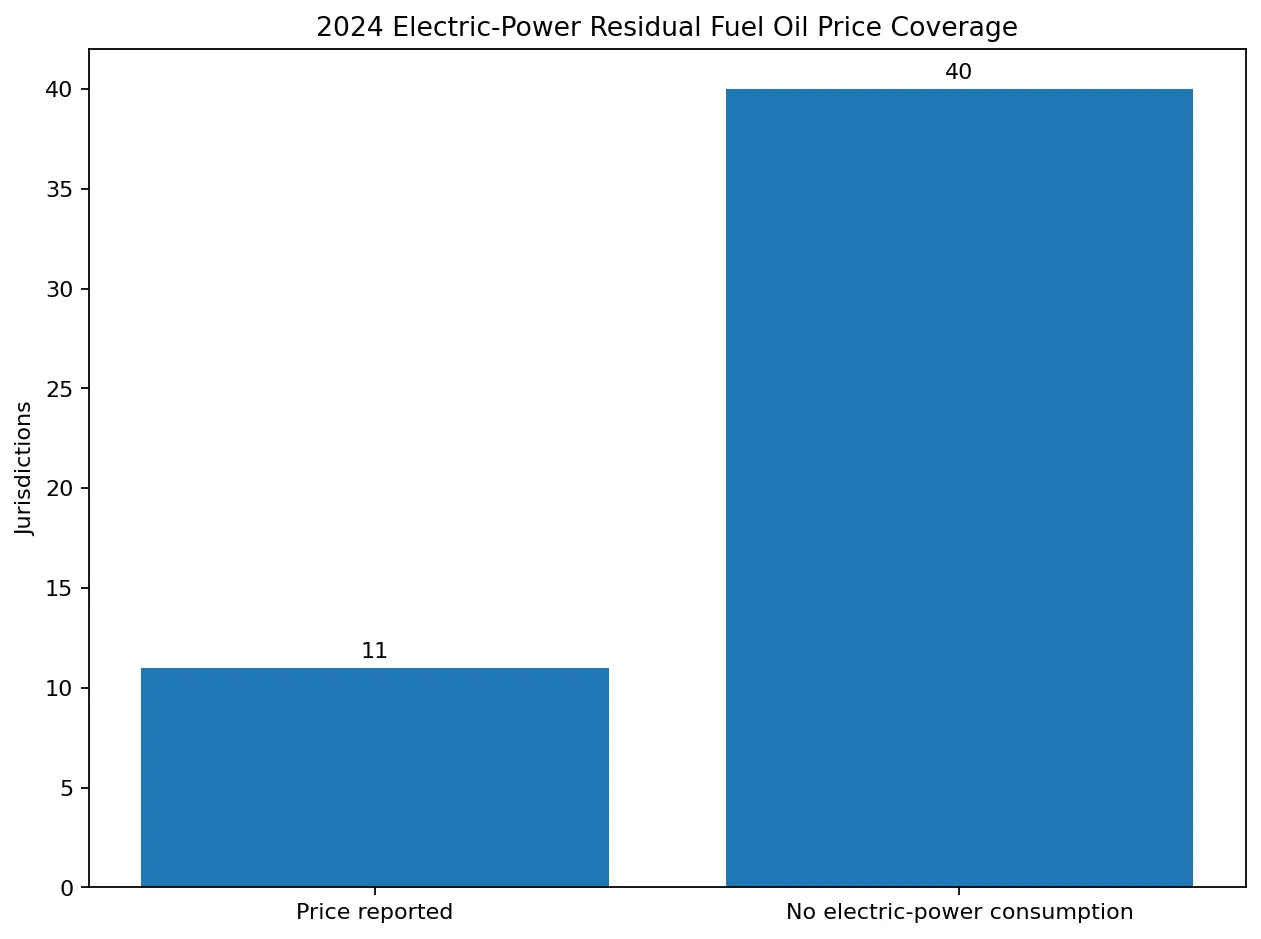
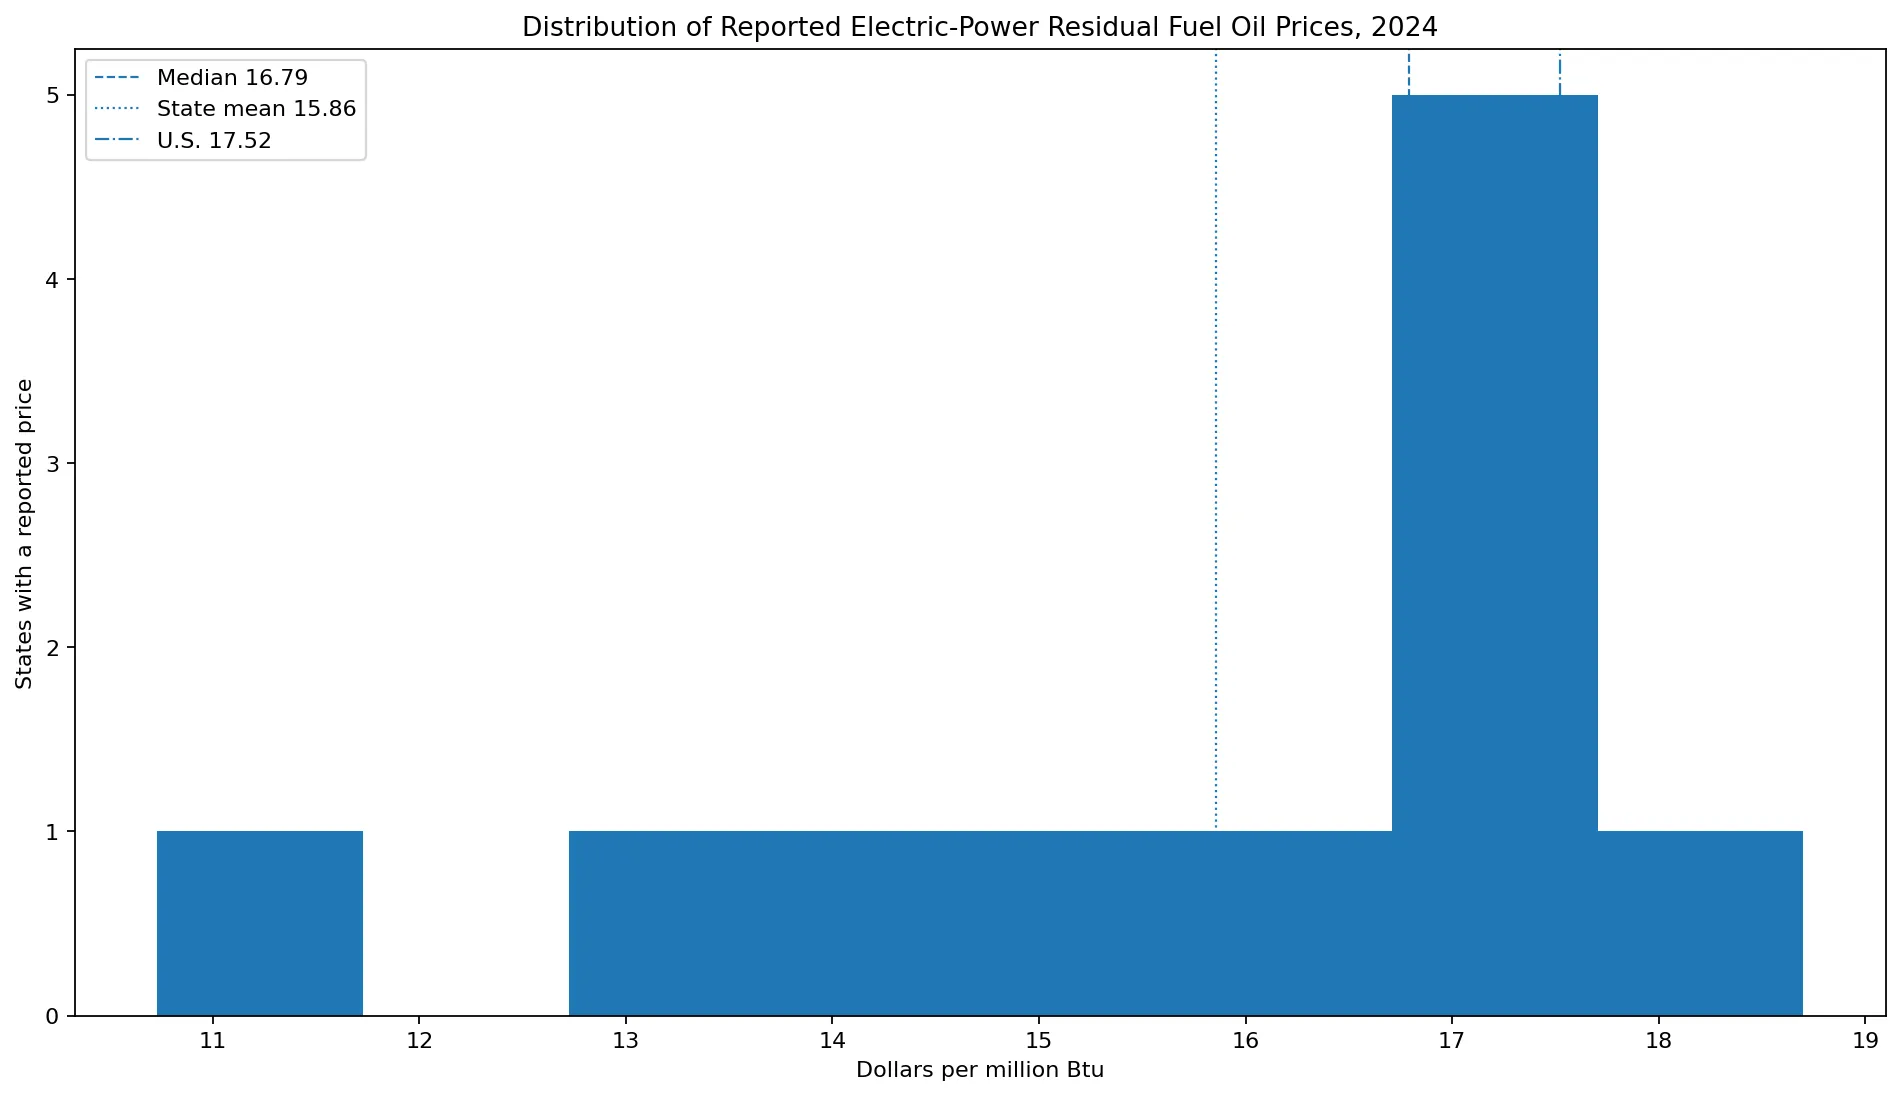
Residual fuel oil prices in the U.S. electric power sector were reported for only 11 states in 2024. EIA State Energy Data System Table F7 shows New York at the highest reported price, $18.70 per million Btu, followed by Maryland at $17.65, Hawaii at $17.58, and Pennsylvania at $17.26. Michigan had the lowest positive reported value at $10.73/MMBtu. Among the 11 reported state prices, the median was $16.79 and the unweighted mean was about $15.86.
The other 40 jurisdictions should not be ranked at zero. In the official EIA table their electric-power residual fuel oil price is displayed as a dash, and the footnote defines the dash as no consumption. Those zero entries in the state series are therefore status values indicating no electric-power residual fuel oil consumption, not $0 fuel prices. The price statistics and rankings here use only the 11 states with numerical prices.
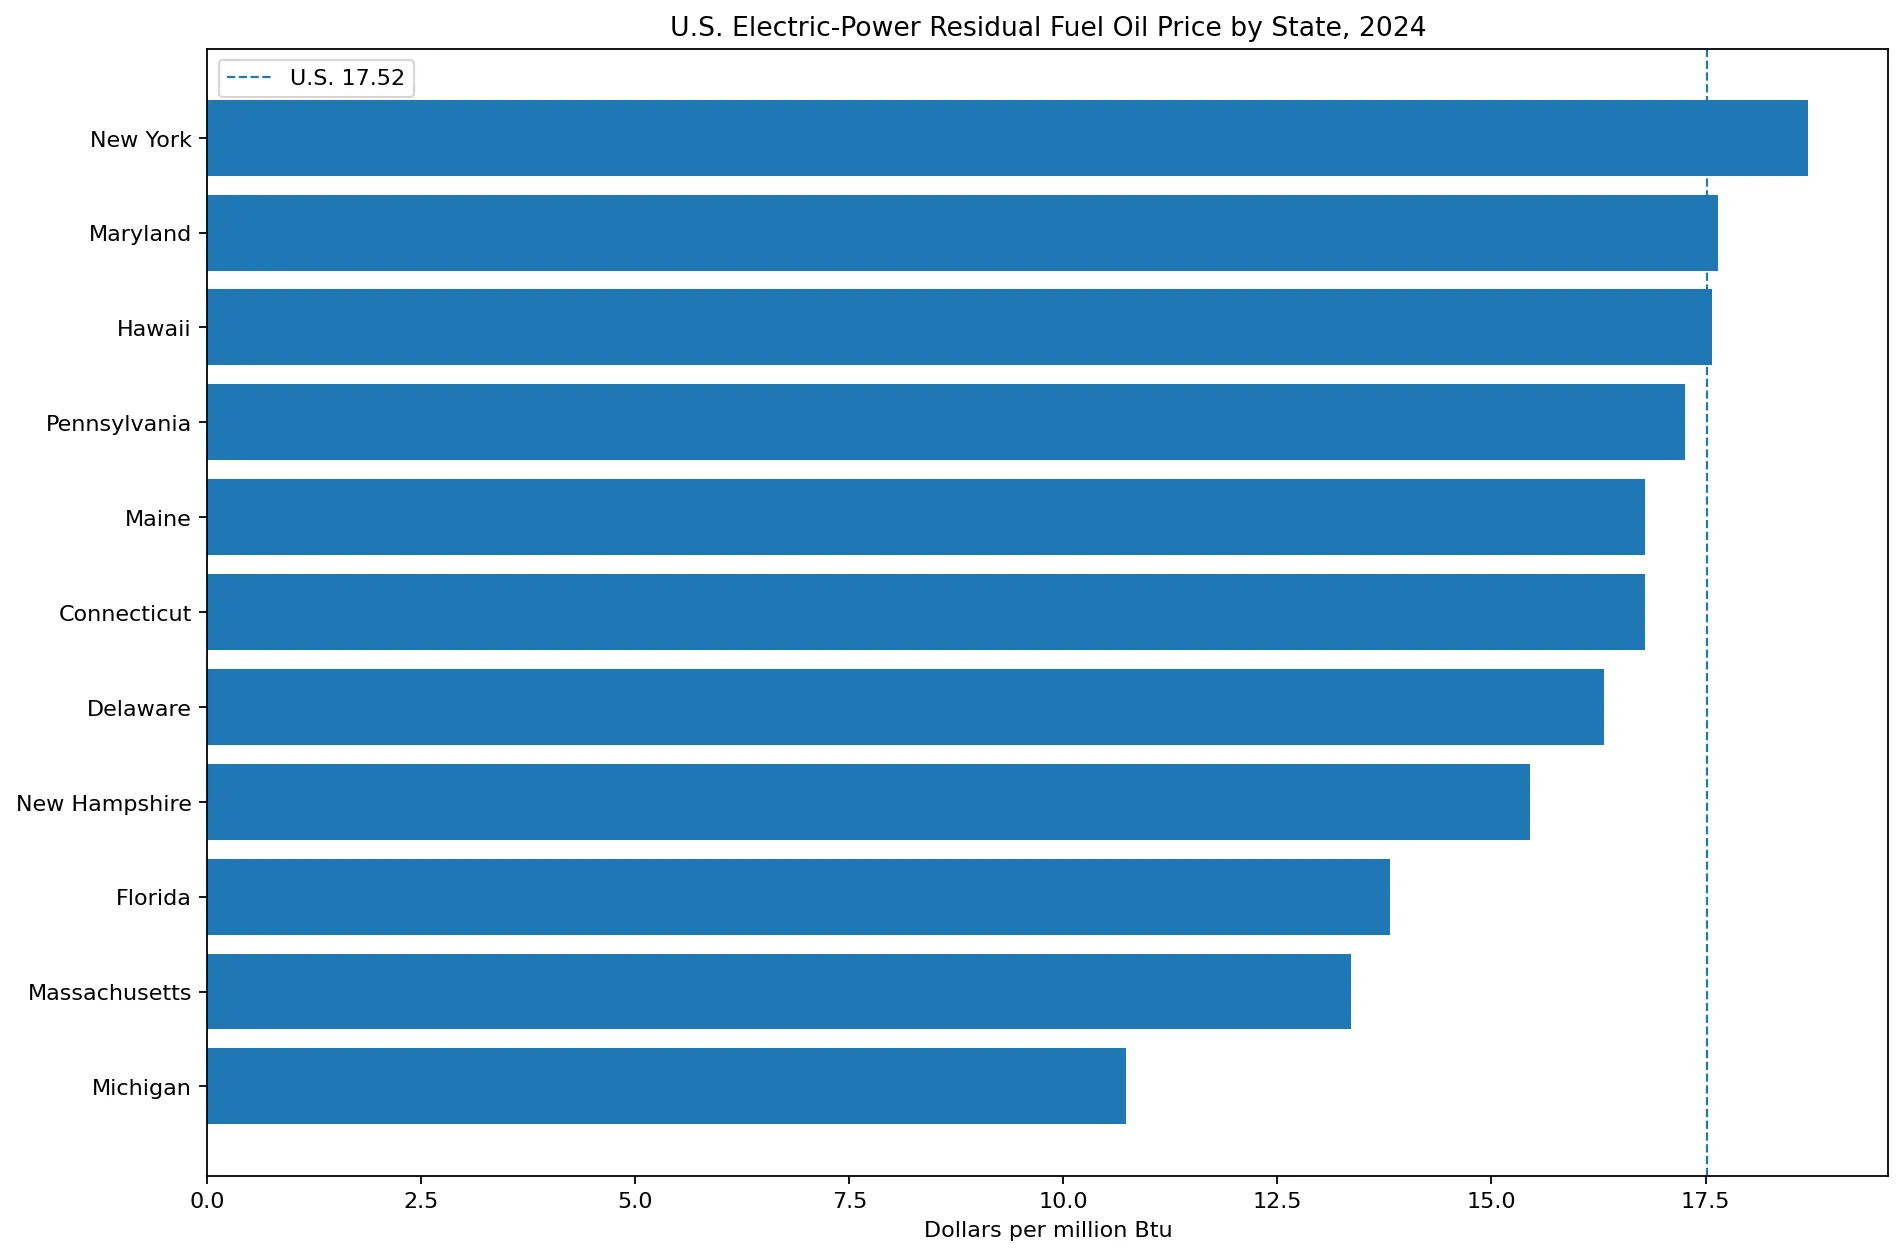
Table of Contents
What the electric-power residual fuel oil price measures
EIA defines the electric-power residual fuel oil price as the average delivered cost of No. 6 fuel oil receipts at electric plants. Residual fuel oil, often called heavy oil, is the heavy petroleum product left after lighter products such as gasoline, kerosene, and distillate fuels are separated from crude oil. In power-sector statistics, No. 6 fuel oil has historically been used mainly in steam-electric and other oil-fired generating units.
The word delivered is important. EIA’s technical documentation states that the electric-power price includes all taxes, transportation, and other charges paid by the power plants. It is therefore closer to a plant-delivered fuel cost than to a refinery gate price or a spot-market quotation. Comparing it with another petroleum price requires attention to the transaction point and included charges.
The unit is dollars per million Btu. Converting the delivered cost to a common energy-content unit allows residual fuel oil to be compared with natural gas, coal, distillate fuel oil, petroleum coke, and other generating fuels even though their physical units differ.
New York has the highest reported price
New York records $18.70/MMBtu. Maryland follows at $17.65, Hawaii at $17.58, Pennsylvania at $17.26, and Maine and Connecticut at $16.79. Delaware is $16.31 and New Hampshire $15.45. The lower end consists of Florida at $13.82, Massachusetts at $13.36, and Michigan at $10.73.
The gap between New York and Michigan is $7.97/MMBtu, and the highest price is about 1.74 times the lowest positive price. That spread is meaningful within the reported group, but the group includes only 11 states. It should not be described as the full range of market prices across all 50 states and D.C. because the other jurisdictions have no comparable electric-power residual fuel oil consumption in Table F7.
Price rank also says little about the scale of fuel use. Hawaii’s reported price is third highest at $17.58, but Table F7 shows about $1012.5 million in electric-power residual fuel oil expenditures in Hawaii out of a U.S. total of $1092.4 million. That illustrates why price, consumption, and expenditure must be treated as separate dimensions.
Why 40 zero entries are not $0 prices
Forty jurisdictions appear as 0.00 in the state series, including major electricity markets such as California, Texas, Ohio, and Washington. In EIA Table F7, however, their electric-power residual fuel oil price is shown with a dash rather than a numerical zero. The table footnote explicitly states that the dash means no consumption.
This distinction changes both rankings and charts. If a no-consumption state were plotted at zero dollars, it would look like an exceptionally cheap market. In reality there is no state price to compare for that sector and year. A correct visualization therefore separates the 11 reported prices from the 40 no-consumption jurisdictions.
This is a recurring issue in state petroleum datasets. A zero can represent a true numerical observation in some series, but in this specific price series the official table resolves the ambiguity: the corresponding public display is a dash tied to no consumption. The table’s status information should therefore govern the interpretation.
The U.S. price of $17.52 is not the simple state mean
EIA Table F7 reports a 2024 U.S. electric-power residual fuel oil price of $17.52/MMBtu. The simple arithmetic mean of the 11 numerical state prices is only about $15.86. The two values answer different questions. EIA calculates the U.S. Btu price as an average of state Btu prices weighted by SEDS consumption.
States with large residual fuel oil consumption therefore have much more influence on the national price than states with tiny consumption. Hawaii’s large power-sector residual fuel oil use and its $17.58 price help explain why the U.S. consumption-weighted price is close to Hawaii’s value and well above the unweighted state mean. For the middle reported state, the $16.79 median is useful; for the effective price of U.S. power-sector residual fuel oil use, $17.52 is the relevant statistic.
Many 2024 state prices rely on a missing-price assignment
For 2011 forward, EIA’s technical documentation says the underlying electric-power residual fuel oil cost data are available through the agency’s electricity operations system, including EIA-923. When a state price is missing from the source, SEDS can estimate it by applying the growth rate of the U.S. price to the previous year’s state price.
Table TN4.29 identifies Connecticut, Delaware, Florida, Maine, Maryland, Massachusetts, New Hampshire, and Pennsylvania as states receiving that U.S.-growth assignment in 2024. Hawaii, Michigan, and New York are not listed for 2024. This means the 11 numerical prices do not all have identical provenance even though they are comparable within the published SEDS table.
The distinction matters most when differences are small. Maryland at $17.65 and Hawaii at $17.58 differ by only seven cents. A small ordinal difference like that should not be promoted as evidence of a strong market advantage when one value can involve a missing-price assignment and the other can come from available plant-cost data.
The series is based on No. 6 fuel oil delivered to power plants
Electric-power residual fuel oil prices differ conceptually from commercial, industrial, and transportation residual fuel oil prices. The power-sector series is tied to the delivered cost of No. 6 fuel oil receipts at electric plants. Other sectors use their own data sources and, in recent years, regression-based methods where direct EIA-782 price data are no longer available.
For that reason, the electric-power value should not be used as a general state residual fuel oil market price. Marine bunkering, industrial heavy-oil use, commercial fuel use, and power-plant fuel purchases occur under different contracts, volumes, taxes, quality specifications, and logistics.
A high fuel price does not equal a high total cost of electricity
Residual fuel oil price is only one component of power generation cost. A generating plant also faces capital costs, operations and maintenance, labor, environmental compliance, and costs for other fuels. If residual fuel oil is used only rarely, even a high $/MMBtu price can have a limited effect on a state’s overall electricity cost.
The series also should not be read as an oil-generation share. New York’s highest reported price does not mean residual fuel oil produces most of New York’s electricity. A generation-share analysis requires fuel-specific net generation or consumption divided by total generation or total fuel use.
The ranked curve shows a distinct low-end observation
Sorting the 11 reported prices places New York, Maryland, Hawaii, and Pennsylvania in the upper $17–$18 range. Maine, Connecticut, and Delaware occupy the mid-$16 range, New Hampshire is at $15.45, Florida and Massachusetts are in the low $13 range, and Michigan is clearly separated at $10.73.
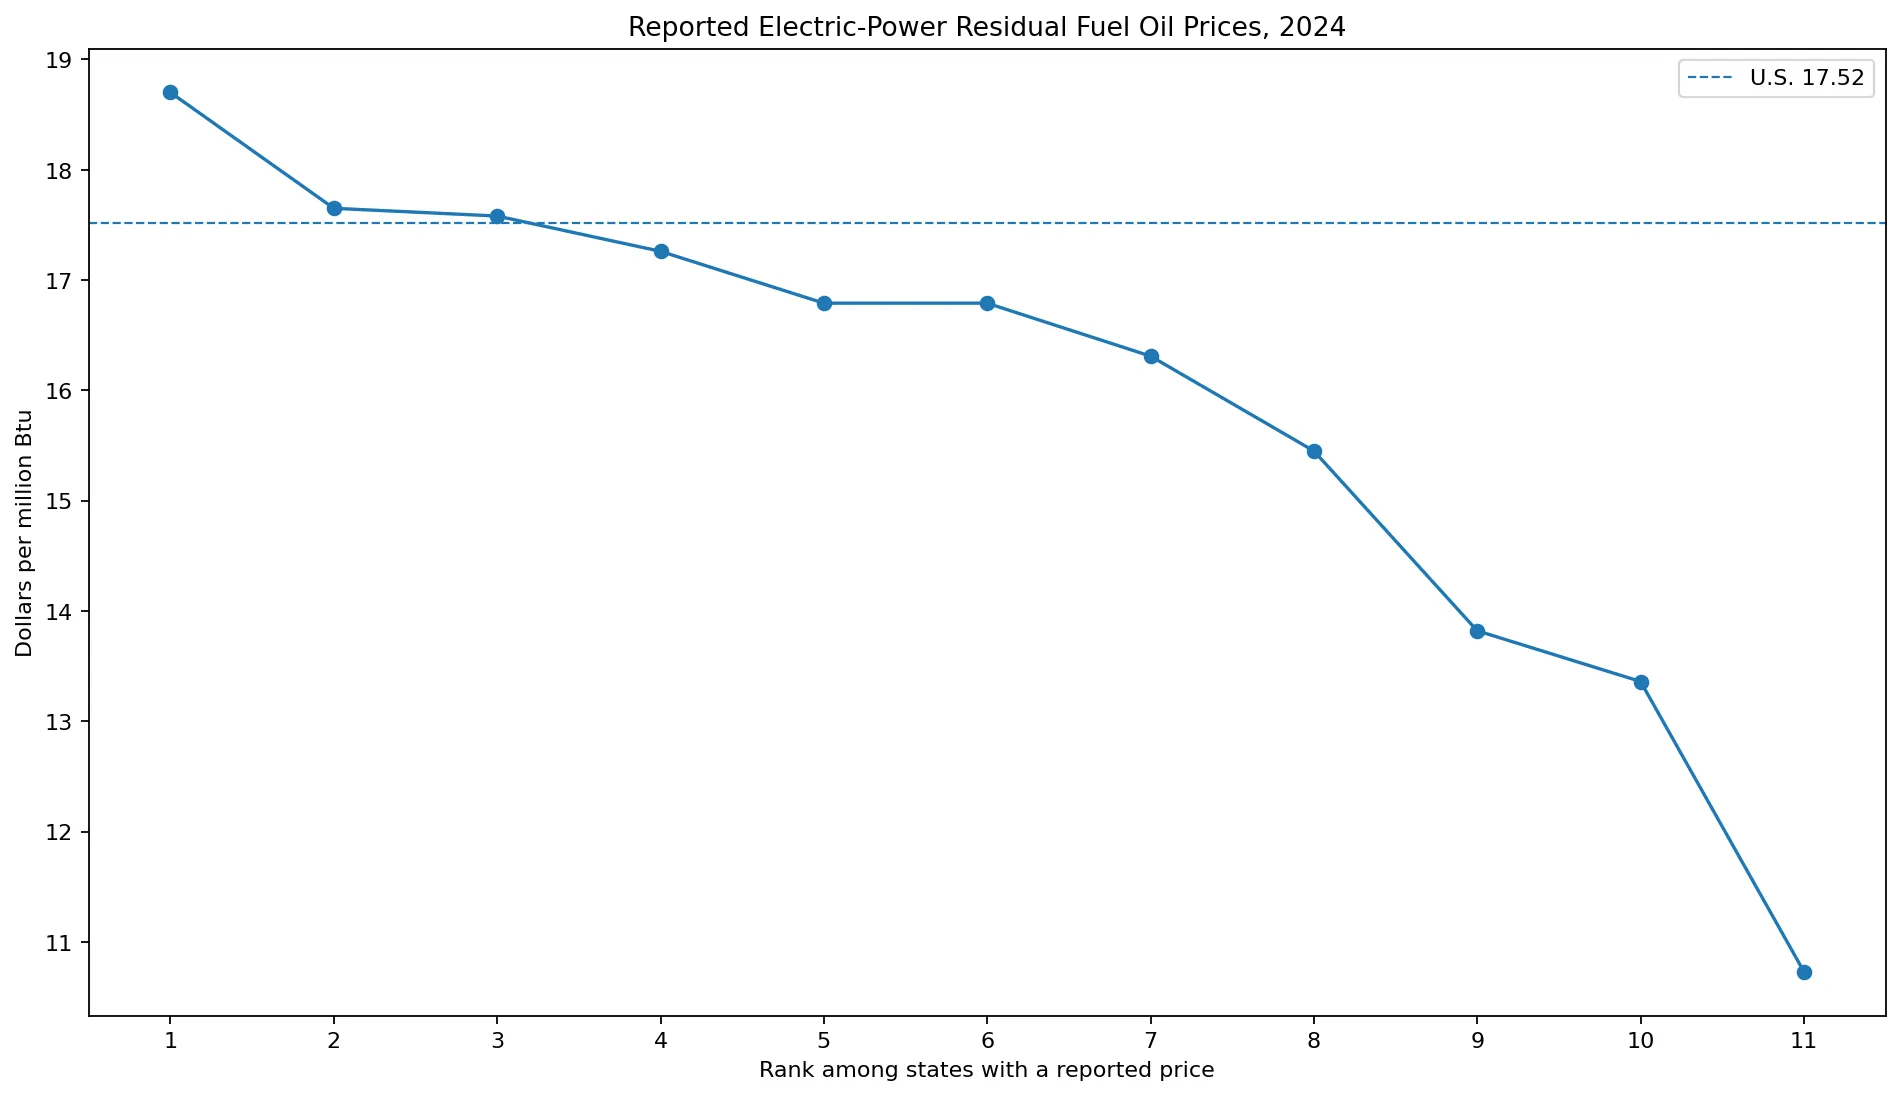
The curve intentionally excludes the 40 no-consumption jurisdictions. Adding them as zeros would create a false cluster at $0 and would make the reported state prices appear as if they were being compared with real zero-cost fuel purchases.
Official EIA references
EIA Table F7 provides 2024 residual fuel oil prices and expenditures for commercial, industrial, transportation, electric-power, and total sectors and defines the dash as no consumption. The SEDS 2024 petroleum price technical documentation defines the electric-power residual fuel oil price as the average delivered cost of No. 6 fuel oil receipts at electric plants and documents the missing-price assignment method.
All 51 jurisdictions in 2024
The table below retains the 50 states and the District of Columbia. Only the 11 states with a numerical electric-power residual fuel oil price receive a price rank. The other 40 jurisdictions are shown with a dash because EIA reports no electric-power residual fuel oil consumption.
| Rank | State | Code | Year | $/MMBtu | Status |
|---|---|---|---|---|---|
| 1 | New York | NY | 2024 | 18.70 | Price reported |
| 2 | Maryland | MD | 2024 | 17.65 | Price reported |
| 3 | Hawaii | HI | 2024 | 17.58 | Price reported |
| 4 | Pennsylvania | PA | 2024 | 17.26 | Price reported |
| 5 | Connecticut | CT | 2024 | 16.79 | Price reported |
| 6 | Maine | ME | 2024 | 16.79 | Price reported |
| 7 | Delaware | DE | 2024 | 16.31 | Price reported |
| 8 | New Hampshire | NH | 2024 | 15.45 | Price reported |
| 9 | Florida | FL | 2024 | 13.82 | Price reported |
| 10 | Massachusetts | MA | 2024 | 13.36 | Price reported |
| 11 | Michigan | MI | 2024 | 10.73 | Price reported |
| — | Alabama | AL | 2024 | — | No electric-power consumption |
| — | Alaska | AK | 2024 | — | No electric-power consumption |
| — | Arizona | AZ | 2024 | — | No electric-power consumption |
| — | Arkansas | AR | 2024 | — | No electric-power consumption |
| — | California | CA | 2024 | — | No electric-power consumption |
| — | Colorado | CO | 2024 | — | No electric-power consumption |
| — | District of Columbia | DC | 2024 | — | No electric-power consumption |
| — | Georgia | GA | 2024 | — | No electric-power consumption |
| — | Idaho | ID | 2024 | — | No electric-power consumption |
| — | Illinois | IL | 2024 | — | No electric-power consumption |
| — | Indiana | IN | 2024 | — | No electric-power consumption |
| — | Iowa | IA | 2024 | — | No electric-power consumption |
| — | Kansas | KS | 2024 | — | No electric-power consumption |
| — | Kentucky | KY | 2024 | — | No electric-power consumption |
| — | Louisiana | LA | 2024 | — | No electric-power consumption |
| — | Minnesota | MN | 2024 | — | No electric-power consumption |
| — | Mississippi | MS | 2024 | — | No electric-power consumption |
| — | Missouri | MO | 2024 | — | No electric-power consumption |
| — | Montana | MT | 2024 | — | No electric-power consumption |
| — | Nebraska | NE | 2024 | — | No electric-power consumption |
| — | Nevada | NV | 2024 | — | No electric-power consumption |
| — | New Jersey | NJ | 2024 | — | No electric-power consumption |
| — | New Mexico | NM | 2024 | — | No electric-power consumption |
| — | North Carolina | NC | 2024 | — | No electric-power consumption |
| — | North Dakota | ND | 2024 | — | No electric-power consumption |
| — | Ohio | OH | 2024 | — | No electric-power consumption |
| — | Oklahoma | OK | 2024 | — | No electric-power consumption |
| — | Oregon | OR | 2024 | — | No electric-power consumption |
| — | Rhode Island | RI | 2024 | — | No electric-power consumption |
| — | South Carolina | SC | 2024 | — | No electric-power consumption |
| — | South Dakota | SD | 2024 | — | No electric-power consumption |
| — | Tennessee | TN | 2024 | — | No electric-power consumption |
| — | Texas | TX | 2024 | — | No electric-power consumption |
| — | Utah | UT | 2024 | — | No electric-power consumption |
| — | Vermont | VT | 2024 | — | No electric-power consumption |
| — | Virginia | VA | 2024 | — | No electric-power consumption |
| — | Washington | WA | 2024 | — | No electric-power consumption |
| — | West Virginia | WV | 2024 | — | No electric-power consumption |
| — | Wisconsin | WI | 2024 | — | No electric-power consumption |
| — | Wyoming | WY | 2024 | — | No electric-power consumption |
Frequently Asked Questions
Which state had the highest electric-power residual fuel oil price in 2024?
New York was highest at $18.70/MMBtu, followed by Maryland at $17.65 and Hawaii at $17.58.
Do the 40 zero entries mean residual fuel oil cost $0?
No. EIA Table F7 shows dashes for those jurisdictions and defines the dash as no electric-power residual fuel oil consumption.
What was the U.S. electric-power residual fuel oil price in 2024?
EIA Table F7 reports $17.52/MMBtu for the United States. It is a consumption-weighted national price rather than a simple state average.
Does the electric-power residual fuel oil price include transportation costs?
Yes. EIA defines it as the average delivered cost of No. 6 fuel oil receipts at electric plants, including taxes, transportation, and other charges.
Related Articles
Green Map creates custom-edited map images using open geographic data sources such as geoBoundaries, Natural Earth, OpenStreetMap, and government open data. These maps are edited visual materials, not raw data files, and are provided for education, documents, presentations, and graphic reference.