U.S. wind energy total consumption was highly concentrated in a relatively small group of states in 2024. Across the 50 states and the District of Columbia, the EIA State Energy Data System records a combined 1541898 billion Btu. Texas alone accounts for 424035 billion Btu, or about 27.5% of the 51-jurisdiction total. Iowa follows with 151074, Oklahoma with 129542, Kansas with 101661, and Illinois with 84994 billion Btu. Together, the top five states account for about 57.8% of the total.
The metric can look similar to a wind-generation ranking, but its accounting definition matters. EIA labels the series Wind energy total consumption, or WYTCB, and expresses it in billion Btu. In SEDS, the state value combines commercial-sector wind consumption, electric-power-sector wind consumption, and industrial-sector wind consumption. It therefore covers a broader part of the wind-energy account than the separate total end-use series, which is limited to the commercial and industrial components.
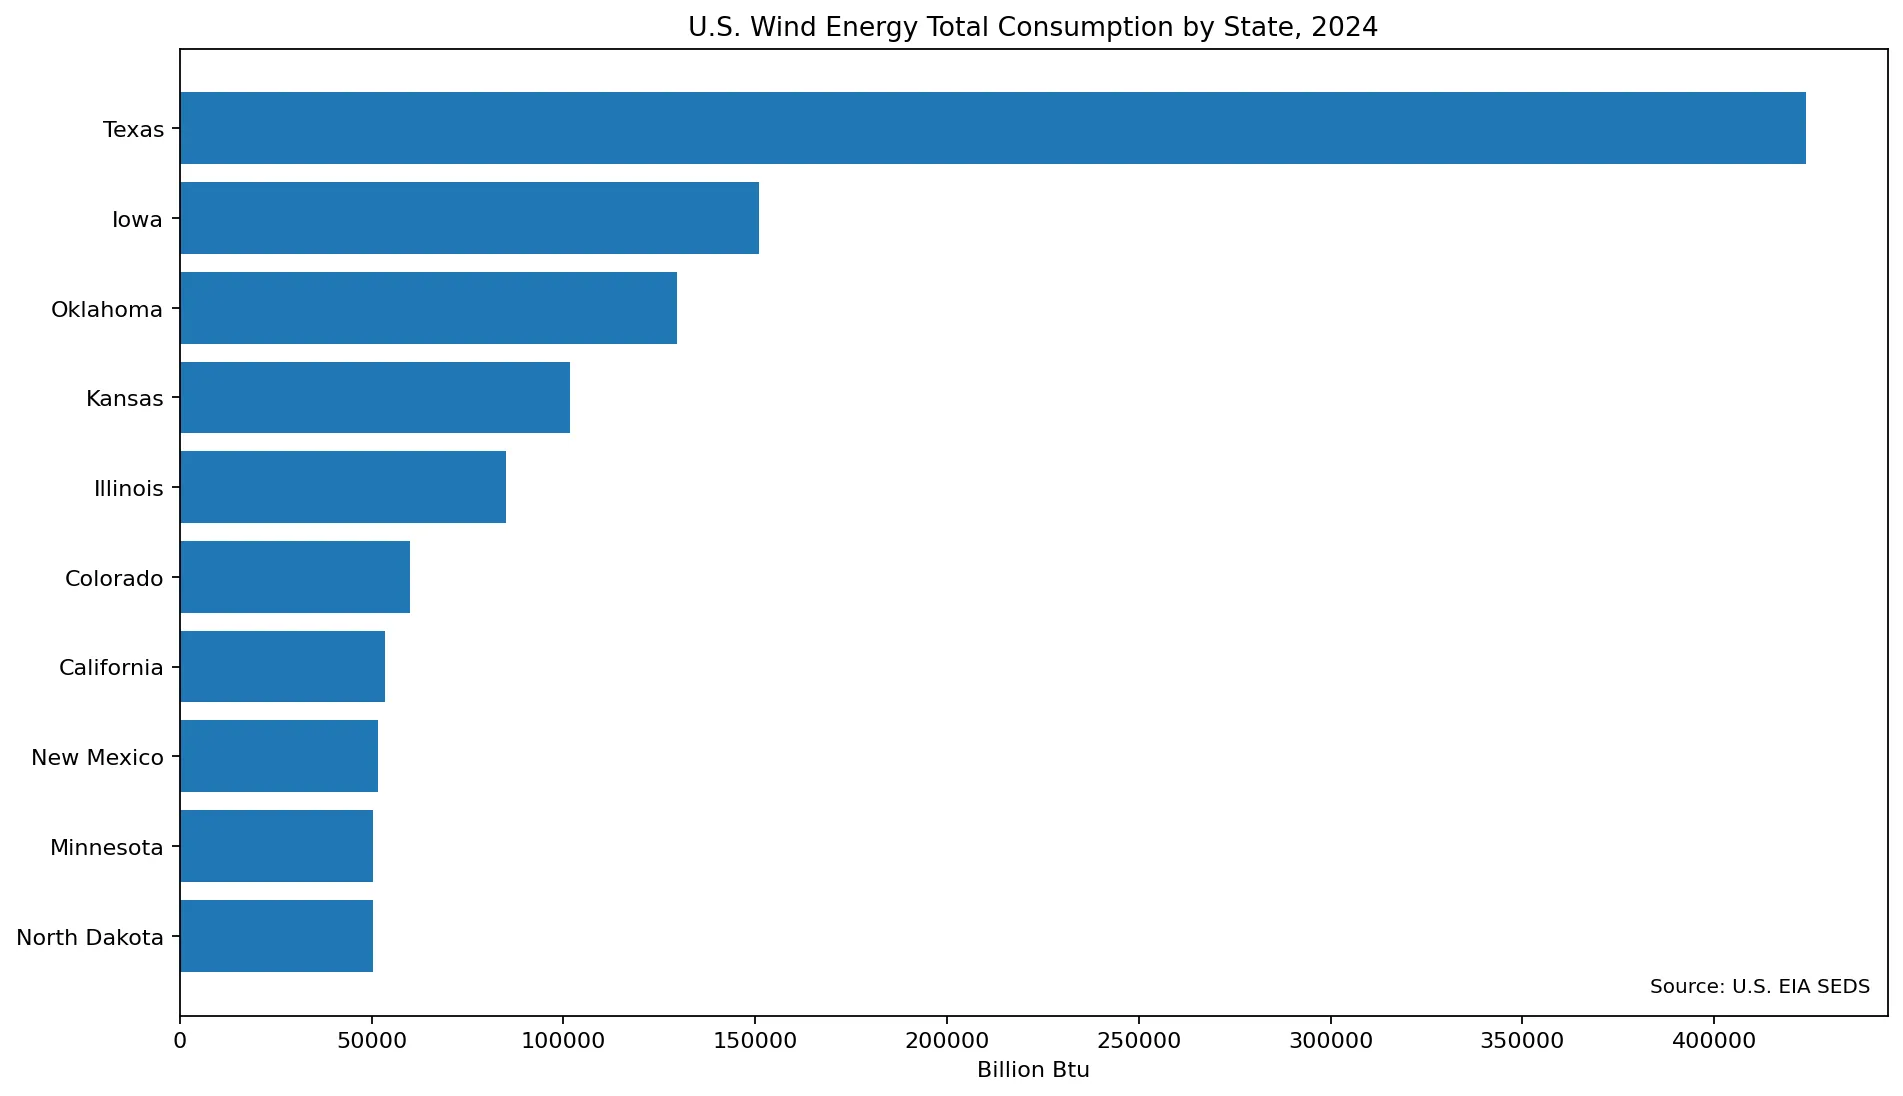
Table of Contents
What wind energy total consumption includes
SEDS uses common Btu units so that different energy sources can be placed in the same state energy accounting framework. For wind, total consumption is the sum of three components: commercial consumption, wind energy consumed for electricity generation in the electric power sector, and industrial consumption. The electric-power component is especially important because utility-scale wind generation is much larger than the direct commercial and industrial components in most states.
This distinction also explains why the ranking should not be interpreted as a simple measure of electricity purchased by households or businesses. Electricity generated by wind enters the power system and is later sold to end users as electricity. At the final-consumption stage, those customers are not assigned a specific wind Btu value simply because some portion of grid electricity originated from wind. The WYTCB series instead follows EIA’s source-based energy accounting.
SEDS also treats production and consumption of noncombustible renewable energy as equal at the primary-energy accounting level. The wind production series is therefore tied to wind total consumption. For readers comparing wind with coal, natural gas, nuclear, solar, or hydropower in SEDS, this common Btu framework is what makes cross-source comparisons possible.
Texas accounts for more than one quarter of the total
Texas stands far above the other states at 424035 billion Btu. Its value is about 2.8 times Iowa’s 151074 billion Btu. Oklahoma records 129542, Kansas 101661, and Illinois 84994. The top two states together represent about 37.3% of the total, the top three about 45.7%, and the top ten about 75.1%. The national pattern is therefore strongly concentrated rather than evenly distributed.
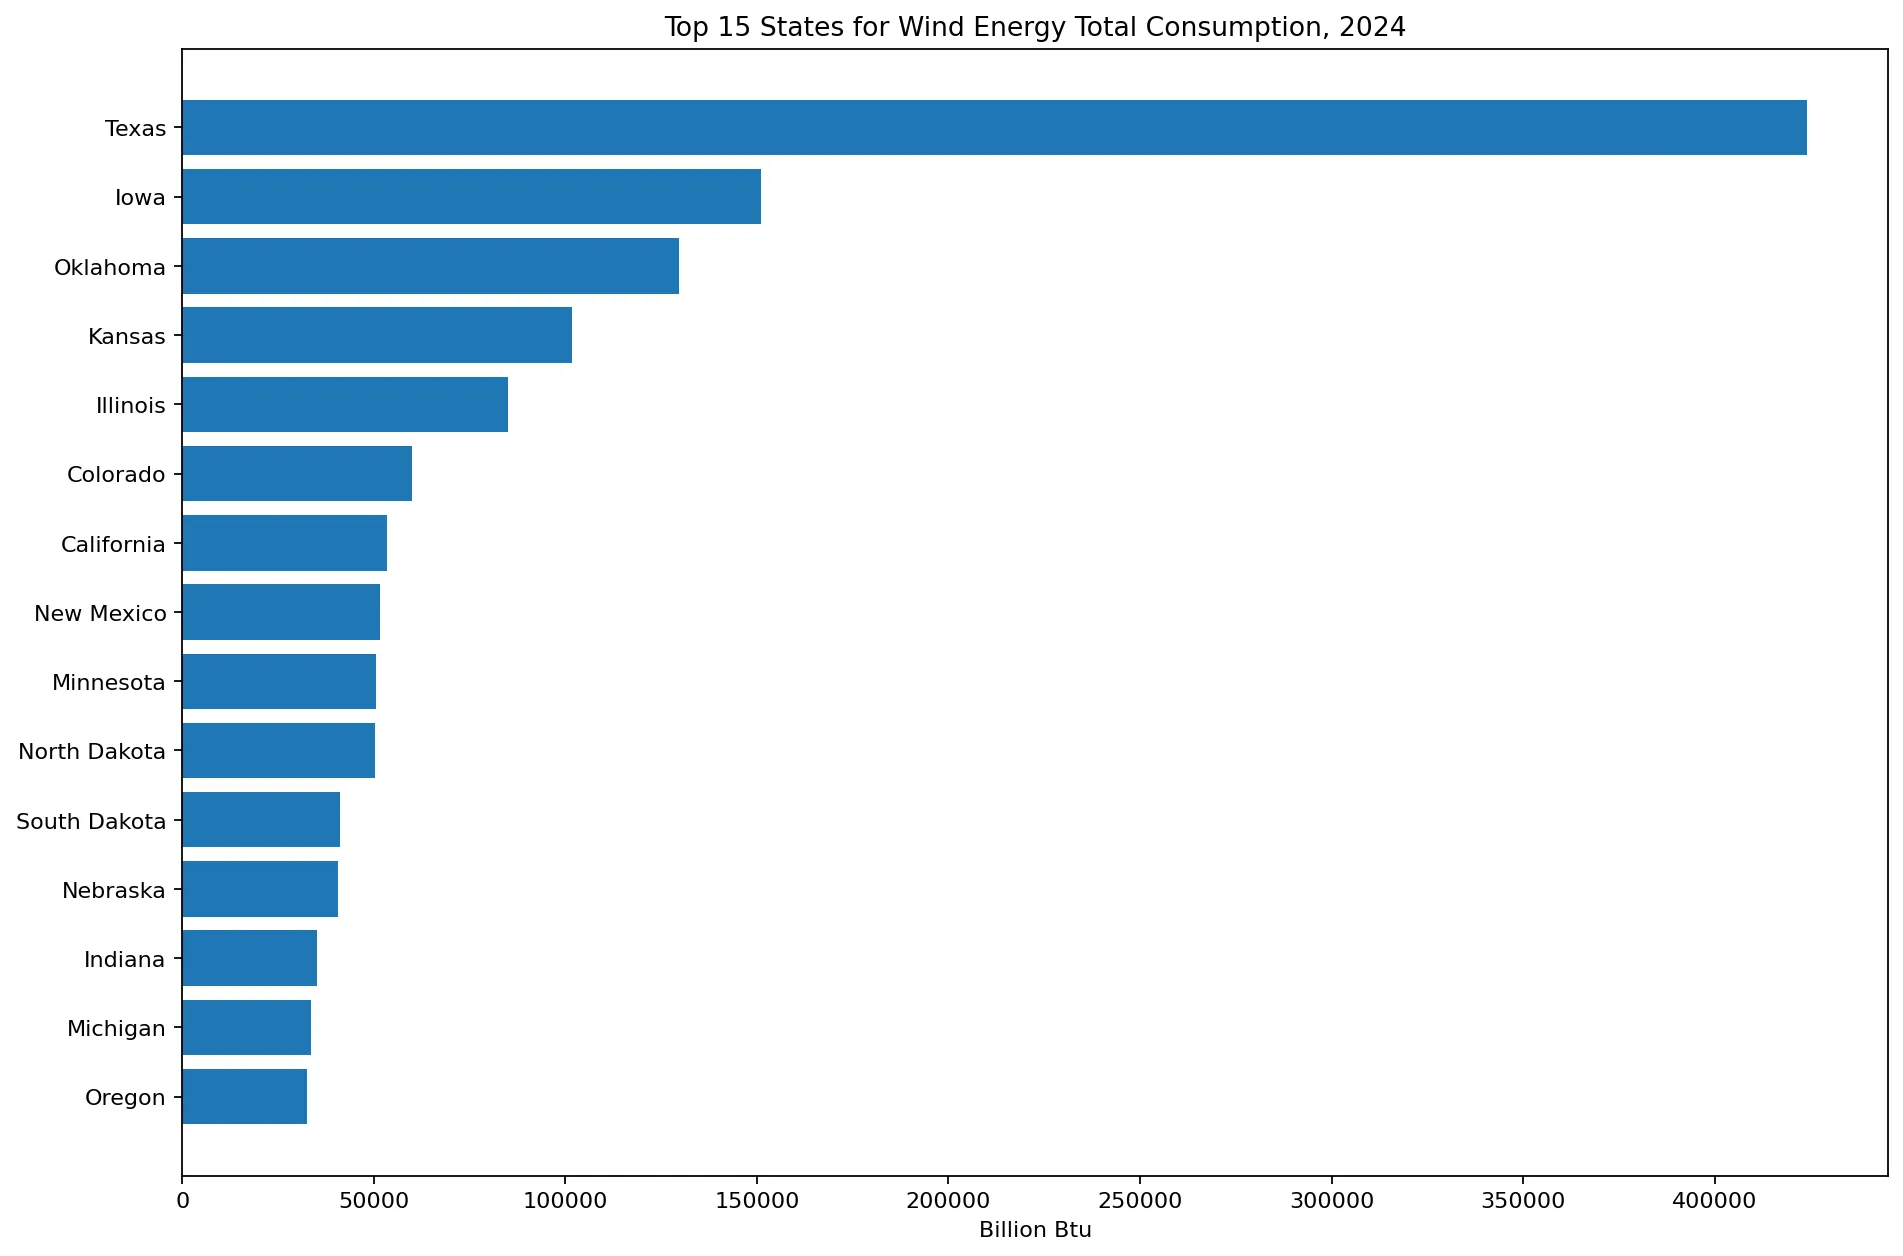
Colorado, California, New Mexico, Minnesota, and North Dakota complete the top ten. South Dakota and Nebraska also record more than 40000 billion Btu. These figures describe the scale of wind energy entering each state’s SEDS energy account, but the values alone do not identify a single cause. Installed wind capacity, wind-resource quality, turbine utilization, curtailment, transmission availability, and the timing of generation can all matter in broader analysis.
The median is much lower than the mean
The simple mean across all 51 jurisdictions is about 30233 billion Btu, while the median is 6834. That gap is a sign of a right-skewed distribution. Texas and several other large wind states pull the mean upward, while many states have much smaller values. Forty-three jurisdictions have values above zero and eight are recorded at zero.
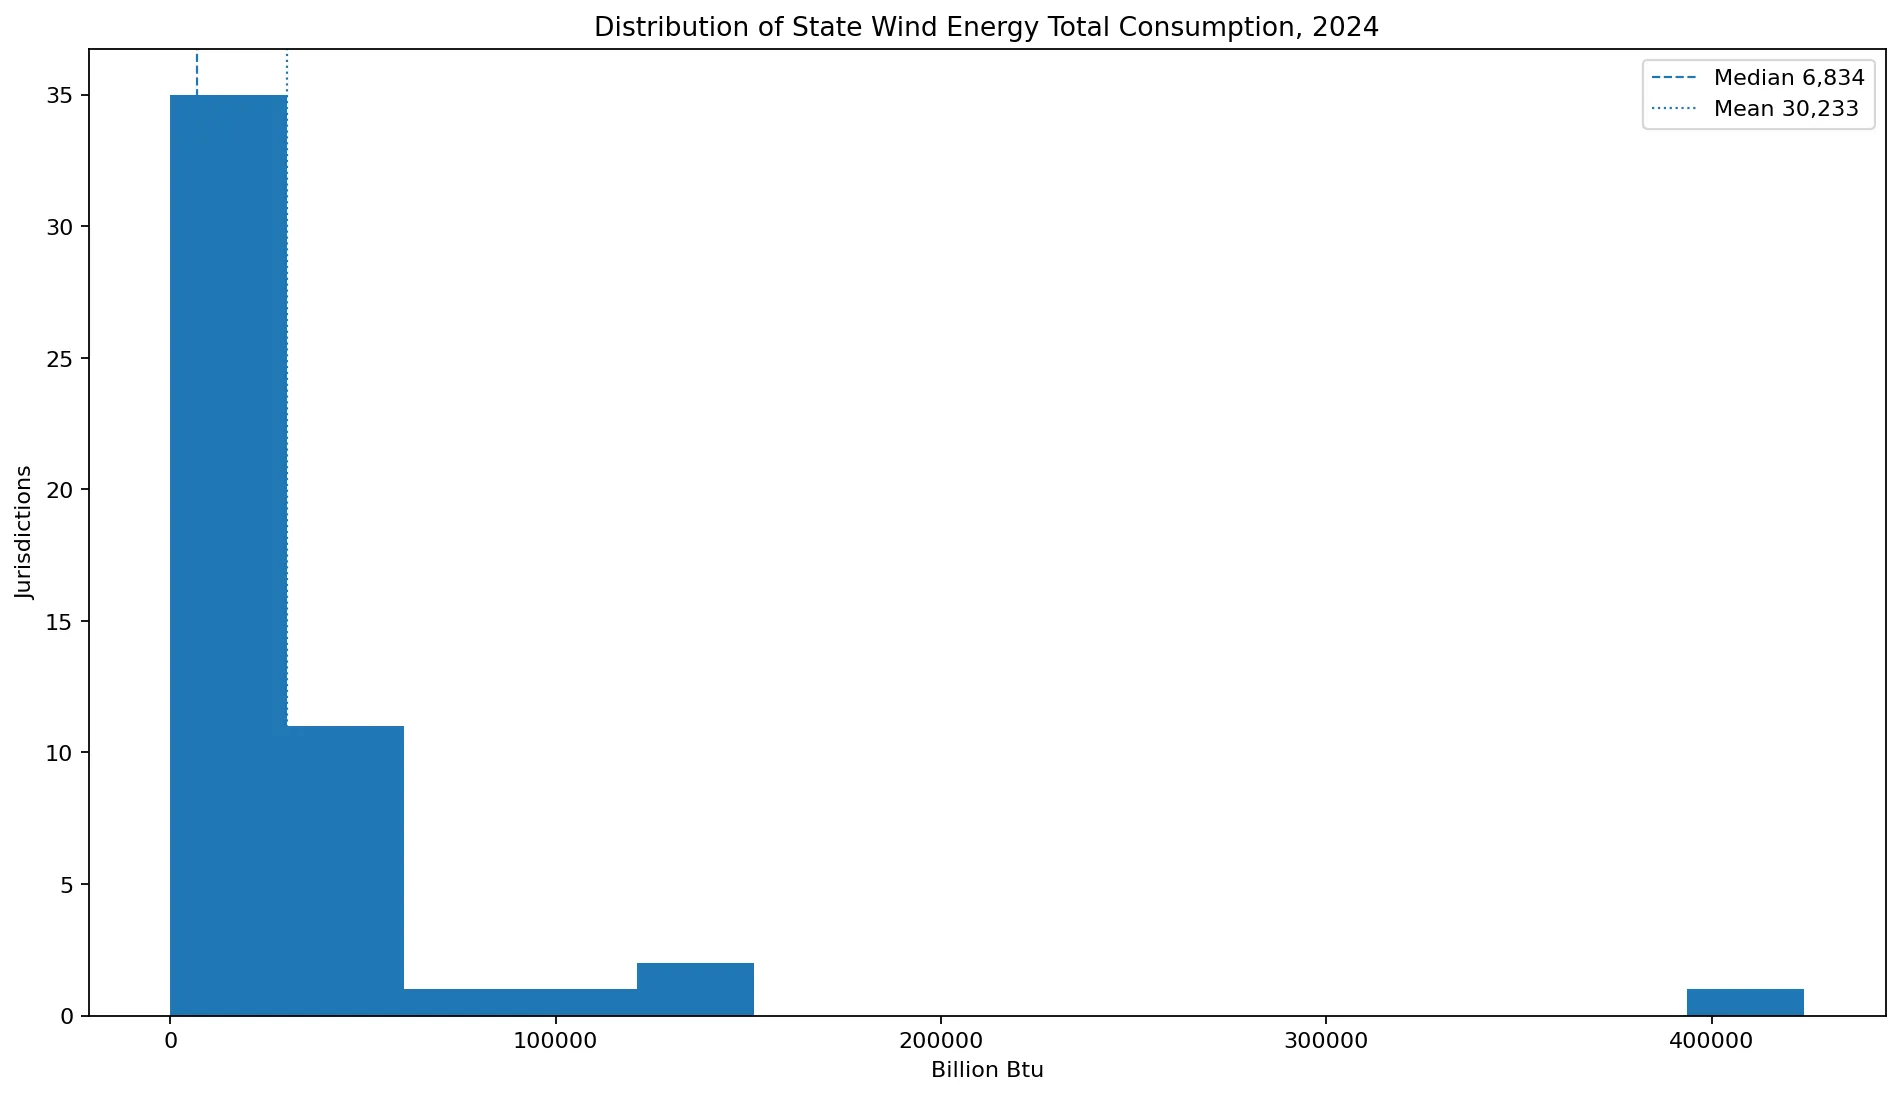
For that reason, the mean should not be treated as the amount used by a typical state. The median is better for describing the middle observation, while concentration shares show how much of the national total is located in the leading states. The top five represent 57.8% and the top ten represent 75.1%. Those shares provide a clearer description of the structure than one national average alone.
How to interpret the eight zero values
Alabama, Arkansas, the District of Columbia, Florida, Georgia, Kentucky, Louisiana, and South Carolina are recorded at zero in this 2024 SEDS series. These are observations in the EIA state series, not missing jurisdictions. At the same time, a zero should not be stretched into the claim that no customer in the jurisdiction ever used electricity that originated from wind. Grid electricity is accounted for as electricity when it reaches final customers, and the WYTCB measure follows the source-based wind components defined by SEDS.
The safer interpretation is that the three components entering the state wind total sum to zero in this SEDS accounting for 2024. Questions about renewable-energy certificates, imported wind-generated electricity, individual behind-the-meter systems, or contractual purchases require other data. Likewise, installed capacity and net generation should be analyzed with their own EIA series rather than inferred from a zero in WYTCB.
Total consumption is not the same as total end-use consumption
The wording is similar, but the two series serve different purposes. Wind energy total consumption includes the electric-power sector. Wind energy total end-use consumption is a narrower SEDS series built from the commercial and industrial wind components. A state with large utility-scale wind generation can therefore rank very high in total consumption even if its direct end-use wind value is small.
For a broad view of where wind energy enters the state energy system, the total-consumption series is the more relevant measure. For a narrow question about direct commercial and industrial wind use, the end-use series is the better fit. Keeping those scopes separate prevents the common mistake of using a direct-use indicator as a substitute for wind generation or, in the other direction, treating utility-scale wind consumption as if it were direct on-site use.
The post-2022 conversion method matters
Beginning with the 2022 SEDS data cycle, EIA changed how it converts electricity generation from noncombustible renewable sources such as wind, solar, hydropower, and geothermal into Btu. It now uses the captured energy approach and applies the heat content of electricity, 3412 Btu per kilowatthour. The earlier fossil fuel equivalency approach produced different primary-energy values. This methodological break matters when 2024 is compared with much older years.
For a same-year state comparison, all 2024 observations use the same framework. EIA’s Table C13 shows 2024 renewable consumption by source and lists Texas at 424.0, Iowa at 151.1, and Oklahoma at 129.5 trillion Btu for wind. EIA’s SEDS methodology change page explains the captured-energy transition.
Concentration remains visible beyond the top five
The cumulative pattern shows that the leading ten states already account for roughly three quarters of the national state total. After that point, each additional state adds a much smaller amount. This does not imply that the lower-ranked states lack meaningful wind projects; it simply reflects the Btu scale of the 2024 SEDS total-consumption series. State size, population, and total electricity demand are not used as denominators here, so the chart measures absolute energy volume rather than wind intensity.
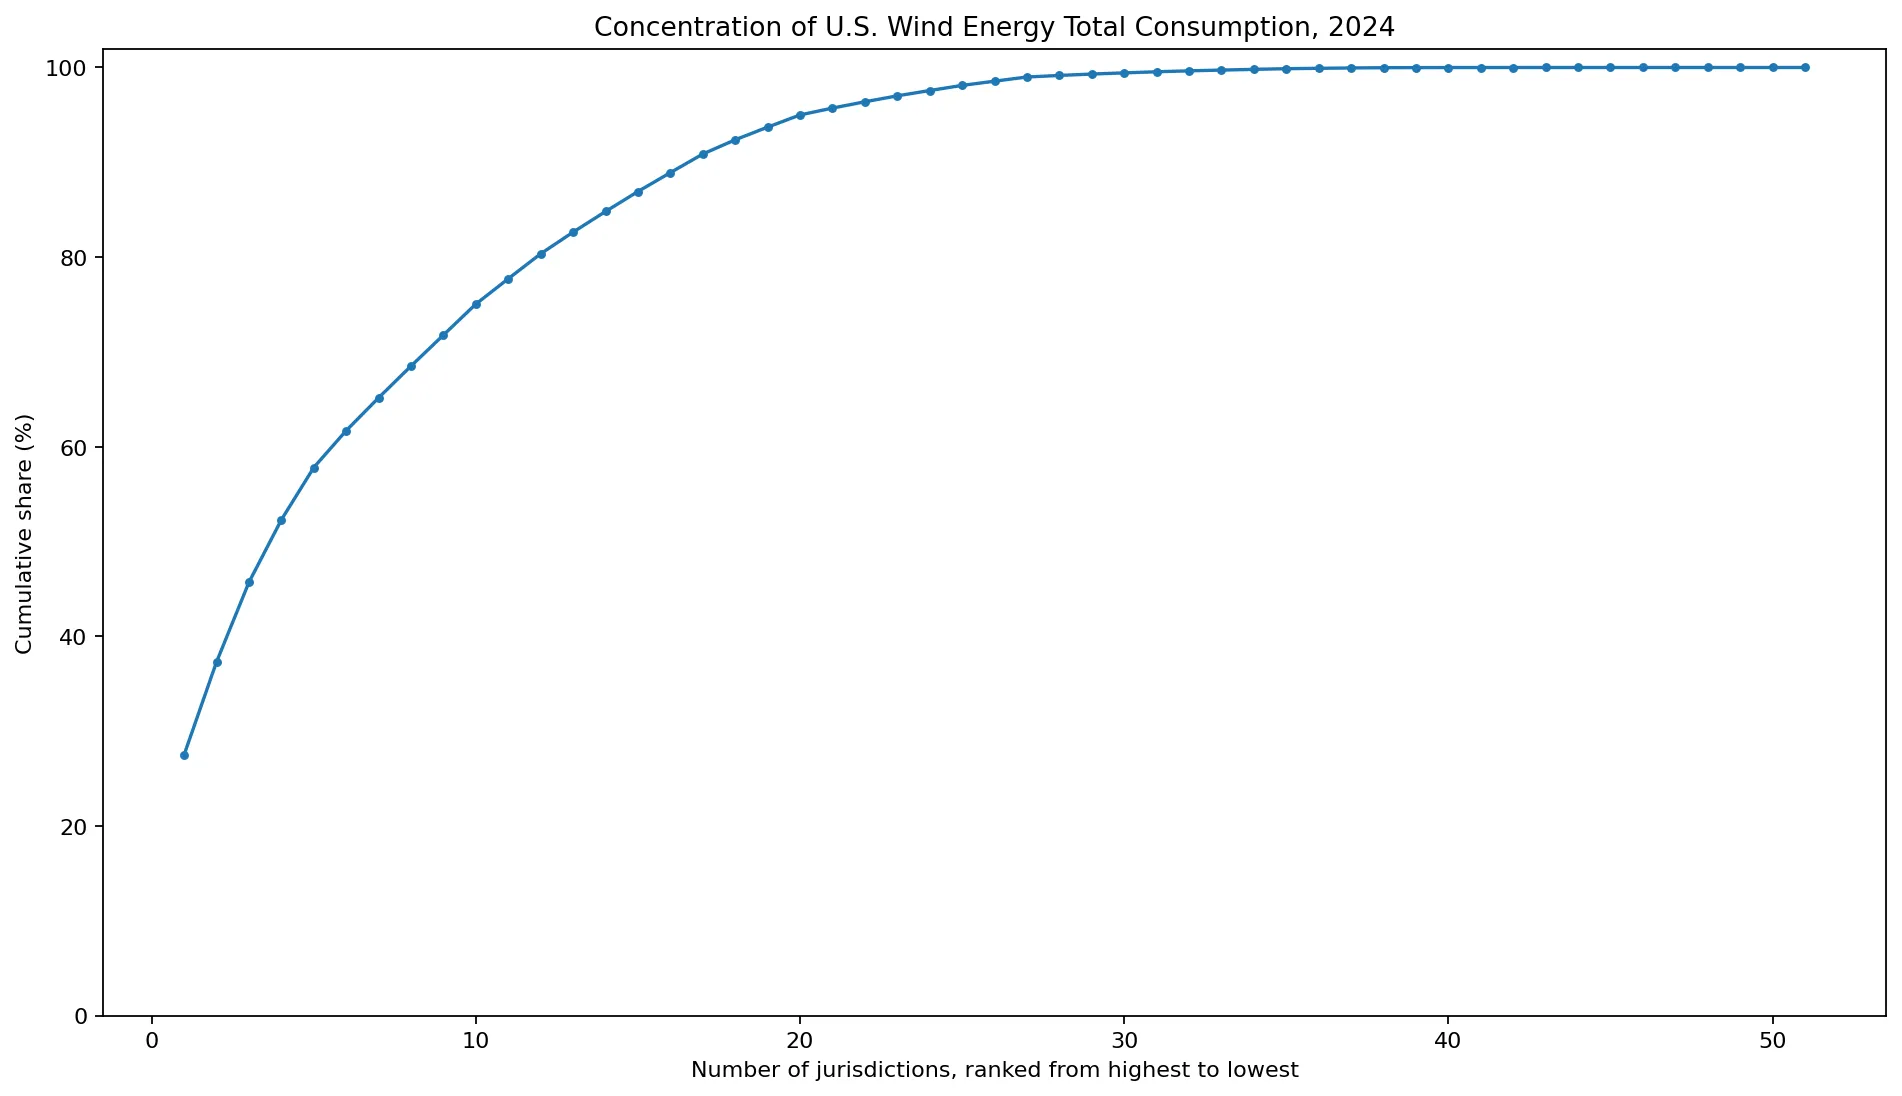
A per-capita measure, a wind share of electricity generation, or wind consumption as a share of total state energy would answer different questions. Those ratios should be calculated with consistent population, generation, or total-energy denominators rather than inferred from this absolute-value ranking. The strength of the present series is that it provides a consistent state-level measure of wind energy in the SEDS Btu accounting framework.
All 51 state jurisdictions
The table below preserves all 50 states and the District of Columbia, ordered from the largest 2024 value to the smallest. The unit is billion Btu, and zero values are shown as recorded in the EIA series.
| Rank | State | Code | Year | Billion Btu |
|---|---|---|---|---|
| 1 | Texas | TX | 2024 | 424035 |
| 2 | Iowa | IA | 2024 | 151074 |
| 3 | Oklahoma | OK | 2024 | 129542 |
| 4 | Kansas | KS | 2024 | 101661 |
| 5 | Illinois | IL | 2024 | 84994 |
| 6 | Colorado | CO | 2024 | 60058 |
| 7 | California | CA | 2024 | 53392 |
| 8 | New Mexico | NM | 2024 | 51643 |
| 9 | Minnesota | MN | 2024 | 50434 |
| 10 | North Dakota | ND | 2024 | 50370 |
| 11 | South Dakota | SD | 2024 | 41196 |
| 12 | Nebraska | NE | 2024 | 40573 |
| 13 | Indiana | IN | 2024 | 35185 |
| 14 | Michigan | MI | 2024 | 33570 |
| 15 | Oregon | OR | 2024 | 32479 |
| 16 | Wyoming | WY | 2024 | 30714 |
| 17 | Washington | WA | 2024 | 30242 |
| 18 | Missouri | MO | 2024 | 23167 |
| 19 | New York | NY | 2024 | 20579 |
| 20 | Montana | MT | 2024 | 19841 |
| 21 | Pennsylvania | PA | 2024 | 11111 |
| 22 | Idaho | ID | 2024 | 10290 |
| 23 | Ohio | OH | 2024 | 9628 |
| 24 | Arizona | AZ | 2024 | 8668 |
| 25 | Maine | ME | 2024 | 8347 |
| 26 | West Virginia | WV | 2024 | 6834 |
| 27 | Wisconsin | WI | 2024 | 6804 |
| 28 | Utah | UT | 2024 | 2554 |
| 29 | Hawaii | HI | 2024 | 2264 |
| 30 | Maryland | MD | 2024 | 1905 |
| 31 | North Carolina | NC | 2024 | 1809 |
| 32 | New Hampshire | NH | 2024 | 1517 |
| 33 | Vermont | VT | 2024 | 1212 |
| 34 | Mississippi | MS | 2024 | 1183 |
| 35 | Nevada | NV | 2024 | 1090 |
| 36 | Rhode Island | RI | 2024 | 608 |
| 37 | Massachusetts | MA | 2024 | 577 |
| 38 | Alaska | AK | 2024 | 421 |
| 39 | Virginia | VA | 2024 | 171 |
| 40 | New Jersey | NJ | 2024 | 66 |
| 41 | Tennessee | TN | 2024 | 45 |
| 42 | Connecticut | CT | 2024 | 36 |
| 43 | Delaware | DE | 2024 | 9 |
| 44 | Alabama | AL | 2024 | 0 |
| 45 | Arkansas | AR | 2024 | 0 |
| 46 | District of Columbia | DC | 2024 | 0 |
| 47 | Florida | FL | 2024 | 0 |
| 48 | Georgia | GA | 2024 | 0 |
| 49 | Kentucky | KY | 2024 | 0 |
| 50 | Louisiana | LA | 2024 | 0 |
| 51 | South Carolina | SC | 2024 | 0 |
Frequently Asked Questions
Which state had the highest wind energy total consumption in 2024?
Texas was highest at 424035 billion Btu, about 27.5% of the combined total for the 50 states and D.C.
Is wind energy total consumption the same as wind total end-use consumption?
No. Total consumption includes commercial, electric-power, and industrial wind components, while total end-use consumption is limited to commercial and industrial components.
How many jurisdictions recorded zero in 2024?
Eight of the 51 jurisdictions are recorded at zero in the SEDS series. That should not be interpreted as proof that no customer used grid electricity originally generated from wind.
Why does the post-2022 methodology matter?
EIA began using the captured energy approach for noncombustible renewable electricity generation in the 2022 SEDS data cycle, changing how wind generation is converted to Btu.
Related Articles
Green Map creates custom-edited map images using open geographic data sources such as geoBoundaries, Natural Earth, OpenStreetMap, and government open data. These maps are edited visual materials, not raw data files, and are provided for education, documents, presentations, and graphic reference.