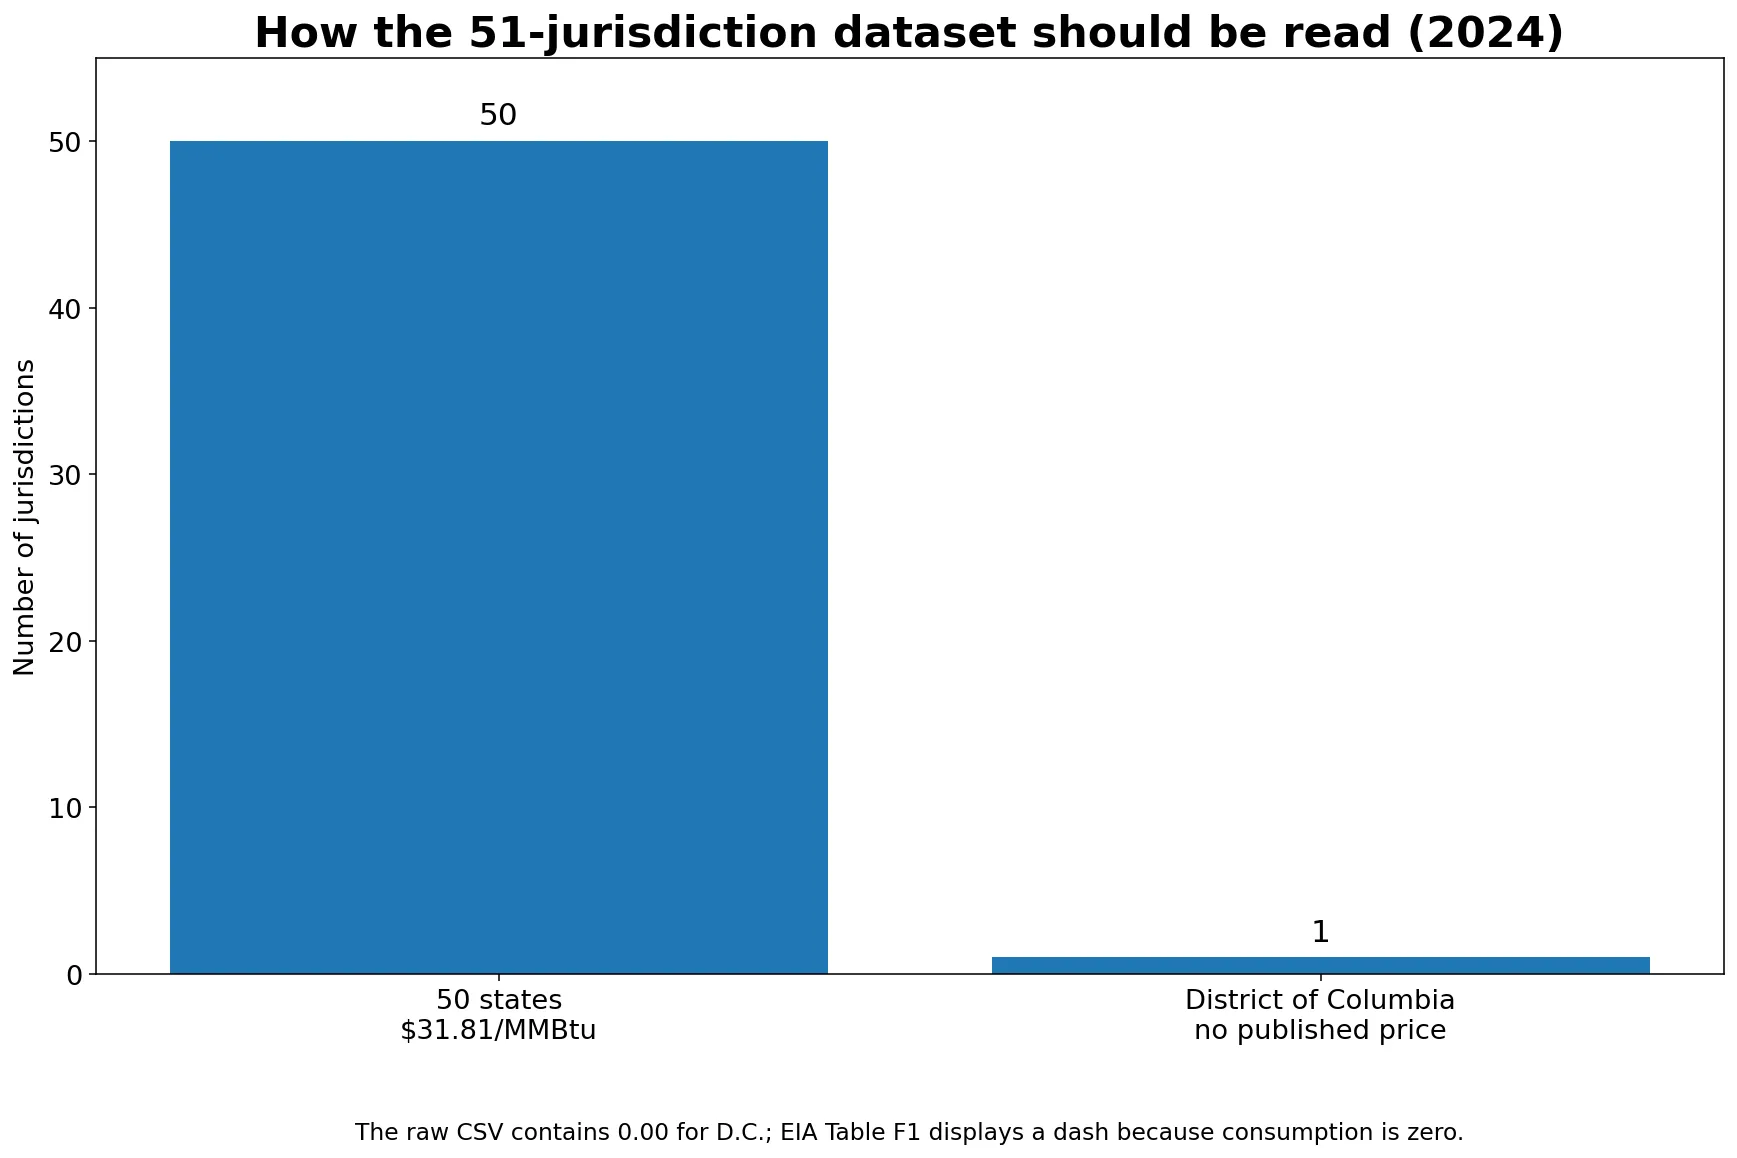
The 2024 state dataset for U.S. aviation gasoline (avgas) average price is unusual: it does not contain a meaningful state-by-state price spread. The 2024 EIA SEDS state data assign $31.81 per million Btu to all 50 states and show 0.00 for the District of Columbia. EIA’s published 2024 fuel table, however, shows zero aviation-gasoline consumption for D.C. and uses a dash rather than a zero price. D.C. therefore should not be treated as the cheapest jurisdiction.
The uniform values are not a coincidence. EIA explains that, from 2022 forward, SEDS estimates a single annual U.S.-level aviation-gasoline price and assigns that same price to every state. The 31.81 figure is therefore an energy-unit price used consistently in state energy accounts, not a survey of local airport pump prices in each state. That distinction changes how the map, table, and any ranking should be interpreted.
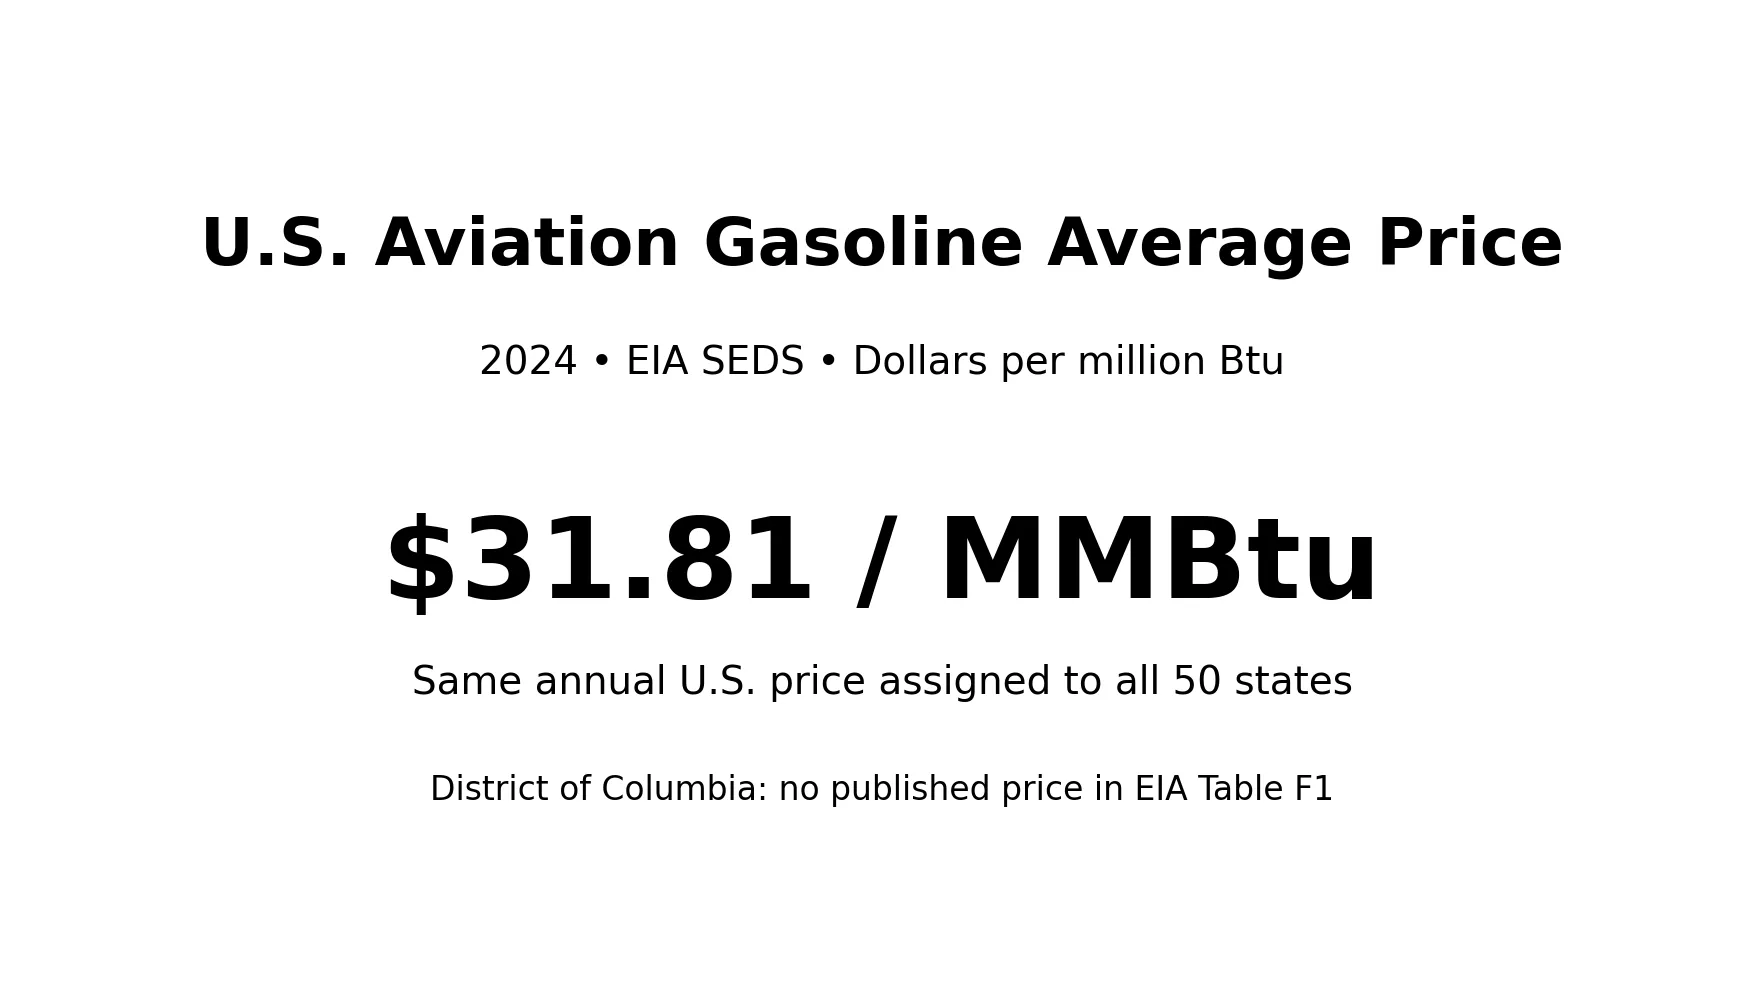
Table of Contents
What stands out in the 2024 state data
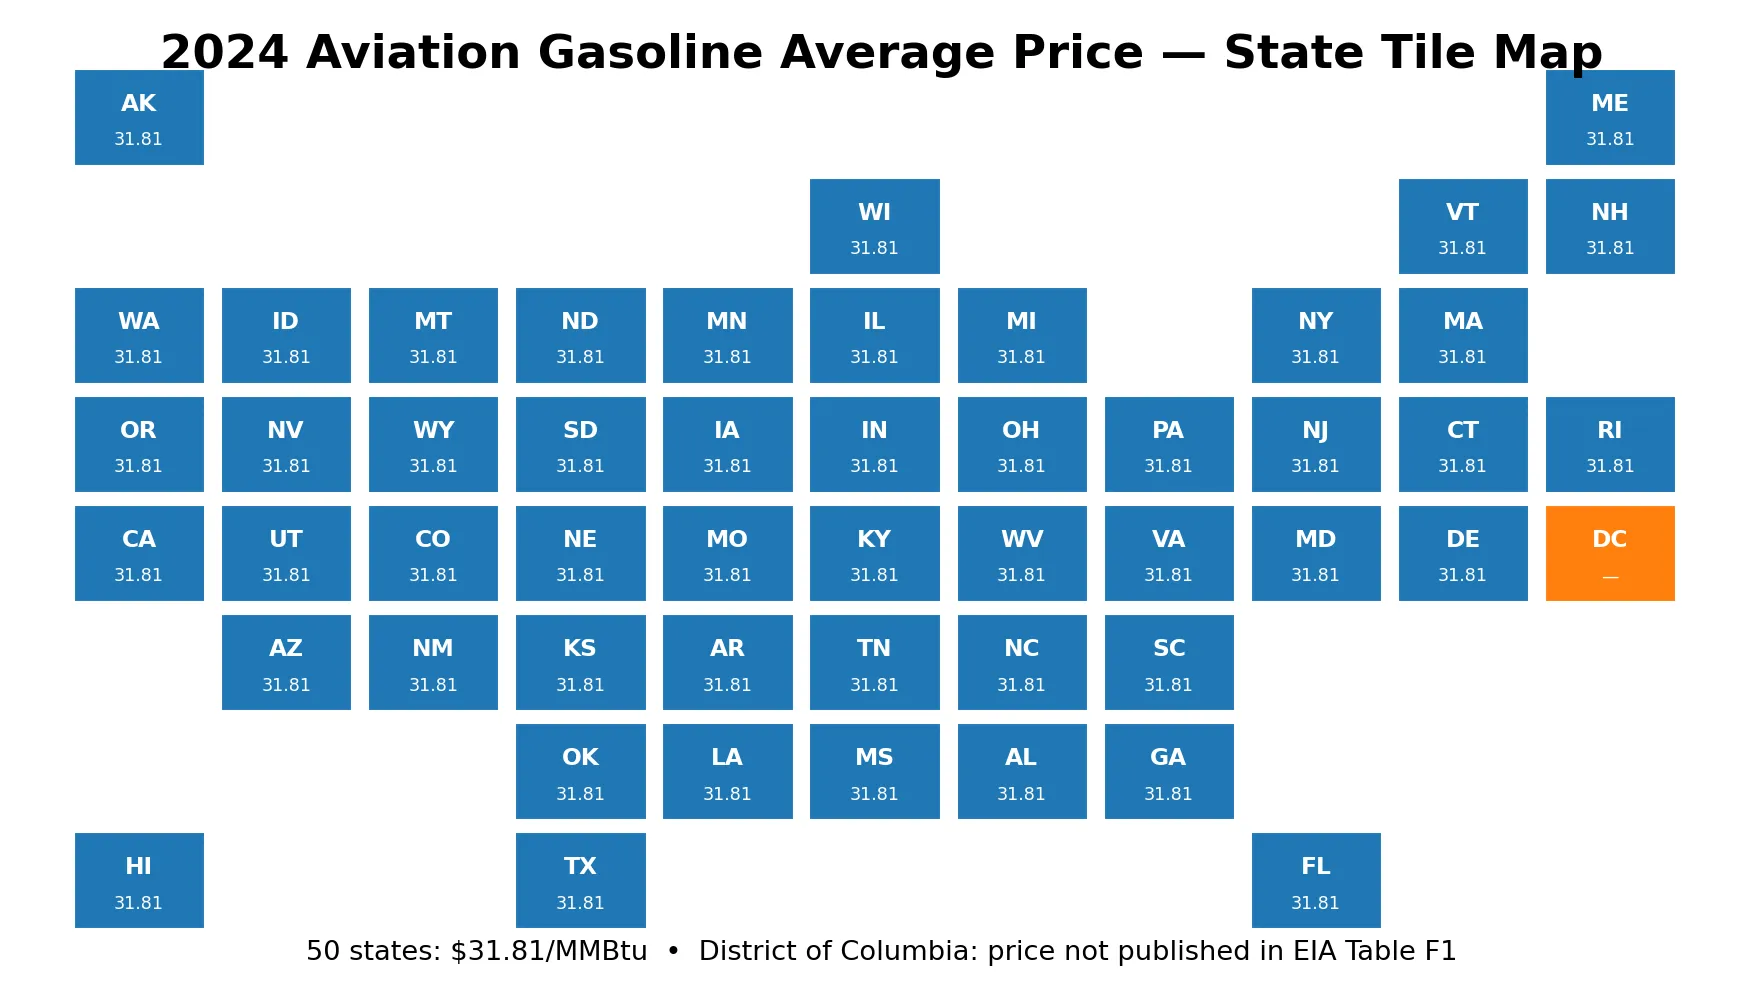
Every positive observation across the 51 jurisdictions is exactly 31.81. Among the 50 states, the minimum, maximum, median, and every individual value are the same. The positive-value range is therefore zero. A conventional “highest-price state” or “lowest-price state” ranking would manufacture distinctions that the source does not contain. The correct conclusion is a 50-state tie, not a price ladder.
The District of Columbia needs separate treatment. D.C. is shown as 0.00 in the state data, but EIA Table F1 reports aviation-gasoline consumption there as zero and places a dash in the price and expenditure columns. That presentation indicates the 0.00 entry should not be read as an observed market price of $0.00/MMBtu. The visualizations keep the underlying row visible while labeling it as no published price.
Why all 50 states have the same aviation-gasoline price
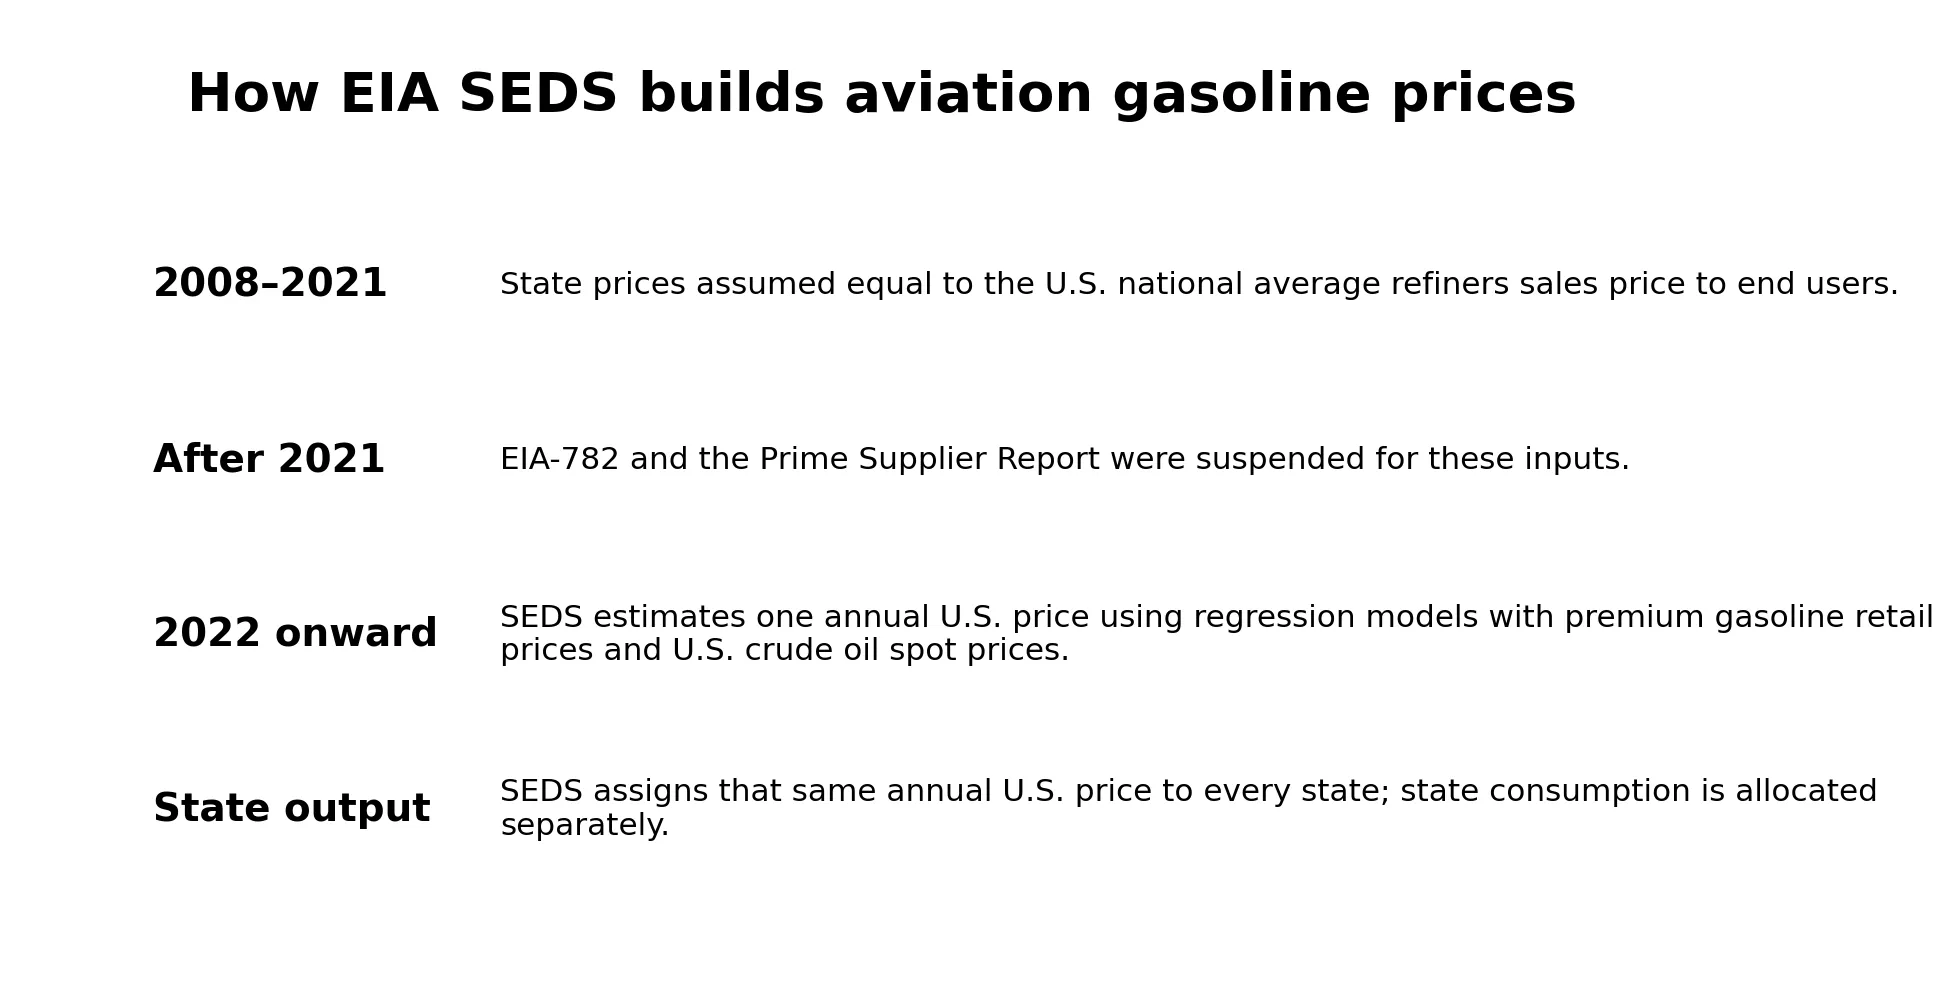
The explanation is in the SEDS methodology rather than in a perfectly synchronized retail market. After data year 2021, EIA suspended the EIA-782 survey and the Prime Supplier Report inputs that had supplied end-user prices and state sales volumes. For 2022 forward, SEDS estimates the U.S.-level aviation-gasoline price with regression models. Historical SEDS U.S. aviation-gasoline prices are the dependent variable, while U.S. premium gasoline retail prices and U.S. crude-oil spot prices are among the independent variables described by EIA.
Once that annual U.S. price is estimated, SEDS assigns it to every state. State consumption is handled separately: EIA allocates U.S. aviation-gasoline product supplied to states using 2021 state shares. In other words, a state can have a different amount of aviation-gasoline consumption while still carrying the same price per million Btu in this particular price series.
The practice of using a national price for states also predates the 2022 methodology change. EIA technical notes say that for 2008 through 2021 SEDS assumed aviation-gasoline prices for all states were equal to the national average refiners sales price to end users. The post-2021 change altered how the U.S. price itself is estimated, but not the core feature that a common national annual price is applied across states.
What $31.81 per million Btu means
The unit is dollars per million British thermal units, not dollars per gallon. SEDS converts energy prices into a common heat-content basis so prices and expenditures can be combined consistently across fuels. Reading 31.81 as a pump price per gallon would be a unit error. Actual retail avgas prices at airports can differ with location, fuel grade, distribution costs, local conditions, and timing, none of which can be recovered from this state SEDS price slice.
Aviation gasoline is also not the same product as jet fuel. Avgas is associated primarily with piston-engine aircraft, whereas jet fuel is a distinct petroleum product used by turbine aircraft. EIA lists them separately in SEDS transportation and petroleum tables. Calling this series an “all aviation fuel price” would therefore broaden the metric beyond what the dataset measures.
The map shows a methodology pattern, not a regional price pattern
Maps usually help reveal geographic variation, but here a nearly uniform map is itself the finding. Fifty identical state values mean there is no state-level price gradient to interpret. Coastal versus inland, north versus south, or high-cost versus low-cost state narratives are not supported by this price series. The geographic unit is state, but the underlying price input is national.
D.C. reinforces why missing or non-applicable values must not be converted into a low-price color. If the D.C. 0.00 entry were placed on the same continuous scale as 31.81, the map would imply an extreme price difference that EIA’s published table does not show. Separating “price not published” from observed prices preserves the meaning of the source.
All 51 state and jurisdiction records
The table below preserves all 51 rows in alphabetical order. It does not invent a ranking because the 50 state values are tied. D.C. is shown as 0.00 in the state data, accompanied by a note that EIA Table F1 displays a dash for its price when consumption is zero.
| State or jurisdiction | Code | Year | SEDS value ($/MMBtu) | Interpretation |
|---|---|---|---|---|
| Alabama | AL | 2024 | 31.81 | Same annual U.S. price |
| Alaska | AK | 2024 | 31.81 | Same annual U.S. price |
| Arizona | AZ | 2024 | 31.81 | Same annual U.S. price |
| Arkansas | AR | 2024 | 31.81 | Same annual U.S. price |
| California | CA | 2024 | 31.81 | Same annual U.S. price |
| Colorado | CO | 2024 | 31.81 | Same annual U.S. price |
| Connecticut | CT | 2024 | 31.81 | Same annual U.S. price |
| Delaware | DE | 2024 | 31.81 | Same annual U.S. price |
| District of Columbia | DC | 2024 | 0.00 | EIA Table F1 shows price — (zero consumption) |
| Florida | FL | 2024 | 31.81 | Same annual U.S. price |
| Georgia | GA | 2024 | 31.81 | Same annual U.S. price |
| Hawaii | HI | 2024 | 31.81 | Same annual U.S. price |
| Idaho | ID | 2024 | 31.81 | Same annual U.S. price |
| Illinois | IL | 2024 | 31.81 | Same annual U.S. price |
| Indiana | IN | 2024 | 31.81 | Same annual U.S. price |
| Iowa | IA | 2024 | 31.81 | Same annual U.S. price |
| Kansas | KS | 2024 | 31.81 | Same annual U.S. price |
| Kentucky | KY | 2024 | 31.81 | Same annual U.S. price |
| Louisiana | LA | 2024 | 31.81 | Same annual U.S. price |
| Maine | ME | 2024 | 31.81 | Same annual U.S. price |
| Maryland | MD | 2024 | 31.81 | Same annual U.S. price |
| Massachusetts | MA | 2024 | 31.81 | Same annual U.S. price |
| Michigan | MI | 2024 | 31.81 | Same annual U.S. price |
| Minnesota | MN | 2024 | 31.81 | Same annual U.S. price |
| Mississippi | MS | 2024 | 31.81 | Same annual U.S. price |
| Missouri | MO | 2024 | 31.81 | Same annual U.S. price |
| Montana | MT | 2024 | 31.81 | Same annual U.S. price |
| Nebraska | NE | 2024 | 31.81 | Same annual U.S. price |
| Nevada | NV | 2024 | 31.81 | Same annual U.S. price |
| New Hampshire | NH | 2024 | 31.81 | Same annual U.S. price |
| New Jersey | NJ | 2024 | 31.81 | Same annual U.S. price |
| New Mexico | NM | 2024 | 31.81 | Same annual U.S. price |
| New York | NY | 2024 | 31.81 | Same annual U.S. price |
| North Carolina | NC | 2024 | 31.81 | Same annual U.S. price |
| North Dakota | ND | 2024 | 31.81 | Same annual U.S. price |
| Ohio | OH | 2024 | 31.81 | Same annual U.S. price |
| Oklahoma | OK | 2024 | 31.81 | Same annual U.S. price |
| Oregon | OR | 2024 | 31.81 | Same annual U.S. price |
| Pennsylvania | PA | 2024 | 31.81 | Same annual U.S. price |
| Rhode Island | RI | 2024 | 31.81 | Same annual U.S. price |
| South Carolina | SC | 2024 | 31.81 | Same annual U.S. price |
| South Dakota | SD | 2024 | 31.81 | Same annual U.S. price |
| Tennessee | TN | 2024 | 31.81 | Same annual U.S. price |
| Texas | TX | 2024 | 31.81 | Same annual U.S. price |
| Utah | UT | 2024 | 31.81 | Same annual U.S. price |
| Vermont | VT | 2024 | 31.81 | Same annual U.S. price |
| Virginia | VA | 2024 | 31.81 | Same annual U.S. price |
| Washington | WA | 2024 | 31.81 | Same annual U.S. price |
| West Virginia | WV | 2024 | 31.81 | Same annual U.S. price |
| Wisconsin | WI | 2024 | 31.81 | Same annual U.S. price |
| Wyoming | WY | 2024 | 31.81 | Same annual U.S. price |
What this dataset can and cannot tell you
The dataset can support a precise statement about SEDS accounting: in 2024, the aviation-gasoline average-price series applies $31.81/MMBtu to each of the 50 states. It also demonstrates how EIA’s post-2021 price methodology creates a common state value from one U.S.-level estimate. This is useful for interpreting state energy expenditure calculations and for avoiding false state price comparisons.
It cannot tell you which state had the highest airport retail avgas price, how much local taxes or delivery costs differed, or what pilots paid at individual airports. Those questions require transaction-level, airport-level, or other locally observed price sources. Nor does one annual 2024 value show monthly volatility or short-lived price spikes.
A practical checklist for reading the series
Treat 31.81 as an annual SEDS energy-unit price, not a local pump quote. Do not rank D.C. at zero. Keep dollars per million Btu separate from dollars per gallon. Keep aviation gasoline separate from jet fuel. Finally, remember that identical state values can be a methodological feature rather than evidence that real-world local prices were literally identical.
The central takeaway is therefore methodological: the 2024 state map is uniform because EIA SEDS deliberately assigns the same estimated annual U.S. aviation-gasoline price to every state. The lack of variation is the correct result for this series, not a defect that should be “fixed” by creating artificial state differences.
Official sources and interpretation
The values and methodology are checked against the U.S. Energy Information Administration State Energy Data System (SEDS). The 2024 fuel table shows $31.81/MMBtu for every state and a dash for the District of Columbia. EIA’s methodology-change note says that, from 2022 forward, SEDS estimates one U.S.-level annual aviation-gasoline price with regression models and assigns that same price to every state.
Frequently Asked Questions
Why do all 50 states have the same 2024 aviation gasoline average price?
From 2022 forward, EIA SEDS estimates one annual U.S.-level aviation-gasoline price with regression models and assigns that same price to every state. The 2024 value is $31.81/MMBtu.
Does the 0.00 value for the District of Columbia mean free aviation gasoline?
No. D.C. is shown as 0.00 in the state data, but EIA Table F1 shows zero consumption for D.C. and a dash in the price column. It should not be treated as an observed zero-dollar market price.
Is $31.81/MMBtu the same as a gallon price at an airport?
No. It is a heat-content-based price in dollars per million Btu. Actual airport retail prices are usually quoted per gallon and can vary locally.
Is aviation gasoline the same as jet fuel?
No. Aviation gasoline, or avgas, is mainly used in piston-engine aircraft. Jet fuel is a separate petroleum product used by turbine aircraft and is reported separately by EIA.
Related Articles
Green Map creates custom-edited map images using open geographic data sources such as geoBoundaries, Natural Earth, OpenStreetMap, and government open data. These maps are edited visual materials, not raw data files, and are provided for education, documents, presentations, and graphic reference.