World Bank indicator NV.IND.TOTL.ZS measures industry, including construction, value added as a percentage of GDP. Industry here is broader than manufacturing: it covers mining and quarrying, manufacturing, construction, electricity, gas, water, and related industrial activities within the World Bank’s ISIC-based definition. The latest non-empty file contains 208 observations, and 158 are from 2025, so the main cross-country comparison uses those 158 economies.
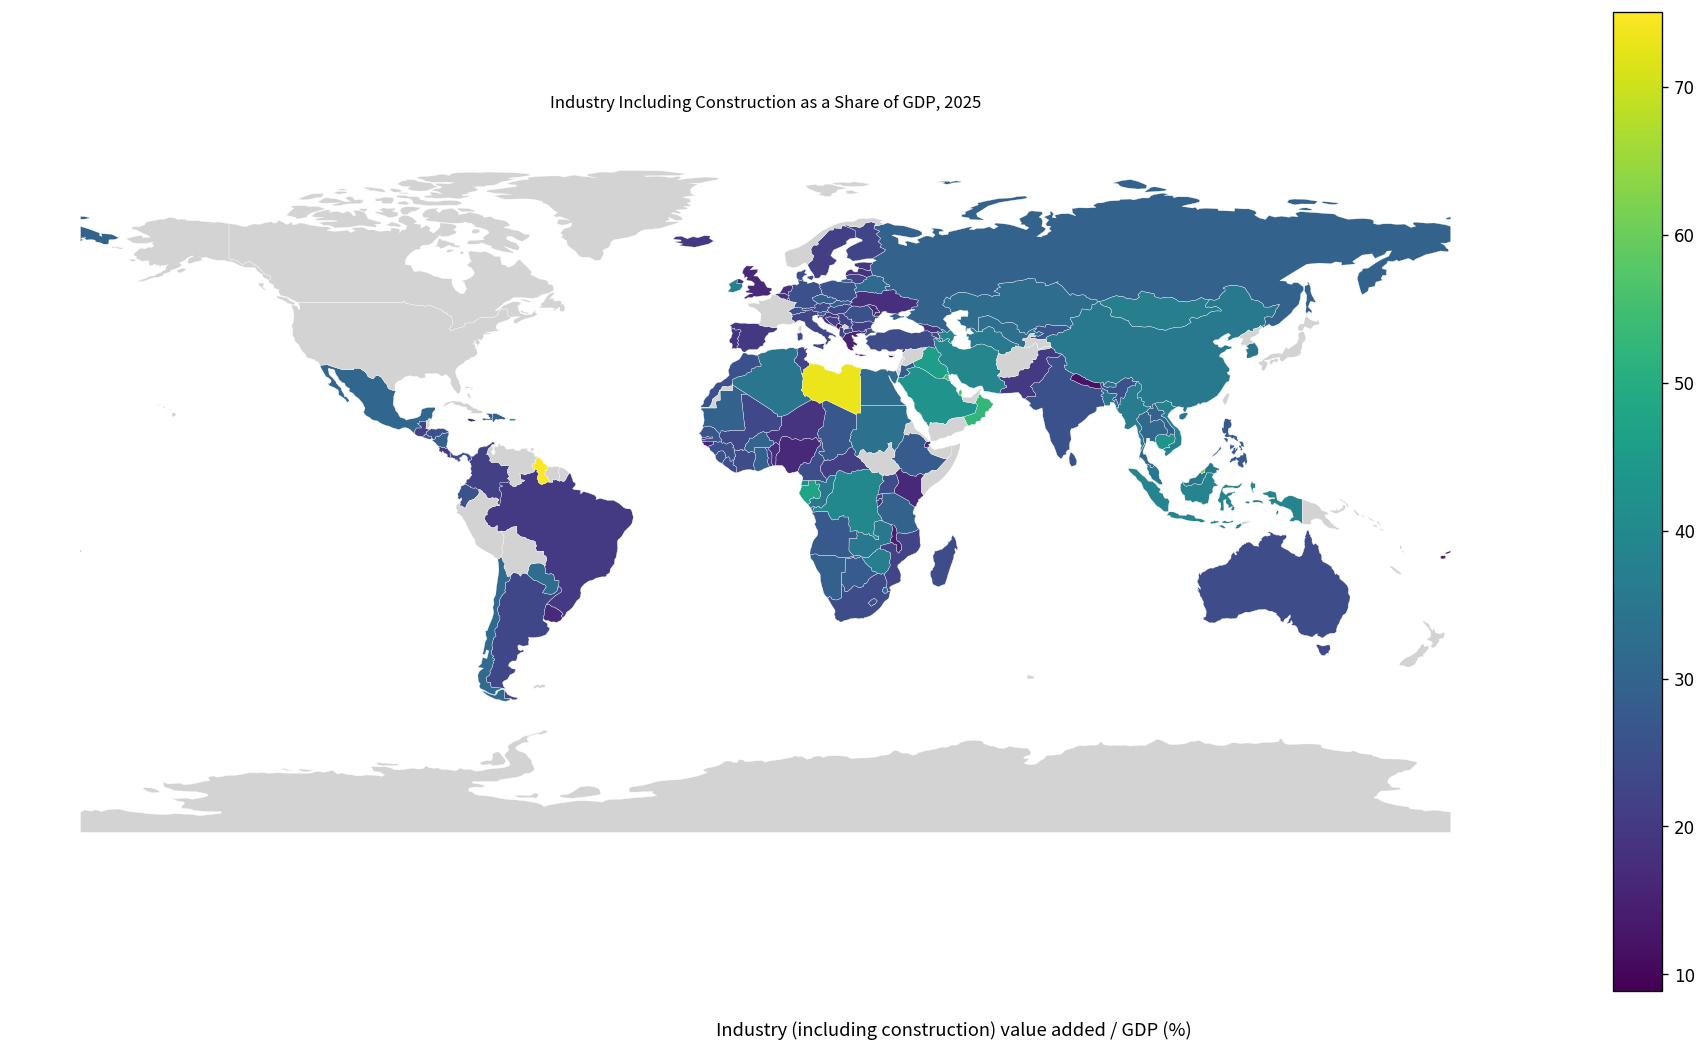
Table of Contents
What industry including construction value added means
Value added is the value of output produced minus the value of intermediate goods and services consumed in production. It is designed to measure the new economic value contributed by an industry without double-counting inputs purchased from other producers.
This indicator divides industrial value added by GDP. It therefore describes economic structure—the share of total domestic production accounted for by industry—rather than the absolute monetary size of the sector.
It is broader than manufacturing
The industry aggregate includes manufacturing, but it also contains mining and quarrying, construction, electricity, gas, water, and related activities. A manufacturing value-added share is a narrower measure.
That distinction matters because an oil- or mineral-producing economy can have a very high industry share even when manufacturing is not unusually large. Construction booms can also lift the aggregate.
The 2025 mean is 26.11% and the median is 24.65%
The 2025 subset contains 158 economies. Its mean is 26.11% and median 24.65%. The first quartile is 18.69% and the third quartile 31.34%, placing the middle half roughly between 18.69% and 31.34%.
43 economies are at or above 30%, 13 are at or above 40%, and 6 reach 50% or more. At the lower end, 17 are below 15%.
Guyana is highest in 2025 at 75.09%
Guyana records 75.09%, followed by Libya at 73.25%, Brunei Darussalam at 60.00%, Qatar at 57.04%, Kuwait at 54.12%, and Oman at 52.74%. Several of the highest values occur in economies where oil, gas, or mining are major contributors to GDP.
| 2025 rank | Economy/territory | Industry including construction / GDP |
|---|---|---|
| 1 | Guyana | 75.09% |
| 2 | Libya | 73.25% |
| 3 | Brunei Darussalam | 60.00% |
| 4 | Qatar | 57.04% |
| 5 | Kuwait | 54.12% |
| 6 | Oman | 52.74% |
| 7 | Gabon | 47.19% |
| 8 | Puerto Rico (US) | 47.03% |
| 9 | Iraq | 45.39% |
| 10 | Cambodia | 43.14% |
| 11 | Saudi Arabia | 42.97% |
| 12 | Equatorial Guinea | 41.41% |
| 13 | Bahrain | 41.21% |
| 14 | Congo, Dem. Rep. | 39.71% |
| 15 | Iran, Islamic Rep. | 39.64% |
| 16 | Azerbaijan | 39.51% |
| 17 | Indonesia | 38.71% |
| 18 | Ireland | 37.76% |
| 19 | Viet Nam | 37.65% |
| 20 | Mongolia | 37.25% |
A high share means industry contributes a large portion of GDP. It does not automatically imply a more advanced economy or stronger manufacturing competitiveness. Resource extraction, manufacturing, utilities, and construction can produce very different industrial structures under the same aggregate percentage.
Sao Tome and Principe is lowest in 2025 at 2.23%
At the lower end, Sao Tome and Principe records 2.23%, Micronesia, Fed. Sts. 5.28%, Luxembourg 8.88%, Maldives 9.33%, Comoros 9.87%, and Malta 10.08%.
| Low-order position in 2025 | Economy/territory | Industry including construction / GDP |
|---|---|---|
| 1 | Sao Tome and Principe | 2.23% |
| 2 | Micronesia, Fed. Sts. | 5.28% |
| 3 | Luxembourg | 8.88% |
| 4 | Maldives | 9.33% |
| 5 | Comoros | 9.87% |
| 6 | Malta | 10.08% |
| 7 | Samoa | 10.17% |
| 8 | St. Lucia | 10.69% |
| 9 | Cabo Verde | 10.72% |
| 10 | Cyprus | 11.15% |
| 11 | Montenegro | 11.25% |
| 12 | Nepal | 12.05% |
| 13 | Andorra | 12.79% |
| 14 | Fiji | 13.88% |
| 15 | Dominica | 14.11% |
| 16 | Malawi | 14.30% |
| 17 | Seychelles | 14.35% |
| 18 | St. Vincent and the Grenadines | 15.11% |
| 19 | Greece | 15.22% |
| 20 | Grenada | 15.49% |
A low industry share often accompanies service-oriented economic structures, but it is not a negative score. Tourism, finance, public services, and other service activities can dominate GDP in economies with relatively small industrial sectors.
Services shares help complete the structural picture
GDP is built from value added across agriculture, industry, services, and associated accounting items. Reading industry alongside services makes it easier to see whether an economy is more resource- and goods-oriented or more service-oriented.
The sector shares should not always be assumed to sum mechanically to exactly 100% because GDP accounting can include taxes, subsidies, and methodological adjustments.
Industry share and industry growth are different measures
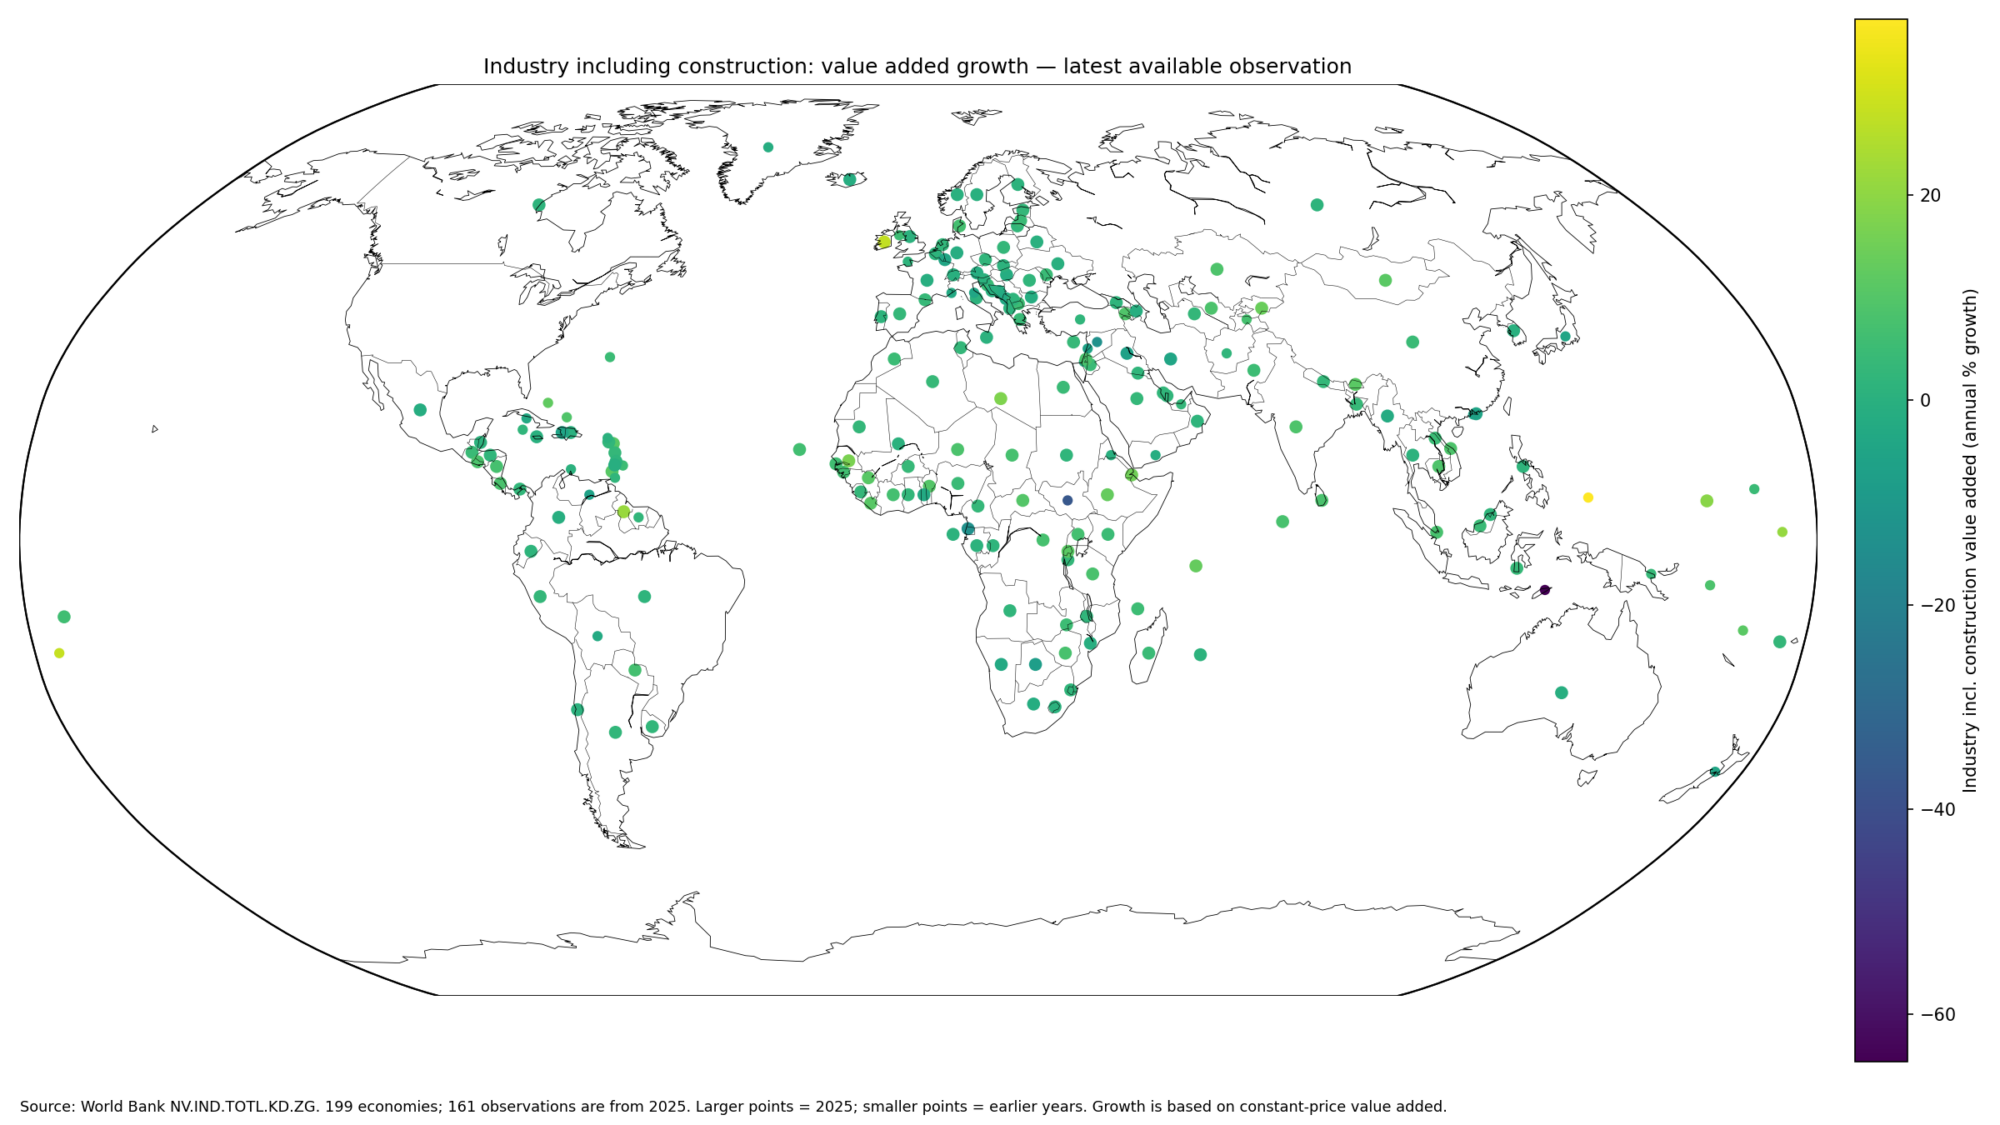
The share measures the weight of industry in GDP. Growth measures how industrial value added changes over time. A country can have a very large industrial share but slow industrial growth, or a small share but rapid growth.
A structural comparison and a growth comparison therefore answer different questions and should not be substituted for one another.
A high industry share is not a manufacturing-competitiveness score
Because mining and construction are included, the aggregate cannot isolate manufacturing capability. Assessing manufacturing competitiveness requires measures such as manufacturing value added, manufacturing productivity, export sophistication, or medium- and high-tech manufacturing shares.
Oil- and gas-rich economies are a clear example: high industry shares can be driven largely by extraction rather than manufacturing.
A percentage does not show absolute industrial size
A small economy with industry equal to 50% of GDP can still have a much smaller monetary amount of industrial value added than a large economy with a 20% share.
Absolute size comparisons require a value-added series measured in currency terms, either current or constant prices.
Construction cycles can move the aggregate
Construction is part of the indicator. Large infrastructure programs, housing booms, or post-disaster rebuilding can raise the industrial share even if manufacturing and mining are unchanged.
Explaining changes in the aggregate is therefore easier when mining, manufacturing, utilities, and construction are examined separately.
Why 2025 is the main comparison year
Of the 208 latest non-empty observations, 158 are from 2025, or about 76.0%. There are 31 from 2024 and 7 from 2023, while a few final observations are much older.
| Observation year | Economies/territories | Share of 208 |
|---|---|---|
| 2025 | 158 | 76.0% |
| 2024 | 31 | 14.9% |
| 2023 | 7 | 3.4% |
| 2022 | 2 | 1.0% |
| 2021 | 2 | 1.0% |
| 2020 | 1 | 0.5% |
| 2019 | 1 | 0.5% |
| 2018 | 1 | 0.5% |
| 2015 | 2 | 1.0% |
| 2011 | 1 | 0.5% |
| 2009 | 1 | 0.5% |
| 1986 | 1 | 0.5% |
The complete 208-row file should not be described as a single-year 2025 ranking. Same-year statistics and rankings use the 158 observations dated 2025, while the full table preserves each economy’s latest available observation.
Old latest observations may not describe the current economic structure
Industrial structure can change rapidly because of commodity prices, investment, conflict, technology, urbanization, industrial policy, and construction cycles. A final observation from many years ago is historically valid but may not represent the current economy.
Observation year is therefore essential context in the mixed-year table.
Complete list of the 208 latest observations
The table below lists every economy and territory’s latest non-empty observation alphabetically, with the observation year shown beside the industry share.
| Economy/territory | Observation year | Industry including construction / GDP |
|---|---|---|
| Afghanistan | 2024 | 14.52% |
| Albania | 2025 | 21.83% |
| Algeria | 2025 | 34.80% |
| Andorra | 2025 | 12.79% |
| Angola | 2025 | 27.07% |
| Antigua and Barbuda | 2025 | 18.17% |
| Argentina | 2025 | 22.87% |
| Armenia | 2025 | 23.07% |
| Aruba | 2023 | 10.84% |
| Australia | 2025 | 23.89% |
| Austria | 2025 | 23.98% |
| Azerbaijan | 2025 | 39.51% |
| Bahamas, The | 2024 | 9.63% |
| Bahrain | 2025 | 41.21% |
| Bangladesh | 2025 | 34.03% |
| Barbados | 2024 | 12.21% |
| Belarus | 2025 | 31.58% |
| Belgium | 2025 | 18.61% |
| Belize | 2024 | 14.57% |
| Benin | 2025 | 17.50% |
| Bermuda | 2024 | 4.90% |
| Bhutan | 2025 | 33.16% |
| Bolivia | 2024 | 31.26% |
| Bosnia and Herzegovina | 2025 | 21.54% |
| Botswana | 2025 | 27.88% |
| Brazil | 2025 | 20.15% |
| Brunei Darussalam | 2025 | 60.00% |
| Bulgaria | 2025 | 21.21% |
| Burkina Faso | 2025 | 30.06% |
| Burundi | 2025 | 18.23% |
| Cabo Verde | 2025 | 10.72% |
| Cambodia | 2025 | 43.14% |
| Cameroon | 2025 | 24.77% |
| Canada | 2022 | 27.35% |
| Cayman Islands | 2024 | 7.64% |
| Central African Republic | 2025 | 21.22% |
| Chad | 2025 | 26.74% |
| Channel Islands | 2023 | 8.22% |
| Chile | 2025 | 31.42% |
| China | 2025 | 35.64% |
| Colombia | 2025 | 21.76% |
| Comoros | 2025 | 9.87% |
| Congo, Dem. Rep. | 2025 | 39.71% |
| Congo, Rep. | 2025 | 35.61% |
| Costa Rica | 2025 | 19.88% |
| Cote d’Ivoire | 2025 | 23.93% |
| Croatia | 2025 | 18.95% |
| Cuba | 2024 | 23.85% |
| Curacao | 2024 | 12.19% |
| Cyprus | 2025 | 11.15% |
| Czechia | 2025 | 28.71% |
| Denmark | 2025 | 24.84% |
| Djibouti | 2025 | 16.58% |
| Dominica | 2025 | 14.11% |
| Dominican Republic | 2025 | 28.42% |
| Ecuador | 2025 | 25.67% |
| Egypt, Arab Rep. | 2025 | 32.06% |
| El Salvador | 2025 | 24.48% |
| Equatorial Guinea | 2025 | 41.41% |
| Eritrea | 2009 | 21.82% |
| Estonia | 2025 | 19.73% |
| Eswatini | 2025 | 33.58% |
| Ethiopia | 2025 | 27.76% |
| Faroe Islands | 2024 | 18.30% |
| Fiji | 2025 | 13.88% |
| Finland | 2025 | 22.52% |
| France | 2025 | 16.78% |
| French Polynesia | 2020 | 10.65% |
| Gabon | 2025 | 47.19% |
| Gambia, The | 2025 | 15.83% |
| Georgia | 2025 | 18.60% |
| Germany | 2025 | 25.16% |
| Ghana | 2025 | 29.25% |
| Greece | 2025 | 15.22% |
| Greenland | 2023 | 18.45% |
| Grenada | 2025 | 15.49% |
| Guatemala | 2025 | 21.79% |
| Guinea | 2025 | 25.39% |
| Guinea-Bissau | 2025 | 15.74% |
| Guyana | 2025 | 75.09% |
| Haiti | 2025 | 27.50% |
| Honduras | 2025 | 25.39% |
| Hong Kong SAR, China | 2024 | 6.17% |
| Hungary | 2025 | 22.97% |
| Iceland | 2025 | 20.06% |
| India | 2025 | 25.20% |
| Indonesia | 2025 | 38.71% |
| Iran, Islamic Rep. | 2025 | 39.64% |
| Iraq | 2025 | 45.39% |
| Ireland | 2025 | 37.76% |
| Isle of Man | 2023 | 7.46% |
| Israel | 2024 | 17.23% |
| Italy | 2025 | 22.64% |
| Jamaica | 2025 | 16.28% |
| Japan | 2024 | 26.78% |
| Jordan | 2025 | 27.37% |
| Kazakhstan | 2025 | 32.35% |
| Kenya | 2025 | 16.27% |
| Kiribati | 2024 | 11.78% |
| Korea, Rep. | 2025 | 34.33% |
| Kosovo | 2025 | 24.97% |
| Kuwait | 2025 | 54.12% |
| Kyrgyz Republic | 2025 | 26.46% |
| Lao PDR | 2025 | 29.17% |
| Latvia | 2025 | 18.68% |
| Lebanon | 2024 | 2.63% |
| Lesotho | 2025 | 25.16% |
| Liberia | 2025 | 24.53% |
| Libya | 2025 | 73.25% |
| Liechtenstein | 2023 | 39.11% |
| Lithuania | 2025 | 22.15% |
| Luxembourg | 2025 | 8.88% |
| Macao SAR, China | 2024 | 4.69% |
| Madagascar | 2025 | 23.90% |
| Malawi | 2025 | 14.30% |
| Malaysia | 2025 | 35.67% |
| Maldives | 2025 | 9.33% |
| Mali | 2025 | 23.35% |
| Malta | 2025 | 10.08% |
| Marshall Islands | 2024 | 13.41% |
| Mauritania | 2025 | 29.75% |
| Mauritius | 2025 | 17.69% |
| Mexico | 2025 | 30.56% |
| Micronesia, Fed. Sts. | 2025 | 5.28% |
| Moldova | 2025 | 16.92% |
| Monaco | 2024 | 12.80% |
| Mongolia | 2025 | 37.25% |
| Montenegro | 2025 | 11.25% |
| Morocco | 2025 | 25.25% |
| Mozambique | 2025 | 22.08% |
| Myanmar | 2025 | 36.20% |
| Namibia | 2025 | 28.95% |
| Nepal | 2025 | 12.05% |
| Netherlands | 2025 | 17.68% |
| New Caledonia | 2019 | 22.33% |
| New Zealand | 2023 | 19.44% |
| Nicaragua | 2025 | 29.26% |
| Niger | 2025 | 18.72% |
| Nigeria | 2025 | 16.44% |
| North Macedonia | 2025 | 24.09% |
| Norway | 2025 | 34.46% |
| Oman | 2025 | 52.74% |
| Pakistan | 2025 | 20.06% |
| Palau | 2024 | 13.02% |
| Panama | 2025 | 24.90% |
| Papua New Guinea | 2024 | 36.53% |
| Paraguay | 2025 | 32.32% |
| Peru | 2024 | 34.32% |
| Philippines | 2025 | 26.99% |
| Poland | 2025 | 25.84% |
| Portugal | 2025 | 18.25% |
| Puerto Rico (US) | 2025 | 47.03% |
| Qatar | 2025 | 57.04% |
| Romania | 2025 | 25.34% |
| Russian Federation | 2025 | 29.67% |
| Rwanda | 2025 | 22.04% |
| Samoa | 2025 | 10.17% |
| San Marino | 2023 | 35.77% |
| Sao Tome and Principe | 2025 | 2.23% |
| Saudi Arabia | 2025 | 42.97% |
| Senegal | 2025 | 26.15% |
| Serbia | 2025 | 22.31% |
| Seychelles | 2025 | 14.35% |
| Sierra Leone | 2025 | 25.70% |
| Singapore | 2025 | 22.67% |
| Sint Maarten (Dutch part) | 2021 | 6.03% |
| Slovak Republic | 2025 | 28.10% |
| Slovenia | 2025 | 28.34% |
| Solomon Islands | 2024 | 23.37% |
| Somalia, Fed. Rep. | 1986 | 9.66% |
| South Africa | 2025 | 24.09% |
| South Sudan | 2015 | 33.09% |
| Spain | 2025 | 19.58% |
| Sri Lanka | 2025 | 25.44% |
| St. Kitts and Nevis | 2025 | 20.85% |
| St. Lucia | 2025 | 10.69% |
| St. Vincent and the Grenadines | 2025 | 15.11% |
| Sudan | 2025 | 33.65% |
| Suriname | 2024 | 35.05% |
| Sweden | 2025 | 21.03% |
| Switzerland | 2025 | 25.00% |
| Syrian Arab Republic | 2022 | 11.94% |
| Tajikistan | 2024 | 32.44% |
| Tanzania | 2025 | 29.79% |
| Thailand | 2025 | 31.07% |
| Timor-Leste | 2024 | 11.82% |
| Togo | 2025 | 21.02% |
| Tonga | 2024 | 17.67% |
| Trinidad and Tobago | 2024 | 34.64% |
| Tunisia | 2025 | 21.96% |
| Turkiye | 2025 | 24.02% |
| Turkmenistan | 2025 | 35.97% |
| Turks and Caicos Islands | 2024 | 9.34% |
| Tuvalu | 2015 | 7.03% |
| Uganda | 2025 | 24.27% |
| Ukraine | 2025 | 17.87% |
| United Arab Emirates | 2024 | 44.33% |
| United Kingdom | 2025 | 16.49% |
| United States | 2021 | 17.58% |
| Uruguay | 2025 | 16.89% |
| Uzbekistan | 2025 | 32.54% |
| Vanuatu | 2024 | 10.06% |
| Venezuela, RB | 2011 | 0.00% |
| Viet Nam | 2025 | 37.65% |
| West Bank and Gaza | 2024 | 16.25% |
| Yemen, Rep. | 2018 | 25.44% |
| Zambia | 2025 | 35.33% |
| Zimbabwe | 2025 | 37.07% |
How to interpret the comparison
First, the measure includes mining, manufacturing, construction, electricity, gas, water, and related activities. Second, it is a value-added share rather than production volume or revenue. Third, a high percentage is not automatically a measure of development or manufacturing strength.
Fourth, the percentage does not reveal absolute industrial size. Fifth, industry growth and industry share are different measures. Sixth, the full 208-row file mixes years, so the main comparison uses the 158 observations from 2025.
Source and calculation
The source is World Bank World Development Indicators NV.IND.TOTL.ZS, Industry (including construction), value added (% of GDP). The 2025 mean, median, quartiles, threshold counts, and rankings use only the 158 observations dated 2025. The complete table preserves all 208 latest non-empty observations.
Frequently Asked Questions
Does this indicator mean manufacturing share of GDP?
No. It includes mining, manufacturing, construction, electricity, gas, water, and related industrial activities.
What is the 2025 median?
The median across the 158 observations dated 2025 is 24.65%, while the mean is 26.11%.
Does a high industry share mean an economy is more developed?
Not necessarily. A high share can reflect resource extraction, manufacturing, construction, or utilities, so it is not a direct development score.
Related Articles
Green Map creates custom-edited map images using open geographic data sources such as geoBoundaries, Natural Earth, OpenStreetMap, and government open data. These maps are edited visual materials, not raw data files, and are provided for education, documents, presentations, and graphic reference.