The World Bank fuel-exports indicator measures fuels as a percentage of merchandise exports. Fuels are defined as commodities in SITC Revision 3 section 3: mineral fuels, lubricants, and related materials. The latest non-empty file contains 197 observations. Only 24 are from 2025, while 104 are from 2024, making 2024 the largest recent same-year comparison group.
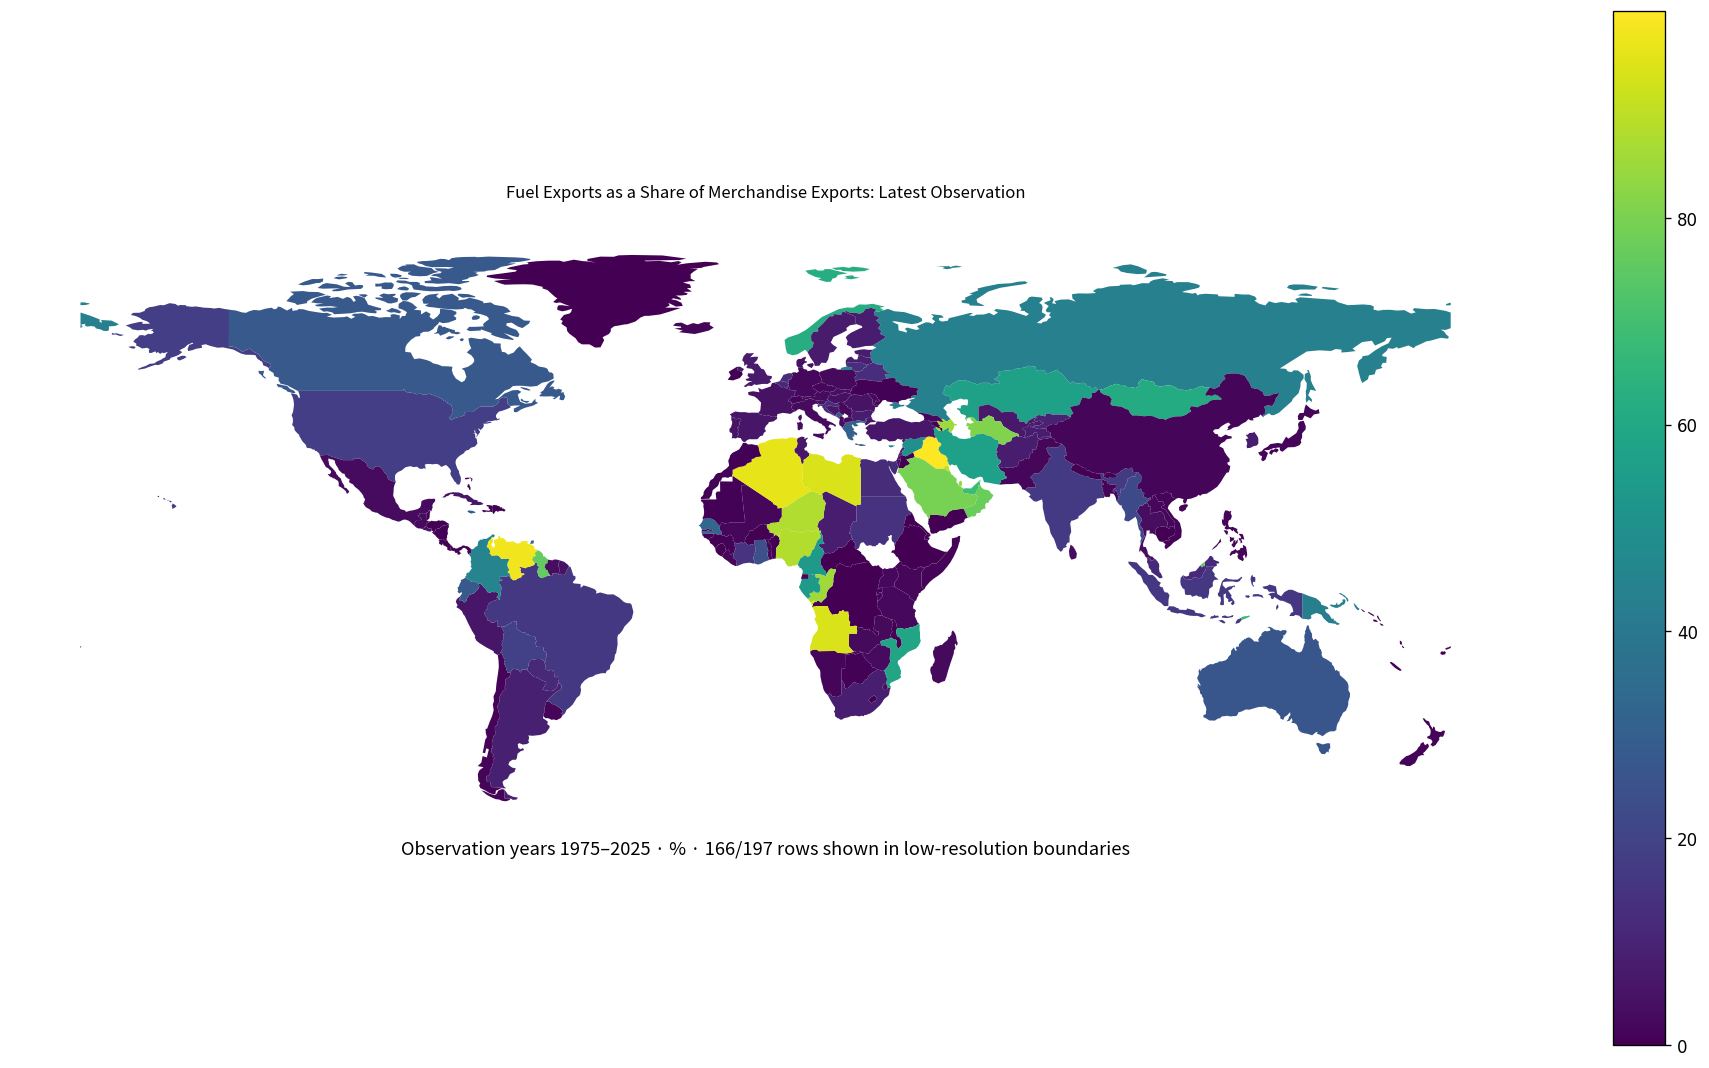
Table of Contents
The denominator is merchandise exports
A fuel-export share of 60% does not mean fuels account for 60% of all exports, GDP, or domestic production. The denominator is merchandise exports, meaning exported goods. Service exports are outside this denominator.
The measure is therefore about the composition of merchandise trade. To evaluate fuels in total exports, services would need to be added separately. To evaluate the role of energy in the whole economy, GDP, fiscal revenue, employment, and production data are also needed.
Fuels follow SITC Revision 3 section 3
The World Bank definition uses SITC Revision 3 section 3, which covers mineral fuels, lubricants, and related materials. It is broader than crude oil alone.
The indicator should therefore not be relabeled as the crude-oil export share. Identifying whether crude oil, refined products, gas, or another fuel category drives the result requires more detailed commodity data.
Merchandise exports are a trade-statistics concept
The source describes merchandise exports as goods whose economic ownership changes between a resident and a nonresident, while certain categories are treated separately or excluded under the statistical framework.
That means the indicator should be interpreted within the merchandise-trade accounting boundary rather than as a count of every physical shipment crossing a border.
The 2024 mean is 14.35% and the median is 3.34%
The 2024 subset contains 104 economies. Its mean is 14.35% and median 3.34%. The first quartile is 0.72% and the third quartile 12.78%, placing the middle half roughly between 0.72% and 12.78%.
20 observations are at least 25%, 11 are at least 50%, 8 are at least 75%, and 2 reach 90% or more. At the lower end, 59 are below 5% and 28 are below 1%. The distribution is strongly right-skewed.
Angola is highest in 2024 at 94.13%
Angola records 94.13%, followed by Kuwait at 90.73%, Nigeria at 88.62%, Niger at 87.99%, Qatar at 83.76%, Saudi Arabia at 79.40%, Oman at 77.20%, and Brunei Darussalam at 75.47%. Mozambique, Kazakhstan, and Cayman Islands are also above 50%.
| 2024 rank | Economy/territory | Fuel exports / merchandise exports |
|---|---|---|
| 1 | Angola | 94.13% |
| 2 | Kuwait | 90.73% |
| 3 | Nigeria | 88.62% |
| 4 | Niger | 87.99% |
| 5 | Qatar | 83.76% |
| 6 | Saudi Arabia | 79.40% |
| 7 | Oman | 77.20% |
| 8 | Brunei Darussalam | 75.47% |
| 9 | Mozambique | 58.90% |
| 10 | Kazakhstan | 56.72% |
| 11 | Cayman Islands | 52.31% |
| 12 | Cyprus | 49.07% |
| 13 | Colombia | 45.30% |
| 14 | Samoa | 33.26% |
| 15 | Senegal | 32.71% |
| 16 | Trinidad and Tobago | 31.31% |
| 17 | Greece | 30.25% |
| 18 | Canada | 27.70% |
| 19 | Ecuador | 27.48% |
| 20 | Montenegro | 25.28% |
A high value means SITC section 3 fuels occupy a large share of merchandise export value. It does not directly measure domestic fuel production, reserves, total energy use, or the size of the overall economy.
Four 2024 economies report exactly 0%
Antigua and Barbuda, Bahamas, The, Gambia, The, and Seychelles each record 0% in 2024. Very small positive values include Benin at 0.000005%, Grenada at 0.000281%, Bahrain at 0.000372%, Bermuda at 0.000411%, and Mauritius at 0.000628%.
| Low-order position in 2024 | Economy/territory | Fuel exports / merchandise exports |
|---|---|---|
| 1 | Antigua and Barbuda | 0.00% |
| 2 | Bahamas, The | 0.00% |
| 3 | Gambia, The | 0.00% |
| 4 | Seychelles | 0.00% |
| 5 | Benin | 0.00% |
| 6 | Grenada | 0.00% |
| 7 | Bahrain | 0.00% |
| 8 | Bermuda | 0.00% |
| 9 | Mauritius | 0.00% |
| 10 | Cambodia | 0.00% |
| 11 | Malawi | 0.00% |
| 12 | Costa Rica | 0.02% |
| 13 | Lesotho | 0.02% |
| 14 | Burkina Faso | 0.02% |
| 15 | Honduras | 0.03% |
| 16 | Central African Republic | 0.03% |
| 17 | Fiji | 0.04% |
| 18 | Maldives | 0.10% |
| 19 | Hong Kong SAR, China | 0.11% |
| 20 | Luxembourg | 0.12% |
The zeros are source values rather than missing observations filled with zero. A 0% merchandise-export share does not prove that an economy produces no fuel, consumes no energy, or participates in no energy trade.
The 2025 group is too small for the main global comparison
Only 24 economies have a 2025 observation. Azerbaijan is highest at 85.92%, followed by Guyana at 75.89%, Norway at 62.31%, and Australia at 26.89%. The 2025 mean is 15.79% and the median 7.66%.
| 2025 high-order position | Economy/territory | Fuel exports / merchandise exports |
|---|---|---|
| 1 | Azerbaijan | 85.92% |
| 2 | Guyana | 75.89% |
| 3 | Norway | 62.31% |
| 4 | Australia | 26.89% |
| 5 | Brazil | 16.12% |
| 6 | Indonesia | 16.01% |
| 7 | Lithuania | 13.60% |
| 8 | Malaysia | 11.16% |
| 9 | Paraguay | 11.02% |
| 10 | Kyrgyz Republic | 9.40% |
| 11 | Latvia | 8.23% |
| 12 | South Africa | 8.21% |
Although 2025 is newer, its country coverage is much smaller than the 104-economy 2024 group. Differences between the 2024 and 2025 averages should not be interpreted as a worldwide one-year change because the country composition differs.
A high share is not the same as a large export value
This indicator is a composition ratio. A small merchandise-exporting economy can have an 80% fuel share, while a much larger exporter can have a 20% share and still export more fuels in dollar terms.
Absolute fuel-export values are required for scale comparisons. The share answers how concentrated the merchandise-export basket is in fuels; the value answers how much fuel trade is exported in monetary terms.
A high fuel share can imply concentration, but risk requires more evidence
When one commodity group dominates merchandise exports, international price movements can have a larger effect on export receipts. However, actual macroeconomic exposure also depends on fiscal buffers, exchange-rate arrangements, production costs, contracts, and the size of nonfuel sectors.
The share is therefore useful as a concentration signal, not as a standalone rating of economic resilience or vulnerability.
A low export share does not mean low energy dependence
An economy can have a low fuel-export share and still import large quantities of fuel or consume large amounts of energy domestically. This indicator observes only the export side of merchandise trade.
Energy self-sufficiency, import dependence, electricity generation, and total energy consumption require separate indicators. Fuel exports should not be substituted for those measures.
The 197 latest observations span 1975–2025
The latest non-empty file contains 197 observations spanning 1975–2025. The largest group is 2024 with 104 economies, followed by 2023 with 29 and 2025 with 24. Some economies retain much older final observations.
| Observation year | Economies/territories | Share of 197 |
|---|---|---|
| 2025 | 24 | 12.2% |
| 2024 | 104 | 52.8% |
| 2023 | 29 | 14.7% |
| 2022 | 6 | 3.0% |
| 2021 | 3 | 1.5% |
| 2020 | 2 | 1.0% |
| 2019 | 3 | 1.5% |
| 2018 | 4 | 2.0% |
| 2017 | 4 | 2.0% |
| 2016 | 3 | 1.5% |
| 2015 | 2 | 1.0% |
| 2013 | 1 | 0.5% |
| 2012 | 1 | 0.5% |
| 2011 | 1 | 0.5% |
| 2010 | 1 | 0.5% |
| 2009 | 1 | 0.5% |
| 2007 | 1 | 0.5% |
| 2005 | 1 | 0.5% |
| 2002 | 1 | 0.5% |
| 2000 | 1 | 0.5% |
| 1983 | 1 | 0.5% |
| 1982 | 1 | 0.5% |
| 1978 | 1 | 0.5% |
| 1975 | 1 | 0.5% |
The full latest-value file should therefore not be described as a current single-year ranking of 197 economies. The 2024 subset provides the strongest recent same-year basis, while the complete table is an inventory of each economy’s most recent non-empty value.
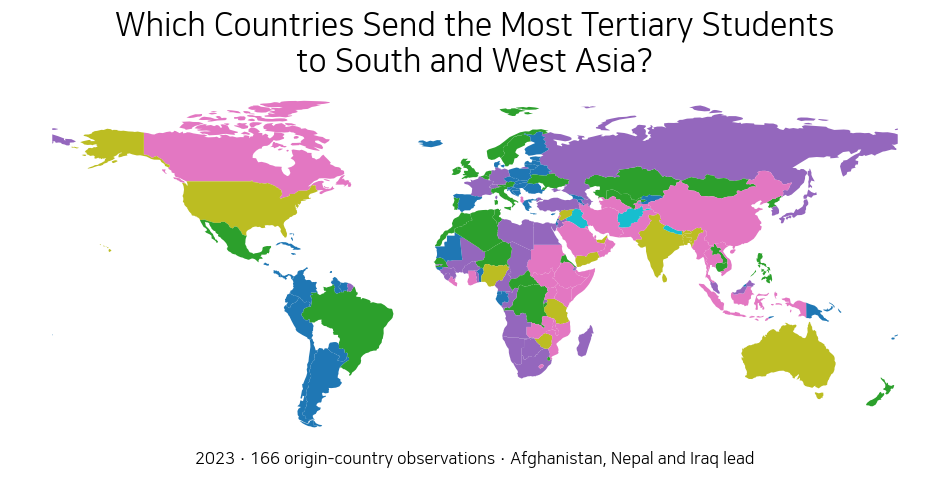
The map draws 166 economies in the low-resolution boundaries
The featured map uses all 197 latest observations, and 166, about 84.3%, match polygons in the low-resolution world boundary file. Small islands and territories without polygons remain in the complete table.
The map is best for broad regional patterns. Exact values for small island economies should be read from the tables because boundary coverage is incomplete.
Complete list of the 197 latest observations
The table below lists the latest non-empty observation for every economy and territory in alphabetical order. The observation year should be read alongside the percentage, especially for older rows.
| Economy/territory | Observation year | Fuel exports / merchandise exports |
|---|---|---|
| Afghanistan | 2019 | 8.05% |
| Albania | 2024 | 3.26% |
| Algeria | 2017 | 96.11% |
| Andorra | 2023 | 0.01% |
| Angola | 2024 | 94.13% |
| Antigua and Barbuda | 2024 | 0.00% |
| Argentina | 2024 | 8.77% |
| Armenia | 2024 | 0.68% |
| Aruba | 2023 | 0.06% |
| Australia | 2025 | 26.89% |
| Austria | 2024 | 2.77% |
| Azerbaijan | 2025 | 85.92% |
| Bahamas, The | 2024 | 0.00% |
| Bahrain | 2024 | 0.00% |
| Bangladesh | 2018 | 1.10% |
| Barbados | 2024 | 8.01% |
| Belarus | 2020 | 12.61% |
| Belgium | 2024 | 11.60% |
| Belize | 2025 | 0.01% |
| Benin | 2024 | 0.00% |
| Bermuda | 2024 | 0.00% |
| Bhutan | 2025 | 0.00% |
| Bolivia | 2024 | 18.94% |
| Bosnia and Herzegovina | 2025 | 6.51% |
| Botswana | 2023 | 0.67% |
| Brazil | 2025 | 16.12% |
| Brunei Darussalam | 2024 | 75.47% |
| Bulgaria | 2024 | 7.76% |
| Burkina Faso | 2024 | 0.02% |
| Burundi | 2023 | 1.89% |
| Cabo Verde | 2023 | 0.00% |
| Cambodia | 2024 | 0.00% |
| Cameroon | 2023 | 54.07% |
| Canada | 2024 | 27.70% |
| Cayman Islands | 2024 | 52.31% |
| Central African Republic | 2024 | 0.03% |
| Chad | 1975 | 7.94% |
| Chile | 2025 | 0.89% |
| China | 2024 | 1.50% |
| Colombia | 2024 | 45.30% |
| Comoros | 2023 | 0.00% |
| Congo, Dem. Rep. | 2023 | 0.00% |
| Congo, Rep. | 2023 | 85.86% |
| Costa Rica | 2024 | 0.02% |
| Cote d’Ivoire | 2024 | 15.12% |
| Croatia | 2024 | 13.09% |
| Cuba | 2021 | 5.74% |
| Cyprus | 2024 | 49.07% |
| Czechia | 2024 | 1.65% |
| Denmark | 2025 | 3.95% |
| Djibouti | 2023 | 1.00% |
| Dominica | 2023 | 0.01% |
| Dominican Republic | 2024 | 0.44% |
| Ecuador | 2024 | 27.48% |
| Egypt, Arab Rep. | 2024 | 12.45% |
| El Salvador | 2024 | 5.00% |
| Equatorial Guinea | 1983 | 1.71% |
| Eritrea | 2002 | 0.00% |
| Estonia | 2024 | 7.77% |
| Eswatini | 2023 | 3.60% |
| Ethiopia | 2023 | 0.03% |
| Faroe Islands | 2009 | 2.80% |
| Fiji | 2024 | 0.04% |
| Finland | 2024 | 7.53% |
| France | 2024 | 4.41% |
| French Polynesia | 2022 | 0.03% |
| Gabon | 2023 | 53.99% |
| Gambia, The | 2024 | 0.00% |
| Georgia | 2024 | 2.34% |
| Germany | 2024 | 2.07% |
| Ghana | 2023 | 24.53% |
| Greece | 2024 | 30.25% |
| Greenland | 2018 | 0.00% |
| Grenada | 2024 | 0.00% |
| Guatemala | 2024 | 2.88% |
| Guinea | 2016 | 0.47% |
| Guinea-Bissau | 2015 | 0.00% |
| Guyana | 2025 | 75.89% |
| Haiti | 2016 | 0.00% |
| Honduras | 2024 | 0.03% |
| Hong Kong SAR, China | 2024 | 0.11% |
| Hungary | 2025 | 4.13% |
| Iceland | 2025 | 1.46% |
| India | 2024 | 17.09% |
| Indonesia | 2025 | 16.01% |
| Iran, Islamic Rep. | 2022 | 56.36% |
| Iraq | 2016 | 99.99% |
| Ireland | 2024 | 0.35% |
| Israel | 2022 | 5.32% |
| Italy | 2024 | 3.05% |
| Jamaica | 2023 | 28.80% |
| Japan | 2025 | 1.19% |
| Jordan | 2024 | 0.26% |
| Kazakhstan | 2024 | 56.72% |
| Kenya | 2024 | 1.63% |
| Kiribati | 2021 | 0.02% |
| Korea, Rep. | 2024 | 7.70% |
| Kuwait | 2024 | 90.73% |
| Kyrgyz Republic | 2025 | 9.40% |
| Lao PDR | 2023 | 1.83% |
| Latvia | 2025 | 8.23% |
| Lebanon | 2024 | 7.71% |
| Lesotho | 2024 | 0.02% |
| Liberia | 2023 | 1.84% |
| Libya | 2019 | 94.41% |
| Lithuania | 2025 | 13.60% |
| Luxembourg | 2024 | 0.12% |
| Macao SAR, China | 2023 | 0.00% |
| Madagascar | 2024 | 2.55% |
| Malawi | 2024 | 0.00% |
| Malaysia | 2025 | 11.16% |
| Maldives | 2024 | 0.10% |
| Mali | 2023 | 1.58% |
| Malta | 2024 | 10.08% |
| Mauritania | 2024 | 0.52% |
| Mauritius | 2024 | 0.00% |
| Mexico | 2025 | 2.99% |
| Moldova | 2024 | 2.38% |
| Mongolia | 2023 | 61.11% |
| Montenegro | 2024 | 25.28% |
| Morocco | 2024 | 0.76% |
| Mozambique | 2024 | 58.90% |
| Myanmar | 2024 | 21.96% |
| Namibia | 2024 | 1.28% |
| Nepal | 2022 | 0.00% |
| Netherlands | 2024 | 12.68% |
| New Caledonia | 2015 | 0.01% |
| New Zealand | 2025 | 0.92% |
| Nicaragua | 2024 | 0.74% |
| Niger | 2024 | 87.99% |
| Nigeria | 2024 | 88.62% |
| North Macedonia | 2024 | 3.46% |
| Norway | 2025 | 62.31% |
| Oman | 2024 | 77.20% |
| Pakistan | 2024 | 1.72% |
| Palau | 2017 | 0.46% |
| Panama | 2024 | 1.01% |
| Papua New Guinea | 2023 | 42.65% |
| Paraguay | 2025 | 11.02% |
| Peru | 2024 | 5.72% |
| Philippines | 2024 | 1.26% |
| Poland | 2024 | 2.58% |
| Portugal | 2025 | 5.08% |
| Qatar | 2024 | 83.76% |
| Romania | 2024 | 4.88% |
| Russian Federation | 2021 | 43.15% |
| Rwanda | 2022 | 0.06% |
| Samoa | 2024 | 33.26% |
| Sao Tome and Principe | 2022 | 0.01% |
| Saudi Arabia | 2024 | 79.40% |
| Senegal | 2024 | 32.71% |
| Serbia | 2007 | 2.62% |
| Seychelles | 2024 | 0.00% |
| Sierra Leone | 2018 | 0.14% |
| Singapore | 2024 | 11.14% |
| Slovak Republic | 2024 | 3.97% |
| Slovenia | 2024 | 4.66% |
| Solomon Islands | 2017 | 0.00% |
| Somalia, Fed. Rep. | 1982 | 1.12% |
| South Africa | 2025 | 8.21% |
| Spain | 2024 | 5.80% |
| Sri Lanka | 2024 | 3.44% |
| St. Kitts and Nevis | 2017 | 0.03% |
| St. Lucia | 2020 | 3.40% |
| St. Vincent and the Grenadines | 2023 | 0.03% |
| Sudan | 2018 | 14.30% |
| Suriname | 2024 | 3.14% |
| Sweden | 2024 | 7.12% |
| Switzerland | 2024 | 1.21% |
| Syrian Arab Republic | 2010 | 49.89% |
| Tajikistan | 2023 | 8.02% |
| Tanzania | 2024 | 2.25% |
| Thailand | 2024 | 3.42% |
| Timor-Leste | 2023 | 67.37% |
| Togo | 2024 | 1.83% |
| Tonga | 2023 | 0.01% |
| Trinidad and Tobago | 2024 | 31.31% |
| Tunisia | 2024 | 6.23% |
| Turkiye | 2024 | 6.16% |
| Turkmenistan | 2000 | 81.01% |
| Turks and Caicos Islands | 2012 | 0.01% |
| Tuvalu | 2005 | 7.16% |
| Uganda | 2024 | 2.32% |
| Ukraine | 2024 | 0.48% |
| United Arab Emirates | 2023 | 68.20% |
| United Kingdom | 2025 | 7.10% |
| United States | 2024 | 18.31% |
| Uruguay | 2024 | 1.31% |
| Uzbekistan | 2024 | 6.53% |
| Vanuatu | 2011 | 0.07% |
| Venezuela, RB | 2013 | 97.68% |
| Viet Nam | 2023 | 0.95% |
| Virgin Islands (U.S.) | 1978 | 91.29% |
| West Bank and Gaza | 2023 | 0.09% |
| Yemen, Rep. | 2019 | 0.15% |
| Zambia | 2024 | 2.72% |
| Zimbabwe | 2024 | 2.91% |
How to interpret the comparison
First, fuels follow SITC Revision 3 section 3. Second, the denominator is merchandise exports rather than total exports including services. Third, a share is not an absolute export value or physical export volume. Fourth, published zeros are real values rather than imputed missing observations.
Fifth, a high share should not be turned directly into a statement about reserves, production, or economic vulnerability. Sixth, the latest 197 observations are mixed-year data, so direct ranking is based on the 104 observations from 2024.
Source and calculation
The source is World Bank World Development Indicators TX.VAL.FUEL.ZS.UN, Fuel exports (% of merchandise exports). The 2024 mean, median, quartiles, threshold counts, and rankings use only the 104 observations dated 2024. The map and complete table use the latest non-empty observation for all 197 economies.
Frequently Asked Questions
Is the fuel-export share measured against all exports?
No. The denominator is merchandise exports, so service exports are not included.
What products count as fuels?
The World Bank uses SITC Revision 3 section 3: mineral fuels, lubricants, and related materials.
What is the 2024 median?
The median across the 104 observations dated 2024 is 3.34%, while the mean is 14.35%.
Related Articles
Green Map creates custom-edited map images using open geographic data sources such as geoBoundaries, Natural Earth, OpenStreetMap, and government open data. These maps are edited visual materials, not raw data files, and are provided for education, documents, presentations, and graphic reference.