Interest payments as a share of government expense measure how much of the World Bank-defined expense total is accounted for by interest on government debt. The latest non-empty GC.XPN.INTP.ZS series contains 156 observations spanning 1980–2024. Only one observation is dated 2024, while 84 are from 2023, so the main cross-country comparison uses the much larger same-year 2023 group.
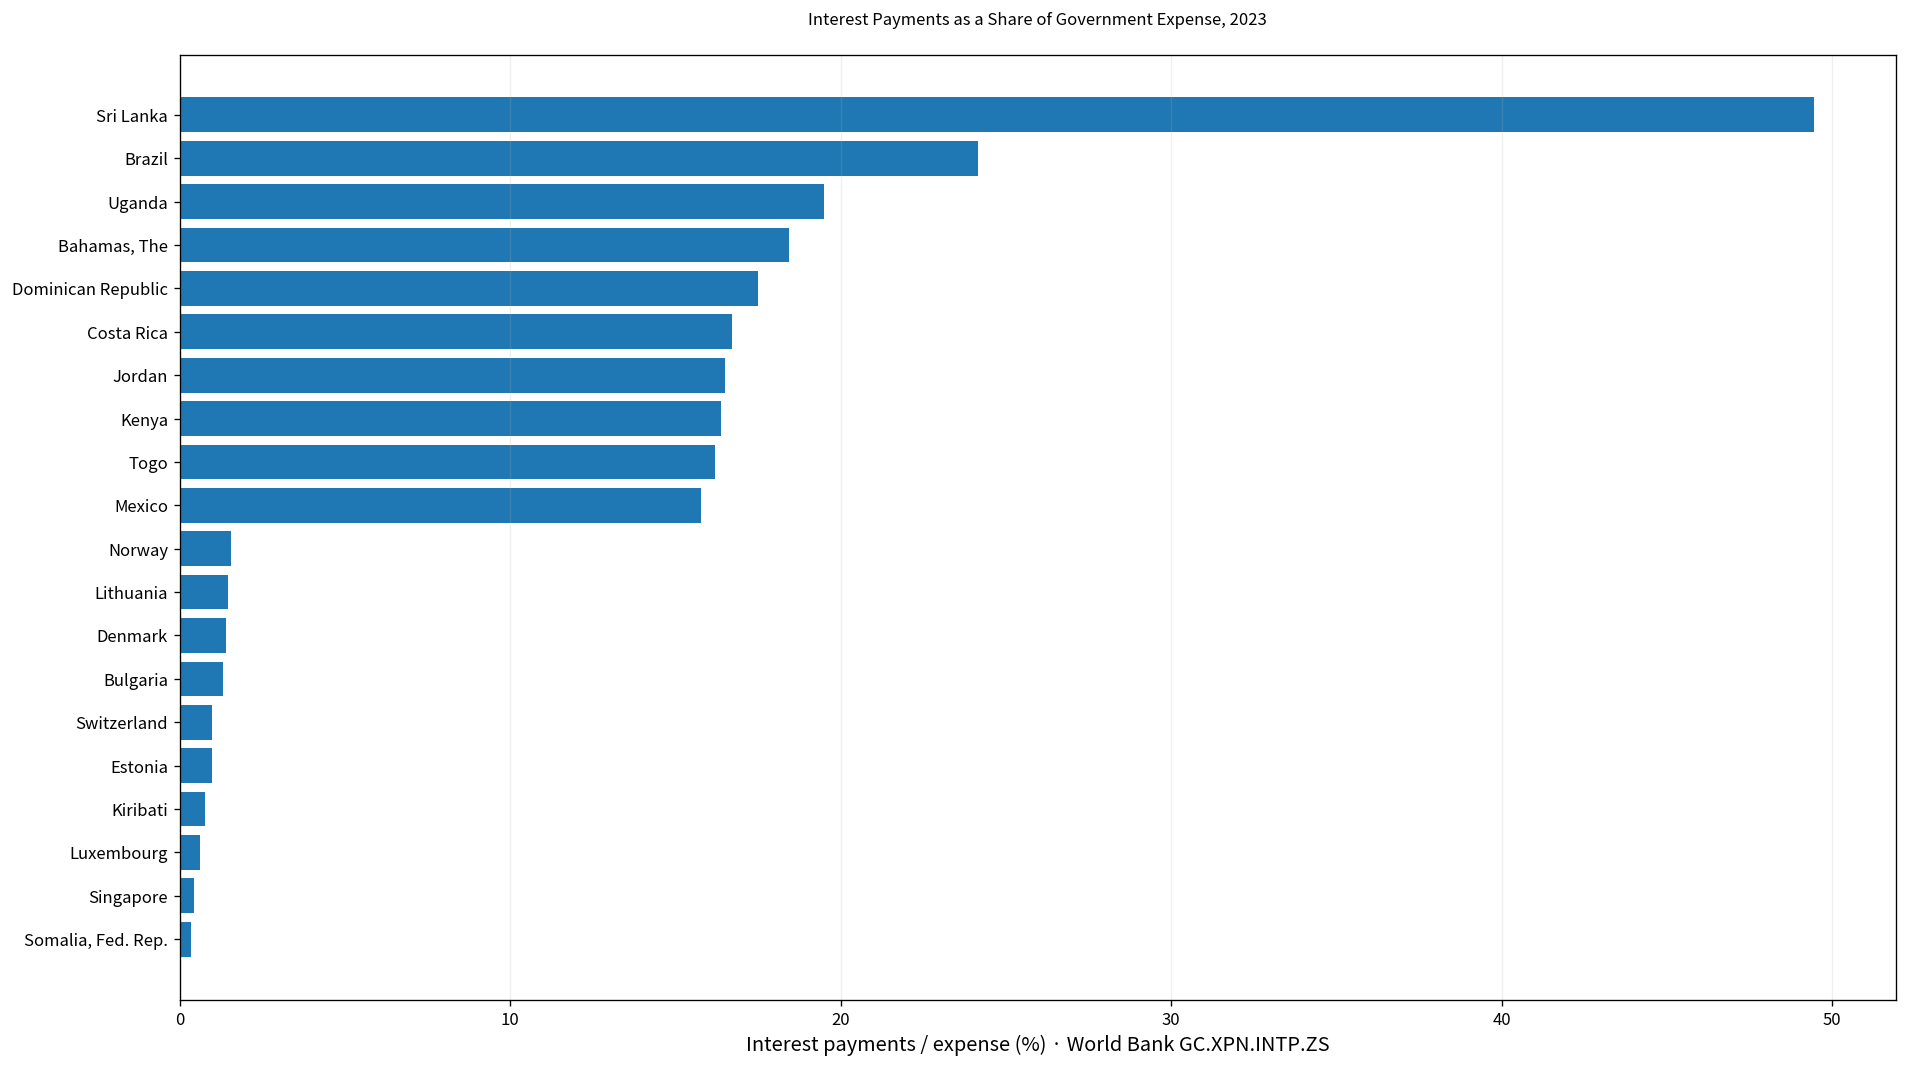
Table of Contents
The denominator is government expense, not GDP or revenue
The World Bank description states that interest payments include interest on government debt, including long-term bonds, long-term loans, and other debt instruments, paid to domestic and foreign residents. The denominator, expense, is defined as a decrease in net worth resulting from a transaction.
This makes the indicator different from interest payments as a percentage of GDP, interest as a percentage of government revenue, or an average interest rate on public debt. A value of 15% means interest payments equal about 15% of the expense denominator used by the indicator; it does not mean 15% of GDP is paid in interest.
The 156 latest observations span more than four decades
Among the 156 latest observations, 1 is dated 2024, 84 are from 2023, and 24 from 2022. There are 14 from 2021 and 11 from 2020, while a number of economies have much older latest values. The oldest latest observation is from 1980.
| Observation year | Economies/territories | Share of 156 |
|---|---|---|
| 2024 | 1 | 0.6% |
| 2023 | 84 | 53.8% |
| 2022 | 24 | 15.4% |
| 2021 | 14 | 9.0% |
| 2020 | 11 | 7.1% |
| 2019 | 4 | 2.6% |
| 2018 | 1 | 0.6% |
| 2017 | 4 | 2.6% |
| 2016 | 2 | 1.3% |
| 2015 | 1 | 0.6% |
| 2012 | 1 | 0.6% |
| 2009 | 2 | 1.3% |
| 2008 | 1 | 0.6% |
| 2007 | 1 | 0.6% |
| 2006 | 1 | 0.6% |
| 1998 | 1 | 0.6% |
| 1992 | 1 | 0.6% |
| 1990 | 1 | 0.6% |
| 1980 | 1 | 0.6% |
The mixed-year latest set has a mean of 8.69% and a median of 6.51%, with a range from 0.008% to 49.44%. Because it mixes fiscal structures from very different periods, these statistics should not be presented as a current global average.
The 2023 mean is 8.15% and the median is 6.35%
The same-year 2023 subset contains 84 economies. Its mean is 8.15% and its median 6.35%. The first quartile is 2.96% and the third quartile 12.78%, placing the middle half roughly between 3.0% and 12.8%.
33 observations are below 5% and 6 are below 1%. At the upper end, 26 are at least 10%, 2 at least 20%, and 1 at least 30%. A few high observations pull the mean above the median.
Sri Lanka is highest in 2023 at 49.44%
Sri Lanka records 49.44%, followed by Brazil at 24.14%, Uganda at 19.48%, Bahamas, The at 18.44%, Dominican Republic at 17.50%, Costa Rica at 16.71%, Jordan at 16.51%, Kenya at 16.38%, Togo at 16.19%, and Mexico at 15.77%.
| 2023 rank | Economy/territory | Interest payments as % of expense |
|---|---|---|
| 1 | Sri Lanka | 49.44% |
| 2 | Brazil | 24.14% |
| 3 | Uganda | 19.48% |
| 4 | Bahamas, The | 18.44% |
| 5 | Dominican Republic | 17.50% |
| 6 | Costa Rica | 16.71% |
| 7 | Jordan | 16.51% |
| 8 | Kenya | 16.38% |
| 9 | Togo | 16.19% |
| 10 | Mexico | 15.77% |
| 11 | Philippines | 15.31% |
| 12 | Malaysia | 14.93% |
| 13 | Guinea-Bissau | 14.93% |
| 14 | Iceland | 14.74% |
| 15 | Fiji | 14.58% |
A high ratio means interest consumes a large share of the expense denominator. It does not by itself identify the size or sustainability of public debt. Debt stock, average interest rates, maturity structure, exchange rates, nominal income, and the size of government expense can all affect the ratio.
Somalia, Fed. Rep. is lowest in 2023 at 0.34%
Somalia, Fed. Rep. records 0.34%, followed by Singapore at 0.44%, Luxembourg at 0.60%, Kiribati at 0.75%, Estonia at 0.96%, and Switzerland at 0.98%. Bulgaria, Denmark, Lithuania, Norway, and the Netherlands are also among the low observations.
| Low-order position in 2023 | Economy/territory | Interest payments as % of expense |
|---|---|---|
| 1 | Somalia, Fed. Rep. | 0.34% |
| 2 | Singapore | 0.44% |
| 3 | Luxembourg | 0.60% |
| 4 | Kiribati | 0.75% |
| 5 | Estonia | 0.96% |
| 6 | Switzerland | 0.98% |
| 7 | Bulgaria | 1.30% |
| 8 | Denmark | 1.39% |
| 9 | Lithuania | 1.45% |
| 10 | Norway | 1.56% |
| 11 | Netherlands | 1.59% |
| 12 | Samoa | 1.66% |
| 13 | Tonga | 1.69% |
| 14 | Latvia | 1.86% |
| 15 | Finland | 2.00% |
A low ratio means interest takes a small share of expense, but it is not equivalent to low public debt. A government can carry substantial debt at low interest rates or long maturities, and the denominator itself can also be large.
Only Tanzania has a 2024 observation
The only 2024 value in the latest-observation file is Tanzania at 12.56%. One economy is far too little to construct a 2024 global ranking or average. That is why the article centers its direct comparison on 2023 and treats Tanzania’s 2024 value only as an individual latest observation.
Programmatic country comparisons can become misleading when the maximum year is mistaken for the common year of every row. Separating latest available observations from same-year comparisons avoids that error.
The 2022 group should also be treated separately
The 2022 subset contains 24 observations, with a mean of 7.64% and a median of 3.59%. Its range is 0.13% to 32.79%. The country composition differs from 2023, so the difference between annual averages is not a global trend.
A time-series assessment would need the same economies observed in both years. The latest-value dataset is designed as a cross-sectional inventory of each economy’s last non-empty observation rather than a balanced panel.
A high interest share cannot be explained by debt stock alone
The ratio can be influenced by the amount of debt outstanding, the average interest rate on that debt, maturity and refinancing conditions, foreign-currency exposure, exchange rates, and the size of government expense. Two economies with similar debt-to-GDP ratios can therefore have very different interest-payment shares.
For the same reason, a high ratio should not automatically be labeled unsustainable, and a low ratio should not be treated as proof of fiscal safety. Debt-to-GDP, average borrowing costs, maturity, currency composition, fiscal balance, and revenue capacity add important context.
How this differs from interest payments as a share of GDP
Interest payments as a share of GDP use the size of the economy as the denominator. This indicator uses government expense. The first measure asks how large interest payments are relative to national output; the second asks how much of the government’s expense structure is absorbed by interest.
Two countries can have the same interest-to-GDP ratio but different interest-to-expense ratios if government expense occupies a different share of GDP. The denominator therefore matters when comparing fiscal burden indicators.
It is also different from interest payments as a share of revenue
An interest-to-revenue ratio compares debt-service interest with government receipts. GC.XPN.INTP.ZS instead compares interest with expense. A country with weak revenue can have a high interest-to-revenue ratio while its interest-to-expense ratio is lower, or vice versa.
A broader view of fiscal space needs revenue, expense, fiscal balance, debt stock, and interest payments together. No single interest ratio captures the whole budget position.
Complete list of the 156 latest observations
The table below lists the latest non-empty observation for each economy and territory in alphabetical order. Rows not dated 2023 retain their original observation year. For a strict same-year comparison, use only the 84 observations from 2023.
| Economy/territory | Observation year | Interest payments (% of expense) |
|---|---|---|
| Afghanistan | 2017 | 0.13% |
| Albania | 2023 | 7.84% |
| Angola | 2019 | 31.91% |
| Argentina | 2023 | 7.29% |
| Armenia | 2023 | 12.74% |
| Australia | 2022 | 2.97% |
| Austria | 2023 | 2.55% |
| Azerbaijan | 2022 | 2.05% |
| Bahamas, The | 2023 | 18.44% |
| Bahrain | 2020 | 18.91% |
| Bangladesh | 2021 | 24.03% |
| Barbados | 2016 | 22.53% |
| Belarus | 2023 | 5.39% |
| Belgium | 2022 | 3.20% |
| Belize | 2017 | 10.34% |
| Bhutan | 2020 | 1.90% |
| Bolivia | 2007 | 9.54% |
| Bosnia and Herzegovina | 2023 | 2.11% |
| Botswana | 2023 | 4.04% |
| Brazil | 2023 | 24.14% |
| Bulgaria | 2023 | 1.30% |
| Burkina Faso | 2023 | 11.93% |
| Burundi | 2021 | 3.33% |
| Cabo Verde | 2020 | 8.76% |
| Cambodia | 2023 | 2.10% |
| Cameroon | 2021 | 7.79% |
| Canada | 2023 | 7.62% |
| Central African Republic | 2021 | 5.17% |
| Chile | 2023 | 4.32% |
| Colombia | 2023 | 13.18% |
| Congo, Dem. Rep. | 2022 | 0.68% |
| Congo, Rep. | 2021 | 11.51% |
| Costa Rica | 2023 | 16.71% |
| Cote d’Ivoire | 2023 | 14.14% |
| Croatia | 2023 | 4.18% |
| Cyprus | 2023 | 3.05% |
| Czechia | 2022 | 3.15% |
| Denmark | 2023 | 1.39% |
| Dominican Republic | 2023 | 17.50% |
| Ecuador | 2022 | 4.74% |
| Egypt, Arab Rep. | 2015 | 24.23% |
| El Salvador | 2023 | 14.10% |
| Equatorial Guinea | 2022 | 9.94% |
| Estonia | 2023 | 0.96% |
| Eswatini | 2021 | 7.62% |
| Ethiopia | 2023 | 9.03% |
| Fiji | 2023 | 14.58% |
| Finland | 2023 | 2.00% |
| France | 2023 | 3.40% |
| Gabon | 2021 | 20.36% |
| Gambia, The | 1990 | 21.39% |
| Georgia | 2023 | 5.86% |
| Germany | 2022 | 1.36% |
| Ghana | 2022 | 32.79% |
| Greece | 2023 | 7.27% |
| Guatemala | 2023 | 11.96% |
| Guinea | 1992 | 12.56% |
| Guinea-Bissau | 2023 | 14.93% |
| Honduras | 2020 | 9.95% |
| Hungary | 2022 | 6.64% |
| Iceland | 2023 | 14.74% |
| India | 2022 | 23.23% |
| Indonesia | 2009 | 10.89% |
| Iran, Islamic Rep. | 2009 | 0.73% |
| Iraq | 2019 | 0.01% |
| Ireland | 2022 | 3.30% |
| Israel | 2023 | 7.65% |
| Italy | 2023 | 7.65% |
| Jamaica | 2020 | 21.99% |
| Jordan | 2023 | 16.51% |
| Kazakhstan | 2023 | 8.68% |
| Kenya | 2023 | 16.38% |
| Kiribati | 2023 | 0.75% |
| Korea, Rep. | 2023 | 4.43% |
| Kuwait | 2006 | 0.13% |
| Kyrgyz Republic | 2023 | 3.16% |
| Lao PDR | 2022 | 16.99% |
| Latvia | 2023 | 1.86% |
| Lebanon | 2021 | 15.23% |
| Lesotho | 2022 | 3.99% |
| Lithuania | 2023 | 1.45% |
| Luxembourg | 2023 | 0.60% |
| Macao SAR, China | 1998 | 0.01% |
| Madagascar | 2023 | 6.32% |
| Malawi | 2022 | 26.35% |
| Malaysia | 2023 | 14.93% |
| Maldives | 2021 | 8.84% |
| Mali | 2020 | 8.48% |
| Malta | 2023 | 3.09% |
| Marshall Islands | 2020 | 0.46% |
| Mauritius | 2023 | 8.41% |
| Mexico | 2023 | 15.77% |
| Micronesia, Fed. Sts. | 2020 | 0.60% |
| Moldova | 2023 | 5.07% |
| Mongolia | 2021 | 6.01% |
| Morocco | 2023 | 7.93% |
| Mozambique | 2022 | 11.30% |
| Myanmar | 2019 | 10.23% |
| Namibia | 2023 | 14.14% |
| Nepal | 2021 | 4.11% |
| Netherlands | 2023 | 1.59% |
| New Zealand | 2022 | 2.97% |
| Nicaragua | 2023 | 9.21% |
| Niger | 1980 | 10.40% |
| North Macedonia | 2023 | 4.29% |
| Norway | 2023 | 1.56% |
| Palau | 2020 | 0.50% |
| Panama | 2021 | 13.36% |
| Papua New Guinea | 2023 | 12.28% |
| Paraguay | 2023 | 8.76% |
| Peru | 2021 | 6.09% |
| Philippines | 2023 | 15.31% |
| Poland | 2023 | 4.79% |
| Portugal | 2023 | 5.73% |
| Romania | 2022 | 3.87% |
| Russian Federation | 2020 | 2.35% |
| Rwanda | 2023 | 9.85% |
| Samoa | 2023 | 1.66% |
| San Marino | 2023 | 5.88% |
| Saudi Arabia | 2023 | 3.41% |
| Senegal | 2023 | 13.20% |
| Serbia | 2022 | 4.00% |
| Seychelles | 2008 | 19.68% |
| Singapore | 2023 | 0.44% |
| Slovak Republic | 2022 | 2.66% |
| Slovenia | 2023 | 2.79% |
| Solomon Islands | 2022 | 1.27% |
| Somalia, Fed. Rep. | 2023 | 0.34% |
| South Africa | 2022 | 14.29% |
| Spain | 2023 | 5.91% |
| Sri Lanka | 2023 | 49.44% |
| St. Kitts and Nevis | 2020 | 2.94% |
| St. Lucia | 2017 | 16.07% |
| St. Vincent and the Grenadines | 2017 | 8.83% |
| Sudan | 2016 | 4.77% |
| Sweden | 2022 | 1.37% |
| Switzerland | 2023 | 0.98% |
| Tajikistan | 2023 | 6.39% |
| Tanzania | 2024 | 12.56% |
| Thailand | 2023 | 5.49% |
| Timor-Leste | 2022 | 0.13% |
| Togo | 2023 | 16.19% |
| Tonga | 2023 | 1.69% |
| Trinidad and Tobago | 2019 | 9.58% |
| Tunisia | 2012 | 5.10% |
| Turkiye | 2023 | 11.04% |
| Uganda | 2023 | 19.48% |
| Ukraine | 2023 | 5.80% |
| United Arab Emirates | 2023 | 2.27% |
| United Kingdom | 2023 | 7.77% |
| United States | 2023 | 12.90% |
| Uruguay | 2023 | 6.37% |
| Uzbekistan | 2023 | 2.95% |
| Vanuatu | 2023 | 2.96% |
| Zambia | 2021 | 26.53% |
| Zimbabwe | 2018 | 9.96% |
How to interpret the comparison
First, the 156 latest observations do not share one year. Second, the denominator is the World Bank-defined expense measure rather than GDP or revenue. Third, a high ratio shows a large interest share of expense but does not directly measure debt stock. Fourth, differences in fiscal accounting coverage and data-update timing also matter.
For a country-level fiscal assessment, this indicator is best combined with debt-to-GDP, average interest rates, maturity structure, revenue, fiscal balance, and broader expenditure data. Very old latest observations should not be treated as current conditions without checking newer national sources.
Source and calculation
The source is World Bank World Development Indicators GC.XPN.INTP.ZS, Interest payments (% of expense). The 2023 mean, median, quartiles, threshold counts, and rankings are calculated from the 84 observations dated 2023. The full table preserves all 156 latest non-empty observations.
Frequently Asked Questions
Is the denominator GDP?
No. This indicator compares government interest payments with the World Bank-defined expense measure, not GDP or revenue.
What is the 2023 median?
The median across the 84 observations dated 2023 is 6.35%, while the mean is 8.15%.
Why does the comparison focus on 2023 rather than 2024?
Only Tanzania has a 2024 observation, while 84 economies have 2023 values, providing a much larger same-year comparison.
Related Articles
Green Map creates custom-edited map images using open geographic data sources such as geoBoundaries, Natural Earth, OpenStreetMap, and government open data. These maps are edited visual materials, not raw data files, and are provided for education, documents, presentations, and graphic reference.