The bound tariff rate, simple mean, all products is the unweighted average of tariff-line ceilings committed through trade negotiations. The World Bank TM.TAX.MRCH.BR.ZS series contains 160 latest non-empty observations, including 37 from 2022 and 105 from 2021. Because the complete set spans 2014–2022, the same-year 2022 group is used for the main comparison rather than treating all latest values as one current global ranking.
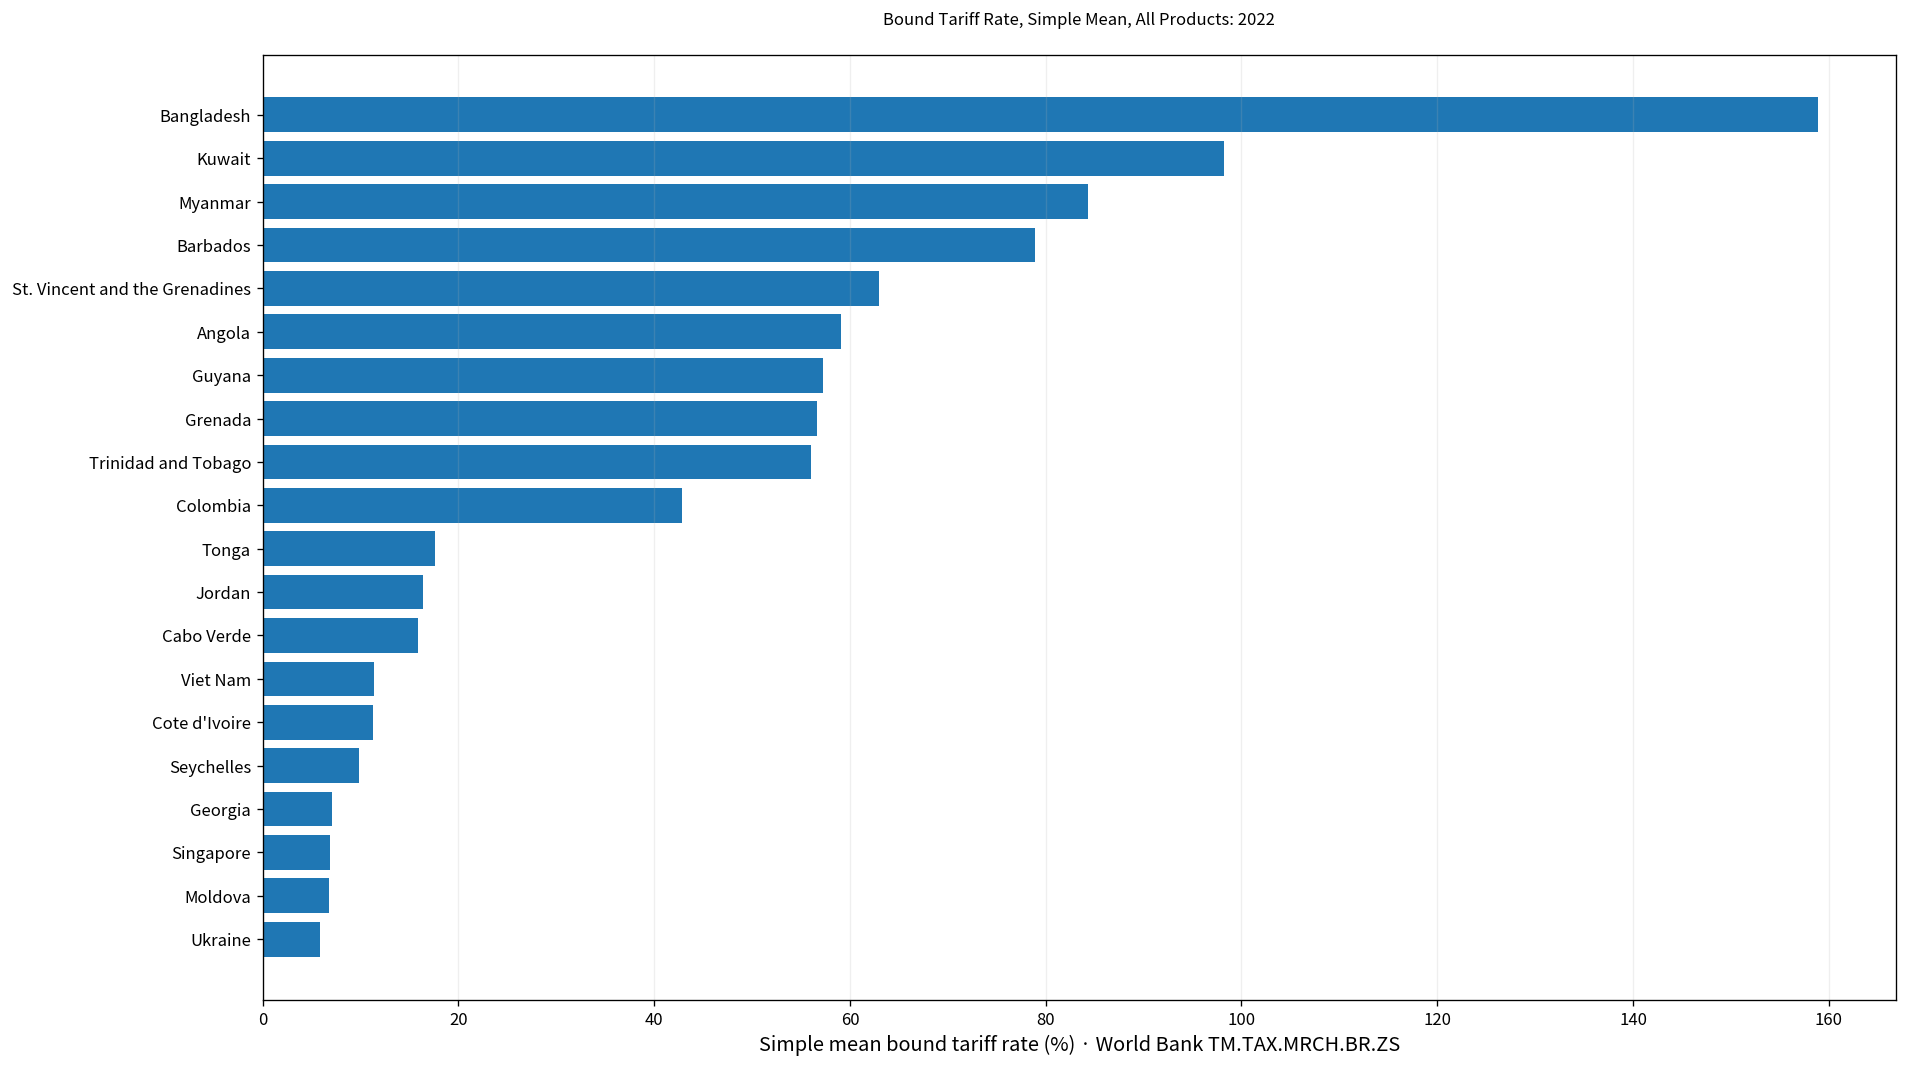
Table of Contents
A bound tariff rate is not the same as an applied tariff
World Bank documentation describes the simple mean bound rate as the unweighted average of all tariff lines for which bound rates have been set. Bound rates result from trade negotiations and are incorporated into a country’s schedule of concessions. They are enforceable ceilings, not necessarily the rates charged on imports today.
If an economy has a bound simple mean of 40%, that does not mean importers actually pay an average tariff of 40%. Applied MFN or preferential rates can be much lower. The bound rate is better understood as a negotiated upper limit on how high tariffs may be raised without breaching the binding.
Simple mean means every tariff line receives equal weight
The indicator is an unweighted mean. A tariff line covering a heavily imported product receives the same weight as a line with little or no import value. That is why the result can differ sharply from an import-weighted tariff average.
For the cost of tariffs on the actual import basket, applied weighted averages are more relevant. For the structure of tariff commitments and the amount of policy space embedded in the tariff schedule, bound rates are the more direct measure.
The 160 latest observations span 2014 to 2022
Of the 160 latest observations, 37 are from 2022 and 105 from 2021. There are 7 from 2020 and 4 from 2019, with smaller groups from earlier years. The oldest latest observation is from 2014.
| Observation year | Economies/territories | Share of 160 |
|---|---|---|
| 2022 | 37 | 23.1% |
| 2021 | 105 | 65.6% |
| 2020 | 7 | 4.4% |
| 2019 | 4 | 2.5% |
| 2018 | 1 | 0.6% |
| 2017 | 2 | 1.2% |
| 2016 | 2 | 1.2% |
| 2015 | 1 | 0.6% |
| 2014 | 1 | 0.6% |
The mixed-year collection has a mean of 32.75% and a median of 23.08%, ranging from 0.00% to 158.91%. Because those observations refer to different years, these statistics should not be presented as a current global bound-tariff average.
The 2022 mean is 36.05% and the median is 25.84%
The 2022 subset contains 37 economies. Its mean is 36.05% and median 25.84%. The first quartile is 17.64% and the third quartile 42.84%, placing the middle half roughly between 17.6% and 42.8%.
5 observations are below 10%, 25 are at least 20%, and 9 are at least 50%. 1 observation exceeds 100%. Values above 100% are possible because the indicator averages negotiated tariff ceilings, not necessarily actual applied rates.
Bangladesh is highest in 2022 at 158.91%
Bangladesh records 158.91%, followed by Kuwait at 98.23%, Myanmar at 84.34%, Barbados at 78.93%, St. Vincent and the Grenadines at 62.95%, Angola at 59.07%, Guyana at 57.23%, Grenada at 56.64%, and Trinidad and Tobago at 55.97%.
| 2022 rank | Economy/territory | Bound tariff, simple mean |
|---|---|---|
| 1 | Bangladesh | 158.91% |
| 2 | Kuwait | 98.23% |
| 3 | Myanmar | 84.34% |
| 4 | Barbados | 78.93% |
| 5 | St. Vincent and the Grenadines | 62.95% |
| 6 | Angola | 59.07% |
| 7 | Guyana | 57.23% |
| 8 | Grenada | 56.64% |
| 9 | Trinidad and Tobago | 55.97% |
| 10 | Colombia | 42.84% |
| 11 | Bolivia | 39.98% |
| 12 | Venezuela, RB | 36.72% |
| 13 | Mexico | 34.99% |
| 14 | Paraguay | 33.46% |
| 15 | Argentina | 31.78% |
A high value means the average ceiling across bound tariff lines is high. It does not show the tariff burden actually paid by importers. The gap between bound and applied rates can indicate available tariff policy space, but it should not be treated as evidence that a government intends to raise tariffs to the ceiling.
Ukraine is lowest in 2022 at 5.85%
Ukraine records 5.85%, followed by Moldova at 6.79%, Singapore at 6.89%, Georgia at 7.13%, and Seychelles at 9.88%. Cote d’Ivoire is at 11.23%, Viet Nam 11.38%, Cabo Verde 15.91%, Jordan 16.35%, and Tonga 17.64%.
| Low-order position in 2022 | Economy/territory | Bound tariff, simple mean |
|---|---|---|
| 1 | Ukraine | 5.85% |
| 2 | Moldova | 6.79% |
| 3 | Singapore | 6.89% |
| 4 | Georgia | 7.13% |
| 5 | Seychelles | 9.88% |
| 6 | Cote d’Ivoire | 11.23% |
| 7 | Viet Nam | 11.38% |
| 8 | Cabo Verde | 15.91% |
| 9 | Jordan | 16.35% |
| 10 | Tonga | 17.64% |
| 11 | Suriname | 18.16% |
| 12 | Lao PDR | 18.96% |
| 13 | Mauritania | 20.84% |
| 14 | Cuba | 21.77% |
| 15 | Ecuador | 21.85% |
A low bound average means the negotiated tariff ceiling is relatively low across the covered tariff lines. It still does not describe all trade costs. Nontariff measures, preferential agreements, taxes, customs procedures, and product-specific rules can matter separately.
The 2021 group is much larger but should not be merged into 2022
The 2021 subset contains 105 observations, with a mean of 29.87% and a median of 19.17%. Its range is 0.00% to 121.32%. The annual groups contain different economies, so their averages do not form a valid global time trend.
Many European Union members show the same 4.39% value in 2021. Switzerland, Hong Kong SAR, China, and Macao SAR, China are at 0%, while Nigeria reaches 121.32%, Tanzania 120.00%, and Zambia 107.61%. This wide spread is consistent with very different bound-tariff schedules.
Why can a bound tariff average exceed 100%?
A bound rate is a ceiling. Sensitive agricultural products and other tariff lines can have very high negotiated ceilings. When those lines are included in an unweighted average, the overall simple mean can exceed 100%.
A value such as 158.91% therefore should not be paraphrased as importers paying taxes greater than the value of goods on average. It describes the structure of tariff commitments. Applied tariffs and actual import weights are needed for a transaction-cost interpretation.
Bound and MFN tariff rates reveal different parts of tariff policy
The applied MFN tariff is closer to the baseline rate charged to trading partners receiving most-favored-nation treatment. The bound rate is the ceiling above which the tariff generally cannot be raised without violating the binding. The difference between the two is often called binding overhang or tariff water.
A large gap can indicate more room to raise an applied tariff while remaining below the bound ceiling, but it does not predict that the tariff will be increased. Domestic law, trade agreements, preferential rates, supply chains, and policy objectives all influence actual tariff decisions.
Binding coverage and the level of bound tariffs are separate measures
Tariff binding coverage asks what share of tariff lines are actually bound. The simple mean bound rate asks how high the ceilings are on the bound lines. An economy can have broad binding coverage and still have high average ceilings, or limited coverage with relatively low bound rates on the lines that are bound.
For a fuller view of trade-policy commitments, binding coverage can be read together with the bound-rate level. Applied MFN rates and import-weighted applied rates then show how those commitments compare with rates used in practice.
Complete list of the 160 latest observations
The table below lists the latest non-empty observation for each economy and territory in alphabetical order. Rows not dated 2022 retain their original observation year. For a strict same-year comparison, use only the 2022 observations.
| Economy/territory | Observation year | Bound tariff, simple mean |
|---|---|---|
| Afghanistan | 2018 | 13.56% |
| Albania | 2021 | 6.82% |
| Angola | 2022 | 59.07% |
| Antigua and Barbuda | 2021 | 58.75% |
| Argentina | 2022 | 31.78% |
| Armenia | 2021 | 8.70% |
| Australia | 2021 | 9.56% |
| Austria | 2021 | 4.39% |
| Bahrain | 2021 | 34.71% |
| Bangladesh | 2022 | 158.91% |
| Barbados | 2022 | 78.93% |
| Belgium | 2021 | 4.39% |
| Belize | 2021 | 59.31% |
| Benin | 2021 | 29.53% |
| Bolivia | 2022 | 39.98% |
| Botswana | 2021 | 18.98% |
| Brazil | 2022 | 31.47% |
| Brunei Darussalam | 2022 | 24.28% |
| Bulgaria | 2021 | 4.39% |
| Burkina Faso | 2021 | 44.31% |
| Burundi | 2021 | 69.40% |
| Cabo Verde | 2022 | 15.91% |
| Cambodia | 2021 | 19.42% |
| Cameroon | 2019 | 79.88% |
| Canada | 2021 | 4.93% |
| Central African Republic | 2017 | 35.89% |
| Chad | 2016 | 79.92% |
| Chile | 2022 | 25.15% |
| China | 2021 | 10.01% |
| Colombia | 2022 | 42.84% |
| Congo, Dem. Rep. | 2020 | 96.10% |
| Congo, Rep. | 2015 | 27.45% |
| Costa Rica | 2021 | 43.05% |
| Cote d’Ivoire | 2022 | 11.23% |
| Croatia | 2021 | 4.39% |
| Cuba | 2022 | 21.77% |
| Cyprus | 2021 | 4.39% |
| Czechia | 2021 | 4.39% |
| Denmark | 2021 | 4.39% |
| Djibouti | 2014 | 41.28% |
| Dominica | 2020 | 59.77% |
| Dominican Republic | 2021 | 34.55% |
| Ecuador | 2022 | 21.85% |
| Egypt, Arab Rep. | 2019 | 36.59% |
| El Salvador | 2021 | 36.94% |
| Estonia | 2021 | 4.39% |
| Eswatini | 2021 | 19.17% |
| Fiji | 2021 | 40.12% |
| Finland | 2021 | 4.39% |
| France | 2021 | 4.39% |
| Gabon | 2019 | 22.82% |
| Gambia, The | 2021 | 103.47% |
| Georgia | 2022 | 7.13% |
| Germany | 2021 | 4.39% |
| Ghana | 2021 | 92.78% |
| Greece | 2021 | 4.39% |
| Grenada | 2022 | 56.64% |
| Guatemala | 2021 | 41.68% |
| Guinea | 2021 | 20.90% |
| Guinea-Bissau | 2021 | 48.52% |
| Guyana | 2022 | 57.23% |
| Haiti | 2020 | 17.75% |
| Honduras | 2021 | 32.12% |
| Hong Kong SAR, China | 2021 | 0.00% |
| Hungary | 2021 | 4.39% |
| Iceland | 2021 | 13.84% |
| India | 2021 | 51.96% |
| Indonesia | 2021 | 37.33% |
| Ireland | 2021 | 4.39% |
| Israel | 2022 | 23.19% |
| Italy | 2021 | 4.39% |
| Jamaica | 2021 | 50.58% |
| Japan | 2021 | 3.08% |
| Jordan | 2022 | 16.35% |
| Kazakhstan | 2021 | 5.96% |
| Kenya | 2021 | 94.66% |
| Korea, Rep. | 2021 | 16.55% |
| Kuwait | 2022 | 98.23% |
| Kyrgyz Republic | 2021 | 7.56% |
| Lao PDR | 2022 | 18.96% |
| Latvia | 2021 | 4.39% |
| Lesotho | 2021 | 80.19% |
| Liberia | 2021 | 26.66% |
| Lithuania | 2021 | 4.39% |
| Macao SAR, China | 2021 | 0.00% |
| Madagascar | 2021 | 27.49% |
| Malawi | 2021 | 75.76% |
| Malaysia | 2021 | 14.52% |
| Maldives | 2021 | 36.57% |
| Mali | 2021 | 29.65% |
| Malta | 2021 | 4.39% |
| Mauritania | 2022 | 20.84% |
| Mauritius | 2021 | 85.92% |
| Mexico | 2022 | 34.99% |
| Moldova | 2022 | 6.79% |
| Mongolia | 2021 | 17.58% |
| Montenegro | 2021 | 5.28% |
| Morocco | 2021 | 41.33% |
| Mozambique | 2021 | 97.68% |
| Myanmar | 2022 | 84.34% |
| Namibia | 2021 | 19.35% |
| Nepal | 2021 | 26.33% |
| Netherlands | 2021 | 4.39% |
| New Zealand | 2021 | 9.41% |
| Nicaragua | 2021 | 41.15% |
| Niger | 2021 | 45.23% |
| Nigeria | 2021 | 121.32% |
| North Macedonia | 2021 | 6.88% |
| Norway | 2021 | 2.83% |
| Oman | 2021 | 14.07% |
| Pakistan | 2021 | 60.85% |
| Panama | 2021 | 22.96% |
| Papua New Guinea | 2021 | 32.46% |
| Paraguay | 2022 | 33.46% |
| Peru | 2022 | 29.51% |
| Philippines | 2022 | 25.84% |
| Poland | 2021 | 4.39% |
| Portugal | 2021 | 4.39% |
| Qatar | 2021 | 15.78% |
| Romania | 2021 | 4.39% |
| Russian Federation | 2021 | 7.36% |
| Rwanda | 2021 | 89.19% |
| Samoa | 2020 | 21.33% |
| Saudi Arabia | 2020 | 10.66% |
| Senegal | 2021 | 29.97% |
| Seychelles | 2022 | 9.88% |
| Sierra Leone | 2021 | 47.33% |
| Singapore | 2022 | 6.89% |
| Slovak Republic | 2021 | 4.39% |
| Slovenia | 2021 | 4.39% |
| Solomon Islands | 2021 | 79.08% |
| South Africa | 2021 | 19.35% |
| Spain | 2021 | 4.39% |
| Sri Lanka | 2021 | 31.71% |
| St. Kitts and Nevis | 2020 | 76.51% |
| St. Lucia | 2020 | 64.55% |
| St. Vincent and the Grenadines | 2022 | 62.95% |
| Suriname | 2022 | 18.16% |
| Sweden | 2021 | 4.39% |
| Switzerland | 2021 | 0.00% |
| Tajikistan | 2021 | 7.89% |
| Tanzania | 2021 | 120.00% |
| Thailand | 2021 | 25.39% |
| Togo | 2021 | 80.00% |
| Tonga | 2022 | 17.64% |
| Trinidad and Tobago | 2022 | 55.97% |
| Tunisia | 2016 | 58.91% |
| Turkiye | 2021 | 30.14% |
| Uganda | 2021 | 73.18% |
| Ukraine | 2022 | 5.85% |
| United Arab Emirates | 2021 | 14.66% |
| United Kingdom | 2019 | 4.39% |
| United States | 2021 | 3.62% |
| Uruguay | 2022 | 31.67% |
| Vanuatu | 2021 | 40.10% |
| Venezuela, RB | 2022 | 36.72% |
| Viet Nam | 2022 | 11.38% |
| Yemen, Rep. | 2017 | 21.57% |
| Zambia | 2021 | 107.61% |
| Zimbabwe | 2021 | 89.63% |
How to interpret the comparison
First, the 160 latest observations do not share one year. Second, bound rates are negotiated ceilings rather than current applied tariffs. Third, the simple mean does not weight tariff lines by import value. Fourth, values above 100% can be valid in this type of tariff schedule and should not automatically be treated as data errors.
Actual trade-cost analysis should combine bound rates with applied MFN tariffs, preferential rates, import-weighted averages, product-level schedules, and nontariff measures. The bound simple mean is useful for understanding commitments, not for summarizing every cost faced by importers.
Source and calculation
The source is World Bank World Development Indicators TM.TAX.MRCH.BR.ZS, Bound rate, simple mean, all products (%). The 2022 mean, median, quartiles, threshold counts, and rankings are calculated from the 37 observations dated 2022.
Frequently Asked Questions
Is the simple mean bound tariff the same as the applied tariff rate?
No. A bound rate is a negotiated ceiling; applied MFN or preferential rates can be lower.
What is the 2022 median?
The median across the 37 observations dated 2022 is 25.84%, while the mean is 36.05%.
Can a bound tariff average exceed 100%?
Yes. Very high ceilings on some tariff lines can push an unweighted average above 100%.
Related Articles
Green Map creates custom-edited map images using open geographic data sources such as geoBoundaries, Natural Earth, OpenStreetMap, and government open data. These maps are edited visual materials, not raw data files, and are provided for education, documents, presentations, and graphic reference.