World Bank data for 2024 provide a primary-completion observation for 111 countries and separately reported economies. Another 106 entries in the 217-economy comparison frame have no value for that year. Among the reported observations, the median is 95.15% and the unweighted mean is 92.20%. Monaco records 135.00%, the Turks and Caicos Islands 132.42%, and Fiji 116.31%, while Niger is at 40.76%, the British Virgin Islands at 46.42%, and Burkina Faso at 51.99%. Those values immediately show why the indicator cannot be treated as a simple share of a fixed cohort that must stay between zero and 100.
The World Bank indicator SE.PRM.CMPT.ZS is a gross intake ratio to the last grade of primary education. Its numerator is the number of new entrants to the final primary grade, with repeaters removed, regardless of the entrants’ actual age. The denominator is the population at the theoretical entrance age for that grade. The source documentation also notes that available data do not permit a full adjustment for students who leave during the final year. The measure is therefore best read as a flow into the end of primary schooling, not as an exact probability that a child from one birth cohort graduates.
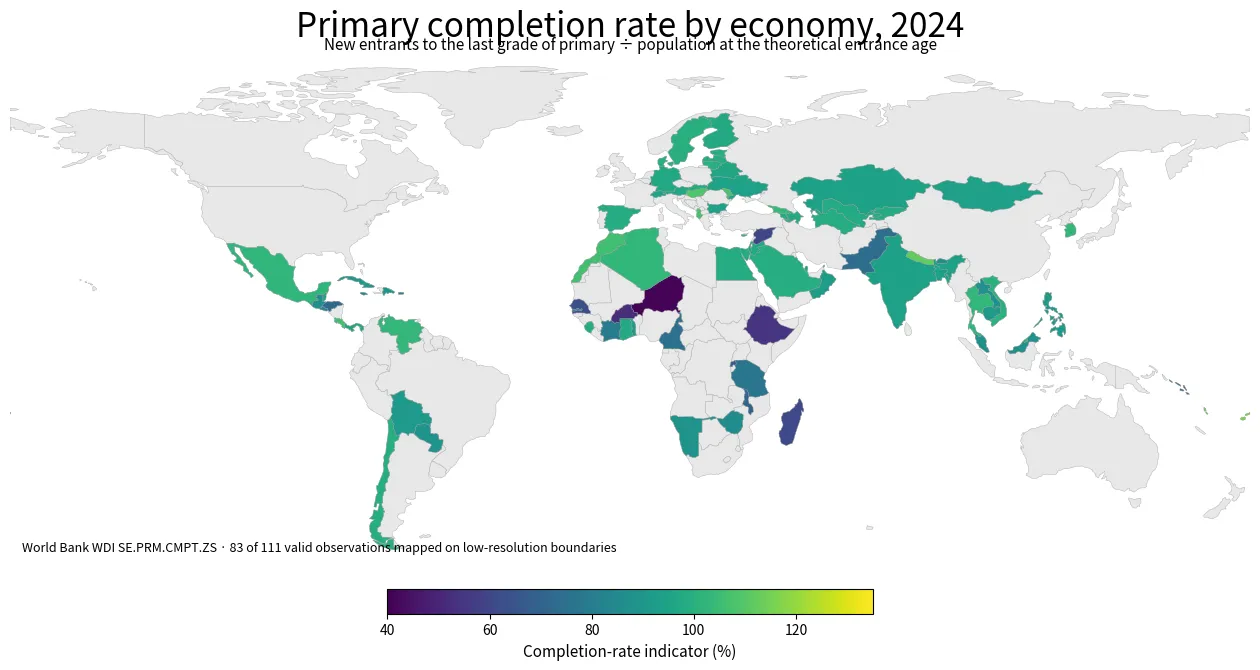
Table of Contents
Why a gross primary-completion value can exceed 100%
Twenty-four of the 111 reported observations are above 100%. That is possible because the numerator and denominator do not describe exactly the same age group. A student who reaches the last grade later or earlier than the theoretical age still counts as a new entrant, while the denominator contains only the population at the theoretical entrance age. When out-of-age entry, repetition histories, re-entry, migration, or small population denominators affect the flow, the numerator can exceed the age-specific population used in the denominator.
The largest examples are Monaco at 135.00%, the Turks and Caicos Islands at 132.42%, Fiji at 116.31%, Vanuatu at 113.38%, and Nepal at 112.23%. A value of 135% does not mean that 135% of children “graduated.” It means the recorded flow of new entrants into the final primary grade was equivalent to 135% of the population at the theoretical entrance age. Capping such observations at 100 would change the official measurement rather than correct it.
| Country or economy | Primary completion-rate indicator |
|---|---|
| Monaco | 135.00% |
| Turks and Caicos Islands | 132.42% |
| Fiji | 116.31% |
| Vanuatu | 113.38% |
| Nepal | 112.23% |
| St. Vincent and the Grenadines | 108.97% |
| Hungary | 108.88% |
| Tonga | 108.08% |
| Moldova | 108.06% |
| Albania | 107.35% |
The median is 95.15%, but the distribution has long tails
The 25th percentile is 86.90% and the 75th percentile is 99.54%, so the middle half of reported economies lies within a comparatively narrow band near the upper end of the scale. Fifty-six observations are at least 95%, and 78 are at least 90%. At the other end, only four observations fall below 60%, but those low values pull the mean below the median. The 24 observations above 100% pull in the opposite direction. Looking at the median and the interquartile range therefore gives a clearer picture than relying on the mean alone.
A simple grouping makes the shape easier to see: four economies are below 60%, 14 are from 60% to under 80%, 15 are from 80% to under 90%, 22 are from 90% to under 95%, 32 are from 95% through 100%, and 24 are above 100%. These are counts of reporting economies, not population-weighted global shares. A large country and a small island economy each contribute one observation, so the 92.20% mean should not be described as the percentage of all primary-age children worldwide who complete primary school.
The lowest reported values are concentrated in several Sub-Saharan African economies
Niger records 40.76%, Burkina Faso 51.99%, Ethiopia 54.44%, Madagascar 60.71%, Senegal 62.86%, Rwanda 66.82%, and Malawi 70.14%. These values indicate a smaller flow into the final primary grade relative to the theoretical entrance-age population in 2024. They do not, by themselves, reveal how many children were out of school, which grades had the greatest dropout, or why students failed to reach the end of primary education. Those questions require additional enrollment, progression, household, conflict, and education-system evidence.
The same continent also contains much higher observations. Ghana is at 97.50%, Egypt at 98.21%, Algeria at 102.42%, and Morocco at 106.37%, while Côte d’Ivoire is at 80.24% and Tanzania at 77.33%. The contrast within Africa is large enough that a continental average would hide meaningful country-level differences. The map is useful precisely because it makes those neighboring and regional contrasts visible without implying that geography alone explains them.
| Country or economy | Primary completion-rate indicator |
|---|---|
| Niger | 40.76% |
| British Virgin Islands | 46.42% |
| Burkina Faso | 51.99% |
| Ethiopia | 54.44% |
| Syrian Arab Republic | 60.13% |
| Madagascar | 60.71% |
| Senegal | 62.86% |
| Rwanda | 66.82% |
| Andorra | 67.35% |
| Malawi | 70.14% |
South and Southeast Asia span the mid-70s to above 110%
South Asia shows a wide range: Nepal is at 112.23%, India 94.49%, Bangladesh 94.30%, Bhutan 86.54%, and Pakistan 74.14%. The difference between the highest and lowest reported values in this small regional group is close to 38 percentage points. Nepal’s value above 100% should not be interpreted as a superior learning-quality score, and Pakistan’s lower value should not be assigned to a single policy cause. The indicator measures a specific transition into the last primary grade.
In Southeast Asia, Thailand is at 102.55%, Viet Nam 100.59%, the Philippines 91.45%, Cambodia 90.99%, Malaysia 87.74%, and Lao PDR 87.25%. The region contains observations from the high 80s to above 100. Differences in the timing of school entry, repetition and re-entry patterns, and the age structure used in the denominator can all affect a gross ratio. Country rankings are therefore more informative when paired with the indicator definition than when read as a league table of school quality.
Nearby Central American economies also show substantial gaps
Costa Rica records 106.39%, Mexico 102.28%, Panama 96.20%, Guatemala 86.51%, El Salvador 82.63%, and Honduras 71.99%. Costa Rica and Honduras differ by more than 34 percentage points despite being in the same broader region. The contrast shows why geographic proximity does not guarantee similar flows through the end of primary schooling.
Chile, one of the South American economies with a 2024 observation in this dataset, is at 99.14%. Several large economies have no value in this single-year frame, so a regional narrative must not treat the reporting sample as complete coverage. A missing country is not a zero and is not automatically below the regional median; it is simply unobserved for the selected comparison year.
High European observations coexist with notable exceptions
Among reporting European economies, Hungary records 108.88%, Moldova 108.06%, and Albania 107.35%. Sweden is at 99.84%, Norway 98.71%, Finland 97.20%, and Germany 96.84%. Andorra, however, is at 67.35%. The spread is another reminder that expectations based on a country’s broader education reputation should not be used to overwrite an official value that measures a specific grade-entry flow.
A gross primary-completion indicator is not the same as adult educational attainment, exam results, or a learning assessment. A country can have high adult attainment accumulated over decades while a particular year’s grade-flow indicator behaves differently, and the reverse can also occur. The metric should be kept in its own conceptual lane before it is compared with other education statistics.
The 106 missing observations must remain distinct from zero
Of the 217 country and economy rows in the comparison frame, 111 have a 2024 value and 106 are source-missing. Replacing missing values with zero would create false low performers, push the mean and median downward, and erase the distinction between “no observation” and a genuinely low reported value. All descriptive statistics here therefore use only the 111 valid observations, and the map leaves missing boundaries in a separate no-data state.
The large amount of missingness is itself a limitation. This is not a complete ranking of all 217 economies; it is a same-year comparison of the economies that reported a usable 2024 value. One alternative would be to combine each economy’s latest available year, but that would sacrifice temporal comparability. Using one year keeps the time reference consistent while accepting lower coverage.
The low-resolution world map directly represents 83 of the 111 valid observations
The Natural Earth low-resolution boundary layer used for the visualization matches 83 of 111 valid observations (74.8%) by ISO3 code. Small islands and separately reported territories such as Monaco, Hong Kong, Macao, and several Caribbean and Pacific economies may not have their own polygon in this generalized file. They remain in the dataset, rankings, and summary statistics even when they are not visible as a filled area on the map.
That distinction matters because some of the highest observations belong to small economies. A choropleth is excellent for identifying broad spatial patterns, but it is not a substitute for the full table. Large countries occupy more visual area even though each economy contributes one observation to the unweighted distribution, while tiny economies may be hard to see or absent from the generalized boundary layer.
Primary completion is different from adult attainment and from learning outcomes
Adult educational-attainment indicators ask what share of today’s adult population has completed a certain level of schooling. This primary-completion indicator instead describes the current flow of new entrants into the last primary grade relative to a theoretical-age population. The two can complement one another, but they cannot be subtracted from each other to estimate progress because they use different populations and time horizons.
Learning assessments answer another question again. A country can move many pupils through the final primary grade while still facing weak reading or mathematics outcomes, and a strong assessment result does not reveal how many children failed to reach the assessed grade. Completion, participation, attainment, and learning should therefore be read together rather than collapsed into one broad claim about “education quality.”
A single 2024 cross-section cannot establish a trend or a policy effect
The map describes one year. It does not show whether an economy improved from 2023 or deteriorated from an earlier period. Trend analysis requires the same indicator across multiple years and attention to revisions, reporting gaps, and changes in demographic estimates. Gross ratios can also move noticeably when the age-specific denominator changes in small populations.
The same caution applies to causal explanations. Differences between neighboring economies can identify useful questions about access, progression, repetition, conflict, migration, or education finance, but the primary-completion ratio alone cannot isolate which factor produced the gap. Spatial association is evidence of a pattern, not proof of the mechanism behind it.
Source and practical reading guide
The source is the World Bank World Development Indicators series SE.PRM.CMPT.ZS, based on official education statistics associated with the UNESCO Institute for Statistics. The indicator is defined as new entrants to the last grade of primary education, regardless of age, divided by the population at the theoretical entrance age for that grade. This comparison uses official 2024 observations and excludes aggregate regional and income-group rows.
Three rules prevent the most common misreadings. First, gross values can legitimately exceed 100%. Second, a missing value is not zero. Third, the indicator is not a direct score of teaching quality or an individual child’s probability of graduating. With those distinctions in place, the data show a reporting distribution centered in the mid-90s but stretching from 40.76% to 135.00%, with substantial differences both across and within regions.
Frequently Asked Questions
Can the primary completion-rate indicator exceed 100%?
Yes. It is a gross ratio: new entrants to the last primary grade are counted regardless of age, while the denominator is the population at the theoretical entrance age.
Do the 106 economies without a 2024 value have a 0% completion rate?
No. They are source-missing observations and must remain separate from real low or zero values.
Does a higher primary completion rate prove better education quality?
No. The indicator measures a flow into the last grade of primary education; it does not directly measure learning outcomes, teaching quality, or equity.
Related Articles
Green Map creates custom-edited map images using open geographic data sources such as geoBoundaries, Natural Earth, OpenStreetMap, and government open data. These maps are edited visual materials, not raw data files, and are provided for education, documents, presentations, and graphic reference.